78:1 (2016) 131–137 | www.jurnalteknologi.utm.my | eISSN 2180–3722 |
Jurnal
Teknologi
Full Paper
FLOW IN STRAIGHT THROUGH LABYRINTH SEAL:
A
COMPARISON
OF
FLUID
STRUCTURE
INTERACTION EFFECTS
Saurav Das
a*,
Hoong Thiam Toh
a, Aminuddin Hj. Abu
a, Saikat Das
a,
Kuheli Mondal
a, Abhijnan Sarkar
ba
Malaysia Japan International Institute of Technology, Universiti
Teknologi Malaysia, Kuala Lumpur, Malaysia
b
Department of Chemical Engineering, University of Sasketchewan,
Sasketchewan, Canada
Article history
Received 4 June 2015 Received in revised form 8 July 2015 Accepted 15 December 2015 Received 2 July2014ceived
*Corresponding author
[email protected]
Graphical abstract
Abstract
A numerical study has been conducted to study the fluid structural interaction in a straight through labyrinth seal (half-model). The structural effect is identified and the fluid force is correlated with it which gives an estimate of the deformation that takes place in the seal. The distribution of the radial deformation along the seal axis for the rotational speed ranging from 6000 rpm to 15000 rpm is reported in this paper. The radial deformation which decreases the clearance between the rotating and stationary parts of sealing surface is an indication that centrifugal growth occurs. This finding is in agreement with other numerical and experimental work reported in the literature.
Keywords: Fluid structure interaction, structural growth, straight through, labyrinth seal, rotational speed
Abstrak
Satu kajian berangka telah dijalankan untuk mengkaji interaksi struktur cecair di lurus melalui Mohor labyrinth (separuh-model). Kesan struktur dikenalpasti dan tentera cecair korelasi dengan yang memberikan anggaran kecemaran yang mengambil tempat di meterai. Pengagihan kecemaran jejarian di sepanjang paksi meterai untuk kelajuan putaran antara 6000 rpm hingga 15000 rpm dilaporkan dalam kertas ini. Kecemaran jejarian yang mengurangkan kelegaan antara bahagian-bahagian berputar dan tidak bergerak dari permukaan mengedap adalah petunjuk bahawa pertumbuhan emparan berlaku. Dapatan ini adalah bersetuju dengan kerja-kerja lain berangka dan eksperimen yang dilaporkan dalam Kesusasteraan.
Kata kunci: Interaksi struktur bendalir, struktur pertumbuhan, terus melalui, meterai Labyrinth, kelajuan putaran
1.0 INTRODUCTION
Labyrinth seal, a typical non-contact gas turbine seal is a sealing device used in turbomachineries. They are preferred for their non-contact between stator and rotor, long operating hours and ease of assembly [1]. The primary feature of labyrinth seal is to provide a minimum flow area in the normal gas flow leakage flow path [2]. Labyrinth seals are used for sealing pressure differences between various components of the turbomachine. In jet engines they are used as inner stage seals or as seals on tip of the blades. Various configurations of labyrinth seal namely straight through, stepped with teeth on stator or rotor are in use, depending on the place and leakage flow rate in turbomachines. Under operation for long hours, labyrinth seals get deformed leading to their failure. This deformation of seal has been studied by researchers and the phenomena of fluid structure (FSI) interaction playing a key role is not accounted for.
Labyrinth seals are subjected to intense fluid pressure by virtue of complex flow path leading to serpentine leakage flow coupled with high temperature and high rotational speeds. These all sum up to their deformation due to centrifugal and thermal growth that takes place. Labyrinth seals have been the focus of research due to its wide use in civil and fighter aircrafts. It is constantly operated at high rotational speeds and high temperature so as to reduce the specific oil consumption. This leads to structural defects that creep in leading to its ultimate failure. The work carried out in NASA by Ludwig and Johnson [3] clearly points out the structural defects in gas turbine seals. However they did not correlate the structural defects with the fluid flow. The work carried out in Pratt and Whitney by G.J.Sturgess [4] used computational fluid dynamics (CFD) to find out the secondary air flow and percentage leakage flow. The focus was on correlating the pressure ratios, compressibility effect on the leakage flow and rotational effect was studied but not linked directly with the CFD results.
Wittig et al. [5] pointed out the increment in heat transfer rate in stepped labyrinth seal, by carrying out experimental studies and validating them with a finite element program. In the work carried out by Lee et al. [6] the leakage flow rate in labyrinth seal is found to be more in rotational case than for static one. The work by D.Childs et al. [7] found that for no prerotation, or fluid prerotation against shaft rotation, the labyrinth seal has the best rotordynamic stability followed in order by the smooth and honeycomb seals. Waschka et al. [8] carried out experimental work on straight through labyrinth seal with high rotational speeds to find the heat transfer rate. It was found that rotational effect has a significant influence on the stability of the flow and reduces the leakage rate and increases the heat transfer rate. Gamal et al. [9] pointed out that rotation of the shaft is only beneficial for the up-the-step seal. It was
noted that rotation has no effect on grooved shaft and grooved casing seals and has a detrimental effect on the down-the-step seal.
Steinetz et al. [10] showed that for durability and high reliability the seals must be able to operate in a non-contacting manner, with the possible exception of startup and shutdown. He pointed out that reducing secondary airflow leads to reduction in specific fuel consumption thus proving that reducing leakage plays a big role. Yucel et al. [11] found the rotor fluid interactions in stepped labyrinth seal. It was noted that the gas flow through the seals creates net pressure and shear forces acting on the rotor.
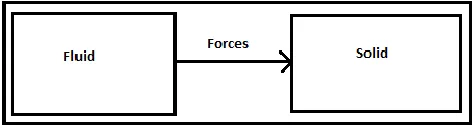
So in all the papers reported fluid forces do affect the solid seal but that has been ignored and hence approximate results are reported. Fluid Structure Interaction (FSI) has a sizeable effect on the health of the seal and hence should be included in study. FSI refers to the transfer of fluid and solid forces to their counterpart domain to study their effect on each other, as shown in Figure 1.
Figure 1 1 way FSI template
In the present study fluid forces have been transferred to the solid domain to study their interaction effect. This 1 way coupling gives a fair idea of the fluid forces by virtue of the serpentine leakage flow affecting the solid seal. The transfer of forces has taken place from the fluid solid interface and there is no third party software involved in the process. The present study tries to incorporate the FSI that has not been reported in literature as this will link
computational fluid dynamics (CFD) and
computational structural dynamics (CSD).
2.0 NUMERICAL MODELING
2.1 The Physical Problem considered
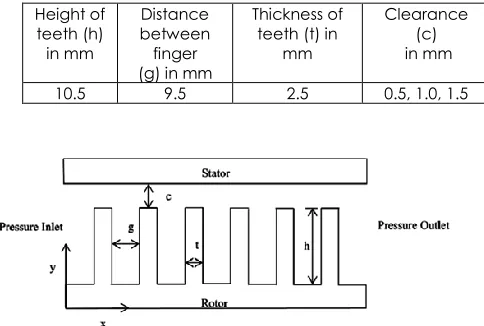
Figure 2 shows the cross-section of the seal, where ‘h’ denotes the height of fingers, ‘g’ denotes the distance between two fingers, ‘t’ the thickness of the fingers and ‘c’ the clearance. The Table 1 denotes the dimensions of the seal.
Table 1 Dimensions of the straight through labyrinth seal
Figure 2 Cross-section of the labyrinth seal
3.0 GOVERNING EQUATIONS
3.1 Governing Equations of Fluid Flow
As the flow in the straight through labyrinth seal is three -dimensional turbulence due to the flow conditions and structure and a high rotation speed exists, it is necessary to solve 3D Reynolds-averaged Navier–Stokes RANS equations to analyze the flow patterns, and to predict the leakage flow rate of the seals.
SAS Turbulence model is used for this study as it has been seen from literature that k-epsilon model is unable to capture the flow physics in small clearances. The formulation of SAS Turbulence model is given below.
Background of the SAS turbulence model is the transport equation for
k L
, withk
being the turbulence kinetic energy and L the integral length scale of turbulence. As this correlation equation is exact, a term-by-tem modelling leads to a more rigorous approach finally introducing the von Karman length scaleL
vKinto the transport equation. Transforming thek
-k L
model into thek
-
SST framework (Menter,1994), an additional source termSAS
Q
enters the turbulence scale equation for the specific dissipation rate
.2 2
2 2 2
2 1 1
max[ ( ) max( , ), 0]
SAS
vK j j j j
L k k k
Q S C
L x x k x x
This source is activated when the flow exhibits sufficient inherent instabilities and the numerical mesh is sufficiently refined. Consequently
the local eddy viscosity is reduced allowing a resolution of turbulence fluctuations. As the model is based on the
k
-
SST model, boundary layers are simulated using its RANS capabilities including automatic wall treatment [13-14].3.2 Governing Equations of Solid Domain
2
2
.
(1)
B
u
f
t
The boundary conditions needed to solve eq. (8) are,
.
(2)
S u
S
f
u
u
on
S
n
f
on
S
where
u
,
,f
and
represents displacements,density ,traction and stress tensor,
S
u andS
f represents the parts of the boundary with prescribed displacements,S
u
and tractions Sf
,
respectively andn
is a unit outward normal vector to the boundary.4.0 BOUNDARY CONDITIONS AND INITIAL
CONDITIONS (FLUID FLOW)
The rotor is housed in a stationary stator wherein the serpentine leakage flow takes place. The turbulence model SAS methodology is used for studying the complex fluid flow. After trial and error, a time step size of 10-5 s is chosen for the transient scheme. As
only half-model is used the fluid solid interface is chosen such a way that there is smooth transition of data from fluid to solid domain. No-slip boundary is adopted for wall. Frictionless contact is adopted for the pressure inlet and pressure outlet for structural analysis, wherein total deformation is determined for the rotor which is subjected to varying rotational speeds. The initial conditions are as follows:
At t=0, u=424m/s (velocity in x-axis) v=0 (velocity in y-axis) w=0 (velocity in z-axis) pinlet=358968 Pa
The seal is rotating at various speeds from 6000 rpm to 15000rpm where the rotational axis is x-axis.
4.1 Boundary Conditions and Initial Conditions (Solid)
The solid seal is given rotational velocity from 6000 rpm to 15000 rpm in steps of 1000 rpm. Frictionless contacts were followed for the two ends of the seal.
5.0 GRID RESOLUTION STUDY
To find out the appropriate mesh for the solid seal and fluid domain the grid resolution study is carried out. The grid resolution study for the solid shows three types of meshes as shown below in Table 2. Figure 3 Height of teeth (h) in mm Distance between finger (g) in mm
Thickness of teeth (t) in
mm
Clearance (c) in mm
below shows that the coarser mesh has much more change in total deformation. Rather there is much more steep changes in the coarser mesh. For the medium and the fine mesh there is not much change in total deformation. Here the change is gradual with no steep jump or changes. However for better clarity the finer mesh is adopted for this study.
Table 2 Three types of meshes with their corresponding elements
Types of meshes Number of elements
Coarse 9,312
Medium 12,568
Fine 16,811
Figure 3 Grid Independence study done for solid domain
For the fluid case shown in Figure 4 five different meshes were studied. The results show that the mesh containing 40,000 elements and 50,000 elements, there is a steep change in leakage flow rate. This continues till the mesh containing 62,475 elements. After that there is no change in leakage flow rate. So the mesh containing 78,865 elements and that having 86,782 elements shows the same leakage flow rate. However for better results the finer mesh of 86,782 elements is chosen for the present study.
Figure 4 Grid Independence study done for fluid domain
5.0 RESULTS AND DISCUSSION
5.1 Fluid Flow Results
The Mach Number comparison in Figure 5, for the three clearances follows the normal behavior where increasing the clearance increases the flow velocity. The serpentine leakage flow takes part in the small clearance whereby the buildup fluid forces effect the seal domain. The pattern for Mach number for the three clearances follows the normal behavior, wherein the lower clearances experiences lower Mach numbers than the other two clearances. However the jump for the 1.0mm clearance from the 0.5mm clearance is due to increase in flow velocity. The Mach number for the other two clearances i.e 1.0mm and 1.5mm are not much far apart while that for the 0.5mm clearance is much far apart. Hence this proves that the spacing of the clearances do play part in determining the Mach number. Also the Mach Number is not in the higher range but in the lower range which shows that this is a typical flow regime where there is not much change in the flow parameters but that is enough to pose detrimental effect on the flow physics that affects the solid seal.
Figure 5 Comparison of Mach Number for three clearances at 73mm from the inlet (last finger)
Dynamic pressure is the kinetic energy per unit
volume of a fluid particle. The effect of dynamic
does not show much anomaly where there is increment for the higher clearance. For the 0.5mm clearance there is not much change in dynamic pressure, however there is a quantum leap for the 1.0mm clearance. However for the 1.0mm and 1.5mm clearance there is a bit of change compared to the 0.5mm one. For all the three clearances the dynamic pressure follows a smooth increment. The dynamic pressures prove the presence of disturbances in the flow that is affecting the flow field.
Figure 6 Comparison of Dynamic Pressure for three clearances at 73mm from the inlet (last finger)
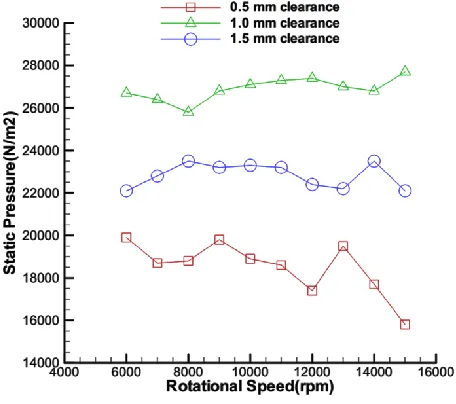
Figure 7 shows the static pressure for the three clearances with some peculiar properties. For the 0.5mm clearance it changes quite abruptly throughout, with occasional increment and decrement of static pressures where at the maximum rotational speed (15000rpm) it lowers down. This is not the case for the 1.0mm clearance where there is a particular pattern for the first few rotational speeds and then the pattern changes, becomes linear and slowly decreases at the maximum rotational speed. For the 1.5mm clearance the change is a bit similar to the 1.0mm, where there is reversal of pattern followed leading to decrement at first few rotational speeds, leading to gradual increment and slow decrement and finally there is sudden increment at the maximum rotational speed. The key feature of this graph is that the dynamic pressure for maximum clearance lies midway between the other two clearances, which have not been reported earlier. The dynamic pressure distribution shown in Figure 10 is more than the static pressure which shows that the pressure is affecting the flow physics which translates to the solid seal. Also the flickering nature of dynamic pressure shows that the flow translates to the solid seal leading to its deformation.
Figure 7 Comparison of Static Pressure for three clearances at 73mm from the inlet (last finger)
Figure 8 Comparison of Turbulent Kinetic Intensity for three clearances at 73mm from the inlet (last finger)
Figure 9 shows the turbulent kinetic energy for the three clearances. In the case of 0.5mm clearance, there is sudden decrement after the first few rotational speeds after which anomalous changes takes place which continues till the end. However for the 1.0mm clearance there is gradual increment right from start and after that it decreases all of a sudden and finally it gradually increases. For the 1.5mm clearance there is a mixture of the changes observed in the previous two clearances. At first there is gradual decrement in turbulent kinetic energy where there is sudden abrupt decrement which leads to increment for few speeds and decrement after few which continue till the end. Hence we can safely say that the 1.0 mm and 1.5mm clearance where the change takes place quite rapidly follows a steady form. The turbulent kinetic energy for the maximum clearance lies midway between the other two clearances is an important feature of the plot. Also there is a quantum jump from the 0.5mm clearance to the 1.0mm clearance which is another important feature of the plot. The change in turbulent intensity in the previous graph shows that turbulent structures might affect the flow physics which is carried over to the solid seal. The same thing happens for the case of turbulent kinetic energy and this might have led to increment of fluid forces leading to its deformation.
Figure 9 Comparison of Turbulent Kinetic Energy for three clearances at 73mm from the inlet (last finger)
The present numerical work has been compared with Kim et al. [17] and the Figure 10 shows the validation plot. The present study follows the same trend as Kim et al., however there remain some discrepancies regarding the mass flow rate. The present work has been undertaken to correlate the structural effect with the fluid flow and how they affect each other.
Figure 10 Comparison plot for three tip clearances
5.2 Structural Result
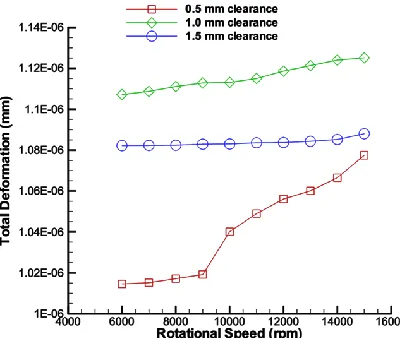
The plots point to the fact that centrifugal growth takes place in all the clearances. This is correlated by the fact that for the maximum clearance the total deformation at the start is much higher and it follows a steady trend. From the plots there is a peculiar case where the total deformation for the maximum clearance lies between the other two clearances. This trend has not been reported tilldate and it points to the centrifugal growth that takes place in the fingers of the seal.
Figure 11 Comparison of total deformation for three clearances
Acknowledgement
We are grateful for the UTM scholarship to Author 1.
References
[1] H. C. Hogh. 2006. Compressor Technology. Wiley.
[2] R. C. Bill. 1980. Wear of Seal Materials Used in Aircraft
Propulsion Systems. Wear. 59(1): 165-189.
[3] L. P. Ludwig and R. L. Johnson. 1974. Sealing Technology
for Aircraft Gas Turbine Engines. NASA Technical Memorandum, Tenth Propulsion Conference, San Diego, California, October 21-24.
[4] Geoffrey J.Sturgess, Prasanta Datta. 1988.Application of
CFD to Gas Turbine Engine Secondary Flow Systems-The
Labyrinth Seal, AIAA/AS ME/SAE/ASEE 24th JOINT
PROPULSION CONFERENCE July 11-13, Boston,
Massachusetts.
[5] S. Wittig, K. Jacobsen, U. Schelling, S. Kim. 1988. Heat
Transfer in Stepped Labyrinth Seal. Journal of Engineering
for Gas Turbines and Power. January, 110: 63-69.
[6] K. W. Lee, S. U. Lee, C. H. Kim, T. H. Song. 1990. Numerical
Analysis in the Flow Field of a Labyrinth Seal, International Compressor Engineering Conference, Paper 778.
[7] Dara Childs, David Elrod, and Keith Hale. 1989.Annular
Honeycomb Seals: Test Results for Leakage and Rotordynamic Coefficients; Comparisons to Labyrinth and
Smooth Configurations. ASME Transactions Journal of
Tribology. 22: 143-159.
[8] W. Waschka, S. Wittig, S. Kim. April, 1992. Influence of High
Rotational Speeds on the Heat Transfer and Discharge
Coefficients in Labyrinth Seals. Journal of Turbomachinery.
114: 462-468.
[9] H.A. El-Gamal, T. H. Awad and E. Saber. 1996. Leakage
from Labyrinth Seals Under Stationary and Rotating
Conditions. Tribology International. 29(4): 291-297.
[10] Bruce M. Steinetz, Robert C. Hendricks John and Munson. 11-15 May 1998. Advanced Seal Technology Role in Meeting Next Generation Turbine Engine Goals, RTO AVT Symposium on Design Principles and Methods for Aircraft Gas Turbine Engines held in Toulouse, France, and published in RTO MP-8.
[11] Ug¨ur Yucel. 2004. Calculation of Leakage and Dynamic
Coefficients of Stepped Labyrinth Gas Seals. Applied
Mathematics and Computation. 152: 521-533.
[12] Tong Seop Kim and Kyu Sang Cha. 2009. Comparative Analysis of the Influence of Labyrinth Seal Configuration
on Leakage Behavior. Journal of Mechanical Science and
Technology. 23: 2830-2838
[13] F. R. Menter, R. Langtry and T. Hansen. July 2004. CFD
Simulation of Turbomachinery Flows-Verfication, Validation and Modelling, European Congress on Computational Methods in Applied Sciences and Engineering ECCOMAS 2004, Jyväskylä, 24-28 July, 2004.