ABSTRACT
BRIDGERS, ELIZABETH NICOLE. Design of Processing Conditions for Conversion of Sugar and Starch Based Crops to Value Added Products.(Under the direction of Dr. Mari S. Chinn.)
This study focused on sweet sorghum and purple-fleshed industrial sweetpotatoes. Sweet sorghum is a crop which produces relatively high quantities of easy to process, directly fermentable aqueous sugar. Purple-fleshed industrial sweetpotatoes (ISPs) offer two viable resources for value added products in its combination of high dry matter (~32%) and anthocyanin content. The objectives of this project was to generate the information
necessary to investigate the processing conditions for maximum ethanol production of sweet sorghum juice preparations, examine the effectiveness of different enzyme treatments on glucose and ethanol production as well as procedures for anthocyanin extraction from purple-fleshed industrial sweetpotatoes, and create a demonstration scale system for processing sweet sorghum and ISPs so that scale up processing conditions and related challenges can be studied.
The effects of different ISP preparations, enzyme loadings, and time on starch conversion and sugar production during liquefaction and saccharification were examined, in addition the effects of yeast concentration and salt supplementation on fermentation of produced sugars to ethanol were investigated. Results showed that the majority of available starch, 44.2 and 49.6% of dry matter, was converted during liquefaction of flour and fresh sweetpotato preparations, respectively, with the addition of 0.045 KNU-S/g dry ISP of Liquozyme SC after 2 hours incubation (68.8 and 67.0% initial starch contents, respectively).
Saccharification was able to increase the breakdown of starch, but its primary function was conversion of short chain carbohydrate polymers to fermentable sugars. The addition of 5.0 AGU/g of Spirizyme Ultra was able to produce 644 and 582 mg/g starch in flour and fresh preparations, respectively. Yeast were able to produce 39.2 and 48.8 g/L of ethanol for flour (25% w/v substrate loading) and fresh (12.5% w/v) ISP, respectively, after 48 hours using 0.1% w/v yeast without salts.
The effects of solvent type, solid loading, and incubation temperature on total monomeric anthocyanin and phenolic concentrations during extraction processing of purple-fleshed sweetpotatoes were determined. A subsequent hydrolysis process evaluated the effect of initial extraction conditions on the production of fermentable sugars. A maximum
Design of Processing Conditions for Conversion of Sugar and Starch Based Crops to Value Added Products
by
Elizabeth Nicole Bridgers
A thesis submitted to the Graduate Faculty of North Carolina State University
in partial fulfillment of the requirements for the Degree of
Master of Science
Biological and Agricultural Engineering
Raleigh, North Carolina 2010
APPROVED BY:
_________________________ _________________________
V. Den Truong Matthew W. Veal
_________________________ _________________________
BIOGRAPHY
Elizabeth ―Nicole‖ Hill was born on October 26, 1983 in Rocky Mount, North Carolina. She
is the first born of Fred and June Hill and the ―wiser‖ older sister of Jessica and Jeremy Hill who
have self proclaimed to be the coolest people ever. Not long after her LITTLE brother was born,
her family moved to Rosewood, North Carolina. As a child she was exposed to the Wolfpack
family by her mother and fell in love with the ―red and white for NC STATE‖ (Thus hating the
color Carolina Blue). Throughout school she played every sport available including soccer,
basketball, volleyball, track, and softball.
Nicole graduated from Rosewood High School first in her class in 2002, where she went on
to study Biological Sciences at North Carolina State University. After 2 years of undergraduate
study, Nicole longed to have a specific career path in the field of science and biotechnology.
Therefore she added another field of study, Biological and Agricultural Engineering, and a minor
in Agroecology to her undergraduate agenda. After graduating with her first degree in Biological
Sciences in the fall of 2006, Nicole had more free time to pursue opportunities for laboratory and
research experience. An opportunity arose when she was attending a meeting for the American
Society of Agricultural and Biological Engineers where she met the organization’s advisor Dr.
Mari Chinn. Dr. Chinn lead and participated in many research efforts focused on bio-based
products and attracted Nicole to her field of study with the almighty SWEETPOTATO. Not only
did Nicole get the opportunity to work with sweetpotatoes, she also gained valuable knowledge
and experience with unfamiliar crops like sweet sorghum and paper pulp.
After graduating with her last undergraduate degree in the spring of 2008 she was motivated
department. After only a year she was able to multitask between subject areas by completing her
previously started work from undergrad on sweet sorghum and sweetpotatoes as well as
incorporating two new studies related to purple sweetpotatoes and engineering design and
fabrication.
At the same time Nicole FINALLY married her high school sweetheart Tray Bridgers on
May 2, 2009. Nicole and Tray were fortunate to know each other since Kindergarten and dated
for 7 years before tieing the knot. Tray and Nicole were able to share many great experiences in
college since he also gradutated from North Carolina State University. After graduate school,
Nicole will continue to live with her husband in Newton Grove, North Carolina and intends to
ACKNOWLEDGEMENTS
First and foremost I would like to thank God. In the process of putting all of this research
together I realized how much I loved working in this area. God has given me the power to believe
in my passion and pursue my dreams and I could never have done this without the faith I have as
a christian.
The most important person that I’m deeply grateful to and have had as a mentor through this
whole process has been Dr. Mari Chinn. I would like to express my appreciation for all of her
efforts as my adviser and chief committee member. Over the past three years she has not only
helped me gain the knowledge and skills I needed to become a successful researcher and
engineer, but has also challenged and inspired me to hold myself to a higher standard and
produce quality work in everything I strive to do. She never made my journey a ―piece of cake‖
and I appreciate that so much. She will never know how much I valued the weekends in the lab,
extra reading, confused phone calls, and house visits with meals where she worked ovetime to
help guide me to complete my work. She has definitely been the backbone of my success at
NCSU and has also been a great friend to me along the way. DC, we have been able to share
some very memorable experiences together and I hope they can continue long after I’m done here
at NCSU.
I would also like to thank all of my acting committee members: Dr. Veal, Dr. Truong, andDr.
Yencho. I appreciate all of the meetings and information you have shared and for the support
you always provided throughout this whole process.
My family has been the biggest support through my YEARS of schooling and have always
Tray, thanks for supporting me and motivating me to perform well and succeed. You will never
know how much you inspired me and drove me to finalize all of my work. You have given me
the love and encouragement that I needed to focus on my work every day, so that one day I could
help you provide for our life together. Thanks for keeping me stress and worry free and for
listening when I needed a critic. Thank you for always being present and attentive and I
appreciate you staying up late to listen to my final presentation, even if you did fall asleep
halfway through, I know you were still there in spirit. Jessica, you are my best friend and
without you I would have never survived the stress of Weaver Labs. You have been my rock
since we were young and have always supported anything I’ve strived to pursue and accomplish.
Thanks for giving me a little humor and sarcasm when I needed it the most. I do not know what I
would have done without your grammar skills getting rid of my run-on sentences and making
sure my writing was approved at a 2nd grade level. And as you once told me, and I happen to
agree with you, I have the most AMAZING sister ever and I should be thrilled! Jeremy, thanks
for always giving me someone to look up to in more ways than height can give you. You hold
yourself to a higher standard than others and I admire and strive to act like that in my own
behavior and actions. You and Jessica always keep me grounded and never hesitate to call me
out when I need it. Hannah, you are like another sister to me and Jessica. Without you Jeremy
would not be half of the man he is today, so thanks for your support and friendship and big
personality in such a little body.
Mom and Dad, thanks for all of your support for what I have been able to accomplish in my
college career and in everything I have done throughout my life. Mom, you were the one that
showed me independence, responsibility, and drive to accomplish the goals I set to do. You were
Dad, you inspired me to be an engineer and to accomplish any thing I set my mind to. You
always gave me humor, riddles, and brain teasors to test my skills and made me strive for higher
academics. I know we have all been through some rewarding and tough periods in our life but I
am still proud that you are my parents.
Finally, I’d like to thank all of my friends for the support they have provided me. Kristin, for
the conversations on my long drives to Raleigh and for giving me a life outside of school work.
You do not know how much talking to you over a FEW margaritas can lighten my stressful
week. Heiny, for the fun and entertainment you provide now and the years we were roomates.
Distracting my FE prep with our homemade FC prep and making TOO MANY smoothies was
great, but not as good as going to Cookout for Heath milkshakes late at night. Your friendships
TABLE OF CONTENTS
LIST OF TABLES ... xi
LIST OF FIGURES ... xii
CHAPTER 1: Background and Literature Review ... 1
1.1 Biobased Products ... 3
1.2 Biomass Conversion Technologies for Value Added Products ... 4
1.3 Feedstocks Available for Biomass Conversion... 5
1.4 Additional Conversion for Starch Based Feedstocks ... 6
1.4.1 Starch Composition ... 7
1.4.2 Starch Composition ... 8
1.4.2.1 Acid Hydrolysis and High Pressure Extrusion ... 8
1.4.2.2 Enzymatic Hydrolysis ... 10
1.5 Ethanol Production by Fermentation ... 12
1.6 Sugar and Starch Crops ... 13
1.6.1 Sugar Crops ... 13
1.6.2 Starch Crops ... 14
1.7 Anthocyanins in Purple-fleshed ISPs ... 15
1.8 Scale up of Biomass Conversion and Ethanol Production ... 17
1.9 Objectives ... 18
1.10 References ... 19
CHAPTER 2: Influence of Juice Preparations on the Fermentability of Sweet Sorghum... 26
2.1 Abstract ... 26
2.2 Introduction ... 27
2.3 Materials and Methods ... 29
2.3.1 Juice Preparation ... 29
2.3.2 Experimental Design and Statistical Analysis ... 30
2.3.3 Fermentation ... 30
2.3.4 Analysis Methods ... 32
2.3.4.1 Micronutrient Analysis ... 32
2.3.4.2 Sugar and Ethanol Determination ... 33
2.4 Results and Discussion ... 34
2.4.1 Sorghum Juice Characteristics ... 34
2.4.2 Fresh Juice- Sterilization and Yeast Type ... 36
2.4.3 Nonsterile Fresh Juice- Yeast Type and pH ... 39
2.4.4 Frozen Juice ... 42
2.4.5 Fresh and Frozen Juice Comparisons ... 43
2.5 Conclusions ... 46
2.6 Acknowledgements ... 46
CHAPTER 3: Design of Processing Conditions of the Purple Industrial
Sweetpotato to Fermentable Sugars ... 49
3.1 Abstract ... 49
3.2 Introduction ... 49
3.3 Materials and Methods ... 52
3.3.1 Industrial Sweetpotato Preparation ... 52
3.3.2 Experimental Design and Statistical Analysis ... 53
3.3.3 Commercial Enzymes and Yeast ... 54
3.3.4 Liquefaction ... 55
3.3.5 Saccharification ... 55
3.3.6 Fermentation ... 56
3.3.7 Analysis Methods ... 57
3.4 Results... 58
3.4.1 Liquefaction ... 58
3.4.2 Saccharification ... 62
3.4.3 Fermentation ... 67
3.4.4 Anthocyanin and Phenolic Concentrations during Hydrolysis ... 69
3.5 Discussion ... 70
3.6 Conclusions ... 74
3.7 Acknowledgements ... 74
3.8 References ... 75
CHAPTER 4: Extraction of Anthocyanins from Industrial Purple-fleshed Sweetpotatoes and Enzymatic Hydrolysis of Residues for Fermentable Sugars ... 79
4.1 Abstract ... 79
4.2 Introduction ... 80
4.3 Materials and Methods ... 83
4.3.1 Extraction Solvents, Commercial Enzymes and Yeast Culture ... 83
4.3.2 Industrial Sweetpotato Preparation ... 84
4.3.3 Experimental Design and Statistical Analysis ... 84
4.3.4 Extraction of Anthocyanins and Subsequent Hydrolysis of ISP Residues ... 85
4.3.5 Starch Conversion and Ethanol Production from ISP Residues ... 87
4.3.6 Analysis Methods ... 88
4.4 Results... 89
4.4.1 Extraction of Anthocyanins and Subsequent Hydrolysis of ISP Residues ... 89
4.4.2 Starch Conversion and Ethanol Production from ISP Residues ... 95
4.5 Discussion ... 98
4.6 Conclusions ... 101
4.7 Acknowledgements ... 102
CHAPTER 5: Design of a Hydrolysis and Fermentation Demo-Scale System for
Scale up of Biomass Conversion Processes ... 106
5.1 Abstract ... 106
5.2 Introduction ... 106
5.3 Hydrolysis Vessel ... 109
5.3.1 ISP Physical Properties ... 109
5.3.2 Hydrolysis Sensors ... 113
5.3.3 Mixing ... 116
5.3.4 Lid Design and Component Placement ... 119
5.4 Fermentation Vessel ... 121
5.4.1 Fermentation Sensors ... 122
5.4.2 Lid Design and Component Placement ... 124
5.5 Liquid Handling (Inlets, Outlets, and Sampling) ... 125
5.6 Data Acquisition and Control ... 127
5.7 Conclusions ... 128
5.8 Acknowledgements ... 129
5.9 References ... 129
APPENDICES ... 130
Appendix A: SAS® Analyses for Fermentation of Sweet Sorghum Juice ... 131
Appendix A.1 Fresh Juice- Sterilization and Yeast type ... 131
Appendix A.2 Nonsterile Fresh Juice- Yeast type and pH ... 139
Appendix A.3 Frozen Juice ... 148
Appendix A.4 Fresh and Frozen Juice Comparisons ... 151
Appendix B: Additional Sweet Sorghum Studies ... 160
Appendix B.1 Fermentation of Sweet Sorghum Concentrated Syrup ... 160
Appendix B.2 Fermentation of Filtered vs. Non-filtered Sweet Sorhgum Juice ... 161
Appendix B.3 Fermentation of Sitting vs. Non-sitting Sweet Sorghum Juice ... 162
Appendix C: SAS® Analysis for Liquefaction of purple-fleshed ISPs- Liquozyme SC® ... 163
Appendix C.1 Flour and Fresh ISPs ... 163
Appendix D: SAS® Analyses for Saccharification of purple-fleshed ISPs- Spirizyme Ultra® ... 169
Appendix D.1 Flour and Fresh ISPs ... 169
Appendix D.2 Total Monomeric Anthocyanin and Phenolics ... 198
Appendix E: Preliminary Anthocyanin Extraction Data ... 210
Appendix E.1 Solvent and Washing Effect on Liquefaction ... 210
Appendix F: SAS® Analyses for Extraction and Subsequent Hydrolysis ... 212
Appendix F.1 Total Monomeric Anthocyanin and Phenolics... 212
LIST OF TABLES
Table 2.1 Composition of total Kjeldahl nitrogen (TKN), total ammonia nitrogen (TAN), nitrates and nitrites, total phosphorus (Total-P), ortho-phosphates (Ortho-P) and potassium (K) in non-sterile and
sterile samples of fresh sweet sorghum juice ... 33 Table 2.2 ANOVA of main effects and interactions of yeast type (Yeast),
sterilization (Sterilize), and time factors (Time) on change in ethanol (Δ ethanol) concentration over the 3 day period for fresh and frozen
juice ... 36 Table 2.3 ANOVA of main effects and interactions of pH, yeast type (Yeast),
and time factors (Time) on consumption of sucrose (Δ sucrose), glucose (Δ glucose), and fructose (Δ fructose) as well as ethanol production (Δ ethanol) over the 3 day period for nonsterile fresh
juice ... 39 Table 2.4 ANOVA of main effects and interactions of sterilization (Sterilize),
juice type (JT), and time factors (Time) on consumption of sucrose (Δ sucrose), glucose (Δ glucose), and fructose (Δ fructose) as well as ethanol production (Δ ethanol) over the 3 day fermentation period ... 42 Table 3.1 ANOVA of main and interaction effects of liquefaction incubation
time (Hour), α-amylase enzyme loading rate (Enzyme), and ISP preparation (Prep) on change in reducing sugars (Δ RS) and change in starch content as alcohol insoluble solids (Δ AIS) for
purple-fleshed ISPs during liquefaction ... 58 Table 3.2 ANOVA of main and interaction effects of saccharification
incubation time (Hour), glucoamylase enzyme loading rate (Enzyme), and ISP preparation (Prep) on glucose concentration (Glucose) and change in starch content as alcohol insoluble solids
(Δ AIS) for purple-fleshed ISPs during saccharification ... 62 Table 3.3 Total Monomeric Anthocyanin concentration for 1.0, 2.5, and 5.0
AGU/g dry ISP glucoamylase enzyme loading over saccharification
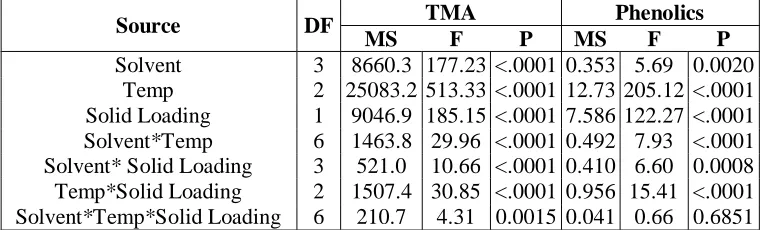
Table 4.2 ANOVA of main and interaction effects of solvent type (Solvent), extraction temperature (Temp), and solid loading (Solid Loading) on total monomeric anthocyanin (TMA) and phenolic (Phenolics)
concentration for purple-fleshed ISPs after extraction ... 88 Table 4.3 ANOVA of main and interaction effects of solvent (Solvent),
extraction temperature (Temp), and solid loading (Solid Loading) on change in alcohol insoluble starch (ΔAIS) and glucose concentration (Glucose) for purple-fleshed ISPs after extraction and hydrolysis ... 91 Table 5.1 Physical properties of ISPs ... 109 Table 5.2 Viscosity Readings at different rotational speeds for fresh and flour
purple-fleshed ISP preparations ... 118
LIST OF FIGURES
Figure 2.1 Sucrose (♦), glucose (■), fructose (▲) concentrations, and ethanol (×) production for nonsterile (a) and sterile (b) fresh juice treatments over time and across yeast type ... 36 Figure 2.2 Ethanol production over time for pH 4.5 and 5 treatments of
non-sterile fresh juice ... 40 Figure 2.3 Nonsterile total sugar consumption (□), Nonsterile ethanol
production (■), Sterile total sugar consumption (○), and Sterile ethanol production (●) for fresh (a) and frozen (b) juice treatments
over time ... 43 Figure 3.1 Change in starch content as percent dry matter over α-amylase
enzyme loading (volume of enzyme/g dry ISP) across liquefaction incubation time for (■) flour and (■) fresh treatments. Initial AIS
starch content for flour (---) and fresh (- - -) ISP preparations ... 58 Figure 3.2 Change in starch content as a percent of dry matter over liquefaction
incubation time (hrs) for (■) flour and (■) fresh treatments across α-amylase enzyme loading. Initial AIS starch content for flour (---)
and fresh (- - -) ISP preparations ... 59 Figure 3.3 Change in reducing sugars over liquefaction incubation time for
flour (■) and fresh (▲) treatments across α-amylase enzyme loading ... 60 Figure 3.4 Change in starch content as percent dry matter over saccharification
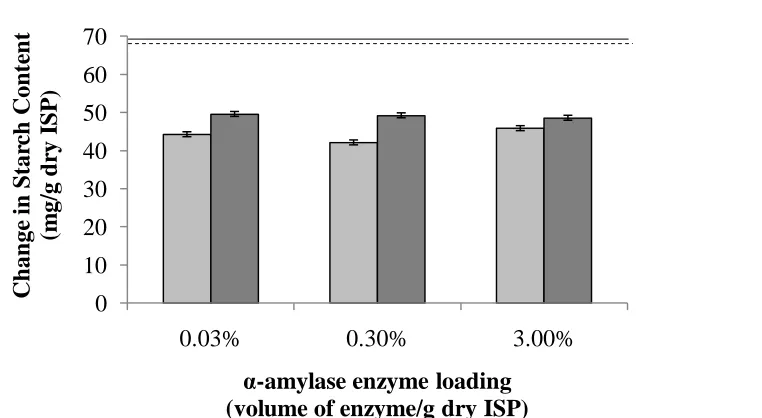
incubation time at □ 1.0, ■ 2.5, and ■5.0 AGU/g dry ISP enzyme loadings for (a) flour and (b) fresh treatments. Initial starch for flour (---) and fresh (- - -) ISP preparations... 62 Figure 3.5 Glucose for ♦1.0, ■ 2.5, and ▲ 5.0 AGU/g dry ISP enzyme loadings
and ○ total sugar concentration, across enzyme loading, over time (0, 24, 48, 72 hours) for (a) flour and (b) fresh ISP treatments during saccharification. Total sugars represent maltotriose, maltose,
glucose, and fructose ... 64 Figure 3.6 Glucose (Δ,▲), total sugar (◊,♦) and ethanol concentration (□, ■)
over time at (Δ,◊,□) 0.01 and (▲,♦,■) 0.1 % w/v yeast
concentrations for (a) flour and (b) fresh ISP preparations. Total
Figure 4.1 TMA concentration over extraction incubation temperature for (□) 70% ethanol, (■) 70% acidified ethanol, (■) 70% methanol, and (■) 70% acidified methanol at (a) 3.3% w/v and (b) 17% w/v solid
loadings ... 89
Figure 4.2 Phenolic concentration over extraction temperature for (□) 70% ethanol, (■) 70% acidified ethanol, (■) 70% methanol, and (■) 70% acidified methanol, across solid loading ... 90
Figure 4.3 Change in starch content as a percent of dry matter after hydrolysis over extraction incubation temperature for (□) 70% ethanol, (■) 70% acidified ethanol, (■) 70% methanol, and (■) 70% acidified methanol at (a) 3.3% w/v and (b) 17% w/v solid loading treatments. Initial starch content for ISP (---) ... 92
Figure 4.4 Glucose concentration after hydrolysis over extraction temperature for (□) 70% ethanol, (■) 70% acidified ethanol, (■) 70% methanol, and (■) 70% acidified methanol, across solid loading ... 94
Figure 4.5 Glucose concentration over extraction conditions for (■) 2.5 and (■) 5.0 AGU/g dry ISP after hydrolysis ... 95
Figure 4.6 (a) Glucose concentration and (b) ethanol production within the 5.0 AGU/g dry ISP enzyme loading over fermentation incubation time for extraction conditions of (♦) acidified ethanol at 50°C, (♦) acidified ethanol at 80°C, (♦) acidified methanol at 80°C, (◊) no extraction fermentation control ... 96
Figure 5.1 General diagram and picture of hydrolysis vessel ... 108
Figure 5.2 Pictures of sensors used in hydrolysis vessel: a) liquid level, b) pH, c) temperature ... 114
Figure 5.3 Motor mount for hydrolysis vessel ... 117
Figure 5.4 Hydrolysis lid design and picture... 119
Figure 5.5 General diagram and picture of Fermentation Unit ... 120
Figure 5.6 Sensors for fermentation vessel including: a) liquid level/RTD, b) pH/Thermocouple, and c) carbon dioxide ... 122
Figure 5.8 Hydrolysis Pseudocode ... 126 Figure 5.9 Fermentation Pesudocode ... 126 Figure B.1 Concentrated sweet sorghum syrup over fermentation incubation
time for (□) 15 Brix, (■) 20 Brix, and (■) 25 Brix initial dilution
concentrations ... 162 Figure B.2 Sweet sorghum juice over fermentation incubation time for (□)
filtered and (■) nonfiltered preparations ... 163 Figure B.3 Sweet sorghum juice over fermentation incubation time for (□) 24 hr
sitting, (■) non-sterile fresh and (■) sterile fresh preparations ... 164 Figure F.1 Change in starch content as percent dry matter over solvent type for
treatments containing (■) solvent and (■) sterile water during
liquefaction. Initial starch content of ISP (---) ... 255 Figure F.2 Change in reducing sugars over solvent type for treatments
CHAPTER 1
Background and Literature Review
The demand for energy in the world is rising and continues to increase every year due to economic and technological growth. In 2006 the total energy demands for the United States reached 99.9 quadrillion BTU and was recently determined in 2008 to be 99.4 quadrillion BTU, where 74% was produced in the country and 26% was imported (EIA-c, 2009). Even in our current economic downturn, by 2030 this energy demand is projected to expand by 44% from the 2006 levels (IEO, 2009). Although the demand for manufacturing and
consumer goods and services have slowed since the start of the September 2008 recession, it is believed that most nations will begin to return to trend growth within the next 12 to 24 months (IEO, 2009).
World petroleum reserves were estimated at 1,238,892 billion barrels as of January 2007, and more is being discovered each year (EIA-b, 2008). However, those reserves are not located in the major consuming countries of the western hemisphere. Eight countries have 81% of all world crude oil reserves, six countries have 70% of all natural gas reserves and eight countries have 89% of all coal reserves (Sayigh,1999). Tense relations between
of petroleum usage in terms of fuel security and carbon emissions are increased (Gomez et al, 2008). Therefore, action is needed to decrease US national dependence on foreign oil to lessen the threat of economic and energy security in our country.
To mitigate this ever growing trend, an economy based on renewable resources has been introduced to supplement the nonrenewable resources the United States is currently relying on for their energy source. Non-renewable resources arenatural sources of energy that have a limited supply and may not be produced or reused on a scale which can sustain its
consumption rate. These resources often exist in a fixed amount, or are consumed much faster than nature can recreate them. Fossil fuels are a subset of nonrenewable resources and are currently the world’s main energy and manufacturing source, for items like detergents, synthetic fibers (nylon, polyester, acrylic), plastics, paints, food additives, pesticides, cosmetics, and fuels. Fossil fuel uses are dramatically increasing in the consumer product, agriculture, and transportation sectors (EERE, 2008). This is not only creating problems in terms of supply, but is also believed to be negatively impacting the environment.
Nonrenewable resources also contribute to a buildup of carbon dioxide in the upper atmosphere, mainly as a result of fossil fuel combustion.
can help alleviate problems that arise from the dependence on nonrenewable resources by providing an internal source of energy for our nation.
1.1 Biobased Products
Biomass, which is comprised of carbohydrates, can be used to produce some of the products that are commonly manufactured from petroleum and natural gas, or hydrocarbons because both contain the essential elements of carbon and hydrogen (Pastor et al., 2003). Bioproducts are industrial and consumer goods manufactured wholly or in part from renewable biomass (Pastor et al., 2003). Using biomass to create industrial and consumer products is not a new idea. However, new products are emerging that do not have historical roots in biomass (Pastor et al., 2003). Biomass can be converted into heat, electricity, and alternatives to gasoline and diesel. The bioenergy that results can be a clean, renewable domestic alternative to fossil fuels (Greene, 2004). Biomass can also be converted into products such as plastics, textiles, fabrics, and many other consumer goods. Currently, the primary renewable resources used to create this remarkable diversity of industrial and consumer goods are corn, wood, soybeans, and plant oils (Pastor et al., 2003).
crops, like corn and soybeans, that have the potential to lessen the large dependence of our nation on fossil fuels. Biofuels have, in principle, lower carbon emissions because they are produced within the short-term carbon cycle, and their combustion only returns as much carbon dioxide to the atmosphere as plant growth has taken out (Gomez et al., 2008).
1.2 Biomass Conversion Technologies for Value Added Products
There are many processes for converting biomass components to value-added products, fuels, and power. They can be broadly characterized by two main routes: thermochemical processing and biochemical processing.
Thermochemical processing utilizes catalysts (acid, metal, or a combination) and/or high pressure and temperature to convert biomass components to the desired product. Oils and bioproducts from woody and other lignocellulosic resources are typically processed using thermochemical methods. Thermochemical processes such as torrification, gasification and pyrolysis have been explored to some degree for the production of bioproducts but are not in widespread commercial use (Pastor et al, 2003). In torrification the production of char is used for soil amendments, while pyrolysis has been used to refine fuel from bio-oils. Gasification produces gas that can be converted to liquid hydrocarbons and fuel using
temperature where catalysts can complicate the process due to chemical and sometimes physical changes that can occur (Steynberg, 2004)
Biological processing uses enzymes and microorganisms to convert (e.g., via hydrolysis and fermentation) biomass feedstocks to the desired product. This product may already be in a desirable form within the plant (e.g., extractives, fiber) as well (Pastor et al., 2003). In biological processing, three types of manipulations to the biomass can occur separately or in combination depending on the biomass composition. The first is pretreatment, where the lignin content in lignocellulosic biomass is reduced. Next is enzymatic hydrolysis where enzymes are used to break down biomass into simple sugars (e.g. glucose). The glucose produced can provide the substrate for the production of ethanol, many other organic liquids of low molecular weight, and a number of pharmaceutical products, notably antibiotics by microbial fermentation (Stephen et al., 2006).
In some cases, products can be derived from more than one conversion technology, or they can be produced in a series of steps that involve both thermochemical and biochemical processes.
1.3 Feedstocks Available for Biomass Conversion
produce bioproducts in a more sustainable fashion since the majority of the crops do not compete with food or the agricultural land used to produce it.
The production of biobased products from sugars and starches is straightforward. Sugar crops can be directly fermented or used for other value-added products. Starches are
comprised of two complex carbohydrates (amylose and amylopectin) that need to undergo initial conversion steps before reaching a simple sugar form. The dilemma with these types of crops, like corn, involves the risk of diverting farmland or crops for production of
biobased products which may be detrimental to the food supply on a global scale.
Lignocellulosic biomass (consisting of three main constituents: cellulose, hemicellulose and lignin) is perceived as a valuable and largely untapped resource for the future bioindustry (Pastor et al., 2003). However, recovering the components in a cost-effective way represents a significant challenge because there are a number of technical barriers that need to be overcome before lignocellulosic biomass potential can be realized (Gomez et al., 2008). This is why lignocellulosic biomass is considered a 2nd generation crop because while research and development of its conversion processes is essential, the investigation in 1st generation crops will provide a more near-term alternate for relieving the dependence on nonrenewable resources for energy within the next few years.
1.4 Conversion of Starch Based Feedstocks
green leaves and in the amyloplasts of storage organs such as seeds, tubers, and roots (BeMiller and Whistler, 2009).
1.4.1 Starch Composition
Starch is a well-known polymer of glucose, linked by glycosidic bonds, that is comprised of two complex carbohydrates, amylose and amylopectin. Amylose is the minor component (20-30% in general) in starch that consists mainly of α-1,4 linked D-glucopyranosol residues (BeMiller and Whistler, 2009; Hoover, 2001). Amylopectin is the major component (70-80% on average) in starch that is very large and branched consisting of much shorter linear chains of α-1,4 D glucose residues connected by α-1,6 glucosidic side chain linkages
(BeMiller and Whistler, 2009; Hoover, 2001; Peroni et al., 2006). Of the two components of starch, amylopectin presents the greatest challenge to hydrolytic enzyme systems because of its branching structure making it difficult to break down. Amylose can also be difficult to break down in the presence of fats and proteins due to change in binding structure. However, it is possible to break down these two structures to allow starch to be converted to simple sugars, which are a major starting material or feedstock for value products. The
concentration of starch that is available for this conversion depends on the crop and variety of the biomass that is being used. Root and tuber crops (like sweetpotatoes, tapioca,
of amylose present, root and tuber crops also contain longer and more complex amylopectin chains that can make it more difficult to hydrolyze (Hoover, 2001).
1.4.2 Starch Conversion
Starch can be broken down to simple sugars by thermal treatment, chemical treatment, or enzymatic treatment (Tharanathan, 2005; Ellis et al., 1998). Industrial production of starch hydrolysis products such as glucose and fructose syrup is typically based on acid or
enzymatic hydrolysis of gelatinized starch. Gelatinized starch, compared to raw starch, is starch that has been heated in the presence of water to break down the intermolecular bonds present in order to expose the hydrogen bonding sites to engage more water (Collado et al., 1999). This high heat and water combination decreases the amount and size of crystalline regions that are present, making the release of sugars more efficient.
1.4.2.1 Acid Hydrolysis and High Pressure Extrusion
Acid hydrolysis of starch uses mild treatment with mineral acid, usually hydrochloric acid (HCl) at low concentrations, to facilitate the hydrolysis of starch to sugars and has long been an accepted method for rendering starch more amenable to processing (Stephen et al., 2006; Hui, 2006; Robyt et al., 1996). This is one of the earliest methods of starch
modification, and the derived degradation products have a great application potential
of acids in combination with alcohols has been suggested for starch hydrolysis (Hui, 2006). These alcohols are possibly involved in disrupting the hydrophobic and hydrogen bonds of the starch helical structure in the granule (Hui, 2006). Increase in temperature further increases the susceptibility of starch to acid hydrolysis in alcohol (Robyt et al., 1996). It has been reported that acid hydrolysis can result in sugar production of 0.6-0.8 g dextrose equivalent/g dry swp; however, there is difficulties with the generation and removal of high amounts of impurities (e.g. residual acid) introduced by uncontrollable parameters of the method (Azhar and Hamdy, 1981; Tharanathan, 2005). Acid hydrolysis also requires corrosion-proof equipment and yields undesirable by-products like hydroxymethylfurfural (HMF), a dehydration product of D-glucose that can inhibit yeast during alcoholic
fermentation (Kerr, 1950; BeMiller, 1965; Humphrey, 1979; Azhar and Hamdy, 1981; Kim and Hamdy, 1985). High temperature and pressure extrusion of starch involves
gelatinization by pressure treatment at warm conditions under 100°C (usually around 45-50°C), which swells the granules while still maintaining granular structure (Ezaki and Hayashi, 1992). Sugar concentrations of 1.15 to 52.1 dextrose equivalents have been reported; however, it has been observed that high pressure alone does not depolymerize the starch solution to the desired level of fermentable sugars and as starch undergoes
1.4.2.2 Enzymatic Hydrolysis
Enzymatic hydrolysis offers an environmentally friendly and simplified process to break down starch into simple monosaccharide sugars. Several different enzymes can be used in order for this conversion to occur. Amylases catalyze a hydrolytic cleavage of glycosidic bonds of different areas of the amylose and amylopectin molecules in starch (Heldt and Heldt, 2005). The enzyme named α-amylase hydrolyzes starch in the interior of the glucan chain producing cleavage products in which the OH-group in the 1-position is in
α-configuration (Heldt and Heldt, 2005). The enzyme β-amylase is an important amylase that splits off two glucose residues from amylose and amylopectin in the form of the disaccharide maltose (Heldt and Heldt, 2005). Amyloglucosidase, also called glucoamylase, produces free glucose by cleaving both α-1, 4 and α-1, 6 glycosidic bonds on longer chains of amylose and amylopectin. It hydrolyzes α-1, 4 links, releasing glucose molecules from the non-reducing end of the chain, as well as α-1,6 branch links, which are hydrolyzed but less rapidly (Roy and Gupta, 2004).
similar pH and temperature ranges (Roy and Gupta, 2004) and may be helpful in starch hydrolysis due to the high content of amylopectin present.
Representative equations for the two processes are:
Liquefaction
Starch+H2O Dextrins+Maltotriose+C12H12O11 (Maltose) + C6H12O6 (Glucose) (1)
Saccharification
Dextrins + Maltotriose + C12H12O11(Maltose) C6H12O6 (Glucose) (2)
1.5 Ethanol Production by Fermentation
Sugar sources or simple, monosaccharide sugars that have been produced from starch conversion can be fermented using yeast or bacteria to produce alcohols. Saccharomyces
cerevisiae is used extensively in batch and continuous fermentations to convert sugars to
ethanol for the production of beverages and biofuels (Dombek et al., 1987). Saccharomyces
cerevisiae is most commonly used because of its capability of rapid rates of glycolysis and
ethanol production under optimal conditions, producing over 50 mmol of ethanol per h per g of cell protein, and its tolerance to high ethanol, 7 to 13% w/v, and low pH conditions (Dombek et al., 1986; Day et al., 1975).
A representative equation for the fermentation process is:
Fermentation
C6H12O6 2C2H5OH (Ethanol) + 2CO2 (3)
Enzymatic hydrolysis and fermentation can either be performed sequentially, referred to as separate hydrolysis and fermentation (SHF), or simultaneously. There are many
avoided, the risk of contamination is reduced, and capital investments are lower as the total reactor volume is decreased due to higher productivity (Pastor et al., 2003). However, a disadvantage of SSF is the fact that optimum temperatures for the yeast (35°C) and enzymes (40-85°C) are different. This creates a challenge in defining operating temperatures suitable for effective hydrolysis and fermentation.
1.6 Sugar and Starch Crops
There are many supply sources of biomass for energy purposes, scattered across large and diverse geographical areas. Even today, most energy derived from biomass used as fuel originates from by-products or co-products of food, fodder and fiber production.
1.6.1 Sugar crops
The major sugar crops used for biofuel production are sugar cane, sugar beet, and sweet sorghum (FAO, 2008). The advantage of these types of feedstocks is that no pre-treatment or hydrolysis step is needed. Since the crop is already comprised of sugars, fermentation can be carried out immediately. In sugar producing countries, sugars can be used for production of molasses and bagasse for direct combustion, heat energy, and steam.
juice that can be filtered and directly fermented by yeasts (Rains et al., 1990). The resulting ethanol can be separated through subsequent centrifugation and distillation processes.
1.6.2 Starch Crops
Starch can be sub-divided into cereal, legumes, palm and tuber or root starches with the most important sources for starch being potatoes, maize, wheat and tapioca (Shariffa et al., 2009; Ellis et al., 1998). The properties of the starches from these species differ considerably, not only in the relative proportions of amylose and amylopectin and the characteristics of these molecules, but also in the amount of non-starch components of starch granules, such as lipids, proteins and phosphate groups (Ellis et al., 1998). Starch from corn grain provides the primary feedstock for today’s existing and emerging sugar-based bioproducts, such as
polylactide, as well as the entire fuel ethanol industry, which is concentrated in the Midwest region of the United States (Pastor et al., 2003). Action needs to be taken to make use of additional crops and land in other parts of the country.
to the common orange-fleshed table-stock sweetpotato in the US, high starch industrial sweetpotatoes (ISPs) have significant utility as a dedicated feedstock for the production of a number of bio-based products. This is because ISPs have been bred for higher dry matter content to generate up to 50% higher yields in starch. This is a major advantage because ISPs have the ability of being a high starch producing crop with 30–50% greater starch yield than rice, corn, and wheat starch sources measured under the same conditions (Wang, 1984). The high percent of fermentable biomass in the sweetpotato roots further emphasizes its potential as an energy crop for ethanol production and an attractive alternative to corn in the southeastern United States (Wilson et al., 2007). They have been estimated to yield 700-1000 gallons of ethanol/acre compared to 250-300 gal/acre for corn (Ziska et al., 2008; Hall and Smittle, 1983; Mays et al., 1990).
1.7 Anthocyanins in Purple-fleshed ISPs
anthocyanins also makes them an attractive source as a natural food colorant for the food and textile industry as an alternative to synthetic food dyes (Wegener, 2009).
Anthocyanins found in plants function to support plant stability and growth. They have important roles in nature such as antioxidant, photoprotection, defense mechanisms, as well as other ecological functions. Anthocyanins aid as antioxidants in young plants where metabolism is very active and free radical formation is favored (Delgado-Vargas and Paredes-Lopez, 2003). It has also been suggested that anthocyanins present in plant leaves reduce photoinhibition by increasing the amount of available light for photosynthesis because they absorb in the same region as chlorophyll b of 520 to 530 nm (Delgado-Vargas and Paredes-Lopez, 2003). Other characteristics include the ability to protect against UV-light and are aid in plant pollination and reproduction by producing colors with specific light-absorbing characteristics that attract insects and animals (Wrolstad, 2000).
Anthocyanins consist of anthocyanidins, sugars, and acylating acids (Giusti and
Wrolstad, 2003). The presence of a sugar molecule to the anthocyanidin molecular helps the anthocyanin maintain solubility in water. If the sugar is hydrolyzed or lost, the solubility decreases and the molecule will be destabilized. The acylated anthocyanins with aromatic acids are more stable than nonacylated types in aqueous solution (Giusti and Wrolstad, 2003). Anthocyanins exist in an aqueous phase in a mixture of four molecular species, the concentrations of which depend on the pH value (Mazza and Brouillard, 1987).
vacuum and purification by ion-exchange chromatography (Reineccius,1998). Parameters that affect the stability and concentration of anthocyanins achieved from extraction are the solid-liquid ratio (solid loading), incubation temperature and time, and solvent type and concentration (Oki et al., 2002; Pascual-Teresa et al., 2002; Lapornik et al., 2005; Jing and Giusti, 2007; Fan et al., 2008; Steed and Truong, 2008). Anthocyanin yields reported for purple-fleshed sweetpotatoes ranged from 15 to 174 mg/g fw using processes that range from basic extraction with water all the way to accelerated solvent extraction (Brown et al., 2005; Steed and Truong, 2008). Anthocyanin studies have been limited to the use of one type of solvent, solid loading, and incubation temperature. Additional work looking at a
combination of treatment affects is warranted.
1.8 Scale up of Biomass Conversion and Ethanol Production
Industrial fermentations, process optimization and scale up are aimed at maintaining optimum and homogenous reaction conditions in order to increase product yields, ensure consistent product quality, minimize microbial stress exposure, and enhance metabolic accuracy (Schmidt, 2005). For each individual product, process and facility, suitable
strategies have to be evaluated using a comprehensive and detailed process characterization procedure. Identification of the most relevant process parameters influencing product yield and quality should be fully established as scale increases (Schmidt, 2005). After processing parameters have been established for small scale systems, translation of the process design to a larger scale requires additional evaluation and testing. A large majority of biomass
0.5L in working volume. Processes developed to investigate beyond the lab bench will be critical to ethanol production from renewable biomass resources.
1.9 Objectives
This research project was designed to evaluate the potential use of farm-produced biomass to aid in the rising need for biofuels and other biobased, value added products. It involved the investigation of the conversion parameters for sugar-based sweet sorghum and starch-based industrial purple-fleshed sweetpotato crops and their subsequent scale up. Currently, the research available for sweet sorghum juice fermentation parameters is incomplete. Evaluation of yeast strains for maximum ethanol production, the need for additional nutrients for yeast growth and maintenance, and juice manipulation to lower the risk of contamination through sterilization or acidification could potentially maximize the conversion process to ethanol. Therefore, the goals for the sweet sorghum studies were to investigate 1) the effects of sterilization and yeast strains on ethanol production using fresh sweet sorghum juice; 2) the effects of yeast strain and pH on nonsterile fresh sweet sorghum juice; and 3) the effect of freezing sweet sorghum juice stocks for ethanol production and sugar consumption. Efficient use of this feedstock for ethanol production requires evidence of long term storage capability.
For the purple-fleshed sweetpotato project, the effectiveness of different enzyme treatments on glucose and ethanol production as well as procedures for anthocyanin
so this investigation will provide a better understanding of the conversion process and the parameters for high conversion efficiency. The specific goals of the industrial purple-fleshed sweetpotato feedstock project were to examine: 1) the effects of different enzyme loadings on sugar production during liquefaction with α-amylase and saccharification with
glucoamylase; 2) the effects of starch conversion and fermentation on residual anthocyanin concentration; and 3) the effect of initial anthocyanin extraction on sugar and ethanol production.
Research on industrial scale applications with starch and sugar feedstocks for these two particular crops is incomplete. The focus of this work was to create a demonstration scale system for processing sweet sorghum and ISPs so that scale up processing conditions and related challenges could be studied. In this body of research, laboratory-scale hydrolysis and fermentation conditions were scaled up to a pilot plant size design that incorporates the physical and environmental challenges discussed above. The specific objectives were to: 1) design a demo-scale hydrolysis and fermentation system for direct conversion of industrial sweetpotatoes and sweet sorghum juice; 2) measure the physical properties of biomass
materials for use in vessel design and material handling considerations; and 3) identify sensor selections and design a potential control scheme for maintenance of select environmental conditions and material flow through the system
enhanced energy and environmental sustainability through the production and use of renewable functional sugars.
1.10 References
Azhar, A., Hamdy, M.K., 1981. Alcohol fermentation of sweet potato. I. Acid hydrolysis and factors involved. Biotecnol Bioeng. 23, 879.
BeMiller, J.N., 1965. Acid hydrolysis and other lytic reactions of starch. Ch. 20. In ―Starch: Chemistry and Technology.‖ R.L. Whistler and E.F. Paschall (Ed.), Vol. 1, p. 495. Academic Press, New York.
BeMiller, J.N., Whistler, R.L., 2009 Starch: chemistry and technology. 3rd edition. 879 pages. Amsterdam; Boston Academic.
Bridle, P., Timberlake, C.F., 1996. Anthocyanins as natural food colors-selected aspects.
Food Chem. 58,103-109.
Brown, C.R., Culley, D., Yang, C.P., Durst, R., Wrolstad, R., 2005. Variation of anthocyanin and carotenoid contents and associated antioxidant values in potato breeding lines.
Journal of the American Society for Horticultural Science. 130, 174-180.
Collado, L.S., Mabesa, R.C., Corke, H., 1999. Genetic variation in the physical properties of sweet potato starch. J Agric Food Chem. 47, 4195-4201.
Crabb, W. S., Shetty, J.K., 1999. Commodity scale production of sugars from starches.
Curr Opin Microbiol. 2(3), 252-256.
Day, A., Anderson, E., Martin, P.A., 1975. Ethanol tolerance of brewing yeasts. Amsterdam: Elsevier Scientific Publishing Company.
Delgado-Vargas, F., Paredes-Lopez, O., 2003. Natural Colorants for Food and Nutraceutical Uses. CRC Press. Boca Raton, FL. p. 326.
Dombek, K.M., Ingram, L.O., 1986. Nutrient limitation as a basis for the apparent toxicity of low levels of ethanol during fermentation. J Ind Microbiol.
1, 219-225.
Dombek, K.M., Ingram, L.O., 1987. Ethanol Production during Batch Fermentation with Saccharomyces cerevisiae: Changes in Glycolytic Enzymes and Internal pH. Appl
Ellis, R.P., Cochrane, M.P., Dale, M.F.B., Duffus, C.M., Lynn, A., Morrison, I.M., Prentice, R.D.M., Swanston, J.S., Tiller, S.A., 1998. Starch Production and Industrial Use. J Sci
Food Agric. 77, 289-311.
Energy Efficiency and Renewable Energy (EERE). 2008. United States Department of Energy. Biomass Research and Development Board: National Biofuels Action Plan. Retrieved Nov. 12, 2008 from http://www1.eere.energy.gov/biomass/pdfs/nbap.pdf. Energy Information Administration (EIA-a). 2008. United States Department of Energy.
Renewable Energy Annual 2006 Edition. Retrieved Nov. 12, 2008 from
<http://www.eia.doe.gov/cneaf/solar.renewables/page/trends/rentrends.html>. Energy Information Administration (EIA-b). 2009. United States Department of Energy.
International Petroleum (Oil) Reserves and Resources Tables and Reports: World
Proved Reserves of Oil and Natural Gas, Most Recent Estimates. Retrieved May 29, 2009 from <http://www.eia.doe.gov/emeu/international/reserves.html>.
Energy Information Administration (EIA-c). 2009. United States Department of Energy. Monthly Energy Review November 12. Retrieved Nov. 12, 2009 from
<http://www.eia.doe.gov/emeu/mer/pdf/pages/sec1_3.pdf>.
Ezaki, S., Hayashi, R., 1992. High-pressure effects on starch: structural change and
retrogradation. In: Balny, C., R. Hayashi, K. Heremans, P. Massons (Ed.). High pressure and biotechnology. France: John Libbey Eurotext. p. 163-165.
Fan, G., Han, Y., Gu, Z., Chen, D., 2008. Optimizing conditions for anthocyanins extraction from purple sweet potato using response surface methodology (RSM). LWT- Food Sci
Technol. 41, 155-160.
Food and Agriculture Organization of the United Nations (FAO). 2008. The State of Food and Agriculture: Biofuels and agriculture –a technical overview. Electronic Publishing Policy and Support Branch Communication Division. Rome, Italy.
Francis, F., 1989. Food colourants: Anthocyanins. Crit Rev Food Sci. 28: 273-314. Giusti, M.M., Wrolstad, R.E., 2003. Acylated anthocyanins from edible sources and their
applications in food systems: A review. Biochem. Eng. J. 14, 217-225.
Greene, N., 2004. Growing Energy: How Biofuels Can Help End America’s Oil Dependence.
National Resources Defense Council. Retrieved Nov. 10, 2009 from
<http://www.bio.org/ind/GrowingEnergy.pdf>.
Hall, M.R., Smittle, D.A., 1983. Industrial-Type Sweet Potatoes: A Renewable Energy Sources for Georgia. The University of Georgia College of Agriculture Experimental Stations. p. 10.
Hayashi, R., 1992. High-pressure food processing of rice and starch foods. In: Rice is life:
scientific perspectives for the 21st century. Toriyama, K., Heong, K.L., Hardy, B., (Ed.).
Proceedings of the World Rice Research Conference held in Tokyo and Tsukuba Japan. 4-7 November 2004.
Heldt, H., Heldt, F., 2005. Plant Biochemistry. St. Louis, MO: Academic Press.
Hoover, R., 2001. Composition, molecular structure, and physicochemical properties of tuber and root starches: a review. Carbohyd Polym. 45, 253-267.
Hui, Y.H., 2006. Handbook of Food Science, Technology, and Engineering. Boca Raton, FL: CRC Press.
Humphrey, A.E., 1979. The hydrolysis of cellulosic materials to useful products. Adv Chem Ser. 181(25).
International Energy Outlook (IEO)., 2009. World Energy Demand and Economic Outlook. Retrieved Nov. 10, 2009 from <http://www.eia.doe.gov/oiaf/ieo/world.html>.
Jing, P., Giusit, M., 2007. Effects of Extraction Conditions on Improving the Yield and Quality of an Anthocyanin-Rich Purple Corn (Zea mays L.) Color Extract. J Food Sci. 72(7), C363-C368.
Kerr, R.W., 1950. Acid hydrolysis of starch. Chapter 14. In ―Chemistry and Industry of Starch.‖ R.W. Kerr (Ed.), p. 264. Academic Press, New York.
Kim, K., Hamdy, M.K., 1985. Acid-Hydrolysis of sweet-potato for ethanol-production.
Biotecnol Bioeng. 27(3), 316-320.
Kim, K., Hamdy, M.K., 1987. Depolymerization of starch by high pressure extrusion. J Food Sci. 52, 1387-1390.
Mays, D.A., Buchanan, W., Bradford, B.N., Giordano, P.M., 1990. Fuel production potential of several agricultural crops, in Advances in New Crops. J. Janick and J.E. Simon, Editors. Timber Press: Portland, OR. p. 260-263.
Mazza, G., Brouillard, R., 1987. Recent developments in the stabilization of anthocyanins in food products. Food Chem. 25, 207–225.
Moorthy, S.N., 2001. Tuber Crop Starches, Thiruvananthapuram, Kerala: Central Tuber Crops Research Institute. India.
Oates, C.G., 1997. Towards an understanding of starch granule structure and hydrolysis.
Trends Food Sci Tech. 8, 375-382.
Oki, T., Masuda, M., Furuta, S., Nishiba, Y., Terahara, N., Suda, I., 2002. Involvement of Anthocyanins and other Phenolic Compounds in Radical-Scavenging Activity of Purple Fleshed Sweet Potato Cultivars. J Food Sci. 67(5), 1752-1756.
Pascual-Teresa, S., Santos-Buelga, C., Rivas-Gonzalo, J.C., 2002. LC-MS analysis of anthocyanins from purple corn cob. J Sci Food Agr. 82, 1003-1006.
Pastor, M., Pellegrino, J.L., Carole, T.M., 2003. Industrial Bioproducts: Today and
Tomorrow. Energetics, Incorporated for the US Department of Energy, Office of Energy
Efficiency & Renewable Energy, Office of Biomass Program. Retrieved Nov. 10, 2008
from <http://www.brdisolutions.com/pdfs/BioProductsOpportunitiesReportFinal.pdF>. Peroni, F.H.G., Rocha, T.S., Franco, C.M.L., 2006. Some structural and physicochemical
characteristics of tuber and root starches. Food Sci Technol Int.12(6), 505-513. Rains, G.C., Cundiff, J.S., Vaughan, D.H., 1990. Development of a whole-stalk sweet
sorghum harvester, Trans ASAE. 33(1), 56-62.
Reilly, P.J., 1999. Protein Engineering of Glucoamylase to Improve Industrial Performance – A Review. Starch. 51 (8-9), 269-274.
Reineccius, G., 1998. Source Book of Flavors. Aspen Publishers Inc. Gaithersburg, MA. 928 pages.
Roy, I., Gupta, M.N., 2004. Hydrolysis of starch by a mixture of glucoamylase and pullulanase entrapped individually in calcium alginate beads. Enzyme Microb Tech. Sayigh, A., 1999. Renewable energy-the way forward. Appl Energ. 64, 15-30.
Schmidt, F.R., 2005. Optimization and scale up of industrial fermentation processes. Appl
Microbiol Biot. 68, 425–435.
Shariffa, Y.N., Karim, A.A, Fazilah, A., Zaidul, I.S.M., 2009. Enzymatic hydrolysis of granular native and mildly heat-treated tapioca and sweet potato starches at sub-gelatinization temperature. Food Hydrocolloid. 23, 434-440.
Smith, G.A., Bagby, M.O., Lewellan, R.T., Doney, D.L., Moore, P.H., Hills, F.J., Campbell, L.G., Hogaboam, G.J., Coe, G.E., Freeman, K., 1987. Evaluation of Sweet Sorghum for Fermentable Sugar Production Potential, Crop Sci. 27, 788-793.
Steed, L.E., Truong, V.D., 2008. Anthocyanin Content, Antioxidant Activity, and Selected Physical Properties of Flowable Purple-Fleshed Sweetpotato Purees. J Food Sci. 73(5), S215-S221.
Stephen, A. M., Phillips, G.O., Williams, P.A., 2006. Food Polysaccharides and Their
Applications. Boca Raton, FL: CRC Press.
Steynberg, A., 2004. Fischer-tropsch Technology. Edited by: A. Steynberg and M.Dry. Elsevier B. V. Amsterdam.
Tharanathan, R.N., 2005. Starch-Value Addition by Modification. Crit Rev Food Sci. 45, 371-384.
Timberlake, C.F., Henry, B.S., 1988. Anthocyanins as natural food colorants. Prog Clin Biol Res. 280, 107-121.
United States Department of Agriculture National Agricultural Statistics Service (USDA NASS)., 2008. Retrieved on Dec. 1, 2009 from <http://www.nass.usda.gov/QuickStats/ index2.jsp>.
Wang, J., 1984. The development and utilization of starch resources from sweet potato.
Chin Hunan Agric Sci. 5, 44–46.
Wegener, C.B., Jansen, G., Jürgensa, G.H., Schützeb. W., 2009. Special quality traits of coloured potato breeding clones: Anthocyanins, soluble phenols and antioxidant capacity.
Wilson, P.W., D.R. Labonte, G.B. McCure. 2007. Enzymatic conversion and fermentation of sweetpotato. HortScience. 42(3), 459.
Wrolstad, R.E. 2000. Anthocyanins. In: Lauro, G.J., Francis, F.J., (Ed.). Natural food
colorants science and technology. New York: Marcel Dekker Inc., p. 237-252.
CHAPTER 2
Influence of Juice Preparations on the Fermentability of Sweet Sorghum
2.1 Abstract
Agricultural biomass has shown potential to aid in the rising need for biofuels and other biobased products. This study focused on sweet sorghum, a crop which produces relatively high quantities of easy to process, directly fermentable aqueous sugar. Sweet sorghum is desirable because of its reduced steps and inputs required for complete conversion to ethanol, adaptability to temperate regions, drought tolerance, and photosynthetic efficiency.
Laboratory fermentation studies were conducted in order to evaluate processing parameters for ethanol production on fresh and frozen sorghum juice. The effects of pH level, yeast type, incubation time and sterilization were investigated. Ethanol and individual sugar
2.2 Introduction
Sweet sorghum [Sorghum bicolor (L.) Moench] is a sugar crop, similar to sugar cane and sugar beets in that its stalk storage organ contains high sugar content (Smith et al., 1987). It has been grown in the southeastern portion of the United States for more than a century in small plantings for the making of sweet syrup (also known as molasses). The free sugars in the juice of the crop may also show promise as a source of sugar for ethanol fermentation. The pith or stalks can be mechanically pressed to release a juice with a sugar concentration of 15-22° Brix that can be filtered and directly fermented by yeasts (Rains et al., 1990). The resulting ethanol can be separated through subsequent centrifugation and distillation
processes. Besides having high sugar accumulation and biomass production potential, sweet sorghum is a multi-purpose crop where the pith residue, leaves, and bagasse can be ensiled and fed to cattle or used as a feedstock for ethanol when cellulosic conversion becomes economical (Worley et al., 1992).
Corn has been the major focus for ethanol production in North America, but will not meet the rising energy demands of the United States and cannot be sustainably grown in all
regions of the US. Sweet sorghum’s characteristics make this feedstock a potential renewable alternative for diversified biofuel production. These properties include
1987). There have also been claims that this crop is tolerant to fungal diseases, viruses, herbicides, high and low pH, heat, insects, poor quality and water logged soils, and weeds (Martini et al, 2006).
For sweet sorghum to be considered as a renewable energy feedstock, challenges
associated with seasonal production need to be investigated. Challenges include harvesting, stem juice extraction, and preservation of extracted stem juice. Juice processing for
fermentation applications can include stripping the leaves from the stalks by hand then squeezing the fresh juice out by a press or three roller mill, while others may use lab scale blenders to extract the juice (Bulawayo et al., 1996; Liu and Shen, 2008). Sorghum juice composition studies have shown that depending on the variety, sweet sorghum juice contains on average 53-60% saccharose (sucrose), 24-33% glucose, and 7-21% fructose of total sugars present (Mohite and Sivaraman, 1984; Phowchinda, 1997). Since the extracted stem juice contains such a large amount of sugar there is an increased potential for bacterial
contamination, sugar degradation and ―souring‖ or spoilage of the juice (Bennett and Anex, 2008). With such large volumes of juice, storage and handling are important issues when moving from the farm to the processing plant and then to individual unit operation vessels before fermentation begins (Bennett and Anex, 2008). Several solutions have been suggested for these problems including sterilization and lowering the pH with sulfuric acid to combat bacterial contamination, the addition of costly chemicals for juice stabilization, and
concentrating the juice into syrup to aid in the reduction of size for storage containers
Research on sweet sorghum juice fermentation parameters is limited. Evaluation of yeast strains, the need for additional nutrients for yeast growth and maintenance, and juice
manipulation to lower the risk of contamination through sterilization or acidification are needed to establish a baseline for the conversion process to ethanol. The goal of this work was to investigate the effects of sterilization, yeast strains, pH, and juice storage techniques on sweet sorghum juice fermentation. Specific objectives were to examine 1) the effects of sterilization and yeast strains on ethanol production using fresh sweet sorghum juice; 2) the effects of yeast strain and pH on nonsterile fresh sweet sorghum juice; and 3) the difference between fresh and frozen sweet sorghum juice stocks on ethanol production and sugar consumption.
2.3 Material and Methods
2.3.1 Juice preparation
2.3.2 Experimental Design and Statistical Analysis
Experiments were completed on fresh and frozen sweet sorghum juice preparations. The effects of yeast culture type (Ethanol Red, Dry Alcohol), sterilization (sterile, non-sterile), and incubation time for the fermentation of fresh sweet sorghum juice was analyzed. To assess its effect in stabilizing juice fermentability, pH (4.5, 5.0) in combination with yeast culture type (Ethanol Red, Dry Alcohol) and incubation time were studied for the
fermentation of nonsterile fresh sweet sorghum juice. Studies on the fermentation of frozen sweet sorghum juice were completed to examine the effects of sterilization (sterile, non-sterile) and incubation time on ethanol production. Response variables measured were changes from time zero in sucrose, glucose, fructose and ethanol concentrations as well as weight and molar yields of ethanol produced per unit sugar consumed. All treatment
combinations were completed in triplicate and duplicate controls (no yeast) were maintained. Analysis of variance for main and interaction effects and t-test comparisons were evaluated using PROC GLM in SAS 9.1 software (SAS® Inc., Cary, NC).
2.3.3 Fermentation
were on average 4.3 ×10⁶ cells/ml once rehydrated. Each yeast type was added in triplicate and duplicate controls were maintained (no yeast addition).
Fresh juice, nonsterile treatments were prepared at two different pH levels. Prior to distributing the juice, the pH was measured in 1.2 L fractions and either adjusted to a pH of 4.5 with 12N H2SO4 or left at its natural pH of 5. Under a biological safety cabinet (Kendro KS 18, Germany), fresh juice (125 ml, sterile graduated cylinder for measure) from each pH preparation was placed into 250 ml Erlenmeyer flasks (8 flasks for each pH level). Ethanol Red and Dry Alcohol Yeast were added aseptically to flasks at a dry weight concentration of 0.01% w/v. Yeast type and pH treatment combinations were completed in triplicate and duplicate controls were maintained (no yeast addition).
Frozen juice treatments were prepared by thawing juice (4˚C) for 3-4 days. The juice (125 ml, sterile graduated cylinder for measure) was then transferred into 250 ml Erlenmeyer flasks (10 total flasks). Sterile treatment flasks (5) were autoclaved for 30 minutes (121C, 15 psig) and cooled prior to yeast addition. Ethanol Red yeast was added aseptically to sterile and non-sterile flasks (triplicate) at a dry weight concentration of 0.01% w/v.
composition analysis. Between sampling and exhaust events, the flasks were sealed by clamping off inlet and exhaust tubing lines.
2.3.4 Analysis Methods
2.3.4.1 Micronutrient Analysis
All analyses were conducted to estimate initial conditions for non-sterile and sterile juice samples. Total Kjeldahl nitrogen (TKN, which includes organic nitrogen, ammonia (NH3) and ammonium (NH4+)), was measured by acid digestion and ammonia salicylate method for automated analysis according to Standard Methods 4500Norg B (Clesceri et al., 1998). Total ammonia nitrogen (TAN, which includes NH3 and NH4+) was measured by
ammonia-salicylate method for automated analysis, where emerald green color was formed by reaction of ammonia, sodium salicylate, sodium nitroprusside, and sodium hypocholite in a buffered alkaline medium according to Standard Methods 4500-NH3 G (Clesceri et al., 1998). Nitrates and nitrites (NO3-N + NO2-N) were measured by cadmium reduction method for automated analysis according to Standards Methods 4500-NO3-E (Clesceri et al., 1998). Total phosphorus (TP) was measured by acid digestion and ascorbic acid method for automated analysis according to Standard Methods 4500-P F (Clesceri et al., 1998).
2.3.4.2 Sugars and Ethanol Determination
Initial and final pH of experimental units were measured for each study. Sugar content estimates were determined by measuring Brix on a refractometer (Alla 950.032 B ATC, France). Quantification of glucose, sucrose, and fructose sugars as well as ethanol concentrations was completed by high performance liquid chromatography (HPLC, Shimadzu HPX-87P column, 85°C, HPLC water eluent, 0.6 ml/min flow rate, Refractive Index Dectector). HPLC samples were diluted, centrifuged (14908xg, 5 min) and filtered through 0.45 μm Milipore filters before analysis. The presence of acetate was analyzed by gas chromatography (Shimadzu GC 17A, Kyoto, Japan, Flame Ionization Detector). GC samples were prepared by combining samples (500µL) with 25% meta-phosphoric acid (125µL), centrifuged (10 min, 14,000xg, 25°C), and the clarified supernatant was transferred to crimp top vials. The chromatography column was packed with Supelco SP 1000 (1% H3PO4, 100/120 mesh). The carrier gas was nitrogen (36 ml/min) and the inlet and detector temperatures were 185 and 190°C, respectively. The column temperature was programmed to run isothermally at 125°C for 1 min, ramp at a rate of 20°C/min and hold at 160°C for 3.5 min.
Total sugars were calculated using Eq. (1).
Total Sugars, mol = 2 [Sucrose, mol] + [Glucose, mol] + [Fructose, mol] (1)
The average of total sugar values were used in ethanol yield (ml) calculations. Theoretical Ethanol Yield = Total Sugars (mol) × 2 mol Ethanol
1 mol C6 sugar × MW ethanol g/mol ×
1
Conversion efficiency was calculated using Eq. (3).
Conversion Efficiency , % = Actual ethanol yield , mol
Theoretical ethanol yield , mol× 100% (3)
2.4 Results and Discussion
2.4.1 Sorghum Juice Characteristics
According to Abelovska et al. (2007), minimal media that is commonly used for yeast growth contains (per L) 49.7±0.2 mg Mg, 334±1 mg K, 49.1±0.5 mg Na, 32.2±0.5 mg Ca, 253±3 mg P, with trace amounts of Fe, Cu, Mn, and Zn. Total Kjeldahl nitrogen, total ammonia nitrogen, nitrates and nitrites, total phosphorus, ortho-phosphates and potassium were measured for non-sterile and sterile juice samples of fresh juice to get a sense for the key micronutrient components that are naturally part of juice extracts (Table 2.1).
Table 2.1 Composition of total Kjeldahl nitrogen (TKN), total ammonia nitrogen (TAN), nitrates and nitrites, total phosphorus (Total-P), ortho-phosphates (Ortho-P) and potassium (K) in non-sterile and sterile samples of fresh sweet sorghum juice.
Source TKN
(mg/L)
TAN (mg/L)
Nitrates/Nitrites (mg/L)
Total-P (mg/L)
Ortho-P (mg/L)
K (mg/L)
Nonsterile Fresh Juice 142 68.9 13.9 83.2 60.1 2153
Sterile Fresh Juice 129 64.4 13.9 90.9 62.1 2176
TAN from TKN and was determined to be 73.1 and 64.6 mg/L for nonsterile and sterile fresh juice, respectively. Organic nitrogen can be incorporated into the yeast cells where the nitrogen and carbon are used for synthesis of other metabolic constituents (Large, 1986). Bulawayo et al. (1996) supplemented sorghum juice preparations to give concentrations (per L) of 150 g sucrose, 1.6 g urea, 1.2 g (NH4)2HPO4, and lowered the pH to 4.5 before carrying out fermentation. This nutrient supplementation may not be necessary since our studies showed that yeast growth and fermentation of sugars occurred with the nutrients that were already present in the juice. Thus making sweet sorghum more cost-effective as a feedstock because no additional inputs would be needed to initiate and prolong yeast growth and production.