Brian J. Williams,1 Kazimierz J. Borkowski,1 Stephen P. Reynolds,1 John C. Raymond,2
Knox S. Long,3 Jon Morse,4 William P. Blair,5 Parviz Ghavamian,5 Ravi Sankrit,6 Sean P.
Hendrick,7 R. Chris Smith,8 Sean Points,8 & P. Frank Winkler9
ABSTRACT
We present near and mid-infrared observations of the pulsar-wind nebula (PWN) B0540-69.3 and its associated supernova remnant made with the Spitzer Space Telescope. We report detections of the PWN with all four IRAC bands, the 24µm band of MIPS, and the Infrared Spectrograph (IRS). We find no evidence of IR emission from the X-ray/radio shell surrounding the PWN resulting from the forward shock of the supernova blast wave. The flux of the PWN itself is dominated by synchrotron emission at shorter (IRAC) wavelengths, with a warm dust component longward of 20 µm. We show that this dust continuum can be explained by a small amount (∼ 1−3×10⁻³
M) of dust at a temperature of
∼ 50−65 K, heated by the shock wave generated by the PWN being driven into the inner edge of the ejecta. This is evidently dust synthesized in the super-nova. We also report the detection of several lines in the spectrum of the PWN, and present kinematic information about the PWN as determined from these lines. Kinematics are consistent with previous optical studies of this object. Line strengths are also broadly consistent with what one expects from optical line
1Physics Dept., North Carolina State University., Raleigh, NC 27695-8202; bjwilli2@ncsu.edu
2Harvard-Smithsonian Center for Astrophysics, 60 Garden Street, Cambridge, MA 02138;
3
STScI, 3700 San Martin Dr., Baltimore, MD 21218;
4
NASA Goddard Space Flight Center, Code 665, Greenbelt, MD, 20771
5
Dept. of Physics and Astronomy, Johns Hopkins University, 3400 N. Charles St., Baltimore, MD 21218-2686;
6
Space Sciences Laboratory, University of California, Berkeley, CA, 94720-7450;
7
Physics Dept., Millersville University, PO Box 1002, Millersville, PA 17551;
8
CTIO, Cailla 603, La Serena, Chile;
9
strengths. We find that lines arise from slow (∼ 20 km s−1) shocks driven into
oxygen-rich clumps in the shell swept-up by an iron-nickel bubble, which have a density contrast of ∼ 100−200 relative to the bulk of the ejecta, and that faster shocks (∼250 km s−1
) in the hydrogen envelope are required to heat dust grains to observed temperatures. We infer from estimates of heavy-element ejecta abundances that the progenitor star was likely in the range of 20-25 M.
Subject headings: interstellar medium: dust — Magellanic Clouds — pulsars: individual (0540-69.3) — supernova remnants
1. Introduction
Many core-collapse supernovae (SNe) leave behind a neutron star as a compact rem-nant. Some of these neutron stars are active pulsars which inflate a bubble of relativistic particles and magnetic fields confined by the ejecta or interstellar medium (ISM), known as a pulsar-wind nebula. The combination of a shell supernova remnant (SNR) and associated pulsar-wind nebula can allow the investigation of various issues of importance in supernova and pulsar physics, including pulsar kicks, ejecta structure and composition, and particle acceleration at relativistic shocks. Pulsar-wind nebulae serve as calorimeters for pulsar spin-down energy loss, and as test systems to study the behavior of relativistic shocks where the pulsar wind is thermalized. We know of few cases of a “normal” radio and X-ray shell supernova remnant containing an active pulsar and synchrotron nebula. Probably the best known such ideal case is the Large Magellanic Cloud remnant B0540-69.3 (or “0540” for short). 0540 is also one of a highly exclusive group of “oxygen-rich” SNRs, a group that includes Cas A, Puppis A, G292+1.8, 1E0102-72.3, and N132D.
Theoretical studies of PWNe have either concentrated on the gross evolution, assuming a homogeneous nebula (Rees & Gunn 1974; Pacini & Salvati 1973; Reynolds & Chevalier 1984) or the detailed spatial structure, neglecting evolution (Kennel & Coroniti 1984). Since the advent of the new generation of X-ray observatories, the study of PWNe has acceler-ated, with the identification of many new objects and more detailed information on known ones (see Gaensler & Slane 2006 for a recent review). Chevalier (2005) modeled PWNe for different assumptions about the ejecta profiles into which they expand, to relate properties of supernovae to those of the PWNe.
is an exception), and almost nothing is known about infrared or ultraviolet spectra. Typi-cal radio spectra are featureless, and are well described by power-laws with spectral indices
α < 0.3 (Sν ∝ ν−α), with X-ray indices steeper by 0.5 – 1.3 (see data in Chevalier 2005).
Since simple models of synchrotron losses predict a steepening of exactly 0.5, they lack some essential physics, which may be constrained if the complete spectrum is known. Galactic PWNe are all found close to the Galactic plane, where they suffer from extinction in optical and UV and confusion in IR. Filling in the SED between radio and X-rays can best be done with a high-latitude object. For this reason as for many others, 0540 is an interesting target. 0540 was first catalogued as a radio source of unknown nature, a minor feature on a 408 MHz map of the 30 Dor region made with the Molonglo telescope (Le Marne 1968). Mathewson & Clarke (1973) first classified it as a supernova remnant on the basis of its steep radio spectrum, although their optical survey did not detect it. Early reports associated 0540 with the Hα emission nebula N 158A (Henize 1956), though that object is 30
from the centroid of the early radio positions (which could be localized to better than 1000
). The absence of strong Hα emission from 0540 further demonstrates that the association with N 158A is erroneous. Subsequent radio observations (Milne, Caswell, & Haynes 1980) gave an improved spectral index of−0.44, typical for a shell supernova remnant. The first indication of something unusual was the X-ray detection (Long & Helfand 1979) with the Einstein
Observatory, in which 0540 was the third brightest X-ray remnant in the LMC. The X-ray spectrum was shown to be featureless by Clark et al. (1982) with the Einstein Solid-State
Spectrometer. The first optical detection was reported by Mathewson et al. (1980), motivated by pre-publication reports of the observations of Clark et al (1982). Mathewson et al. did not see Hαbut instead a spectacular ring in [O III] of 800
diameter, with a smaller ring in fainter [N II] emission (400
diameter) and no appreciable Balmer emission. In addition to classifying 0540 as an “oxygen-rich” SNR, Mathewson et al. (1980) also reported spectroscopic observations indicating expansion speeds of order 1500 km s−1
. The discovery of the 50 ms X-ray pulsar (Seward, Harnden, & Helfand 1984) and optical synchrotron nebula (Chanan, Helfand, & Reynolds 1990) added to the complexity and interest of the system. The optical emission was shown definitively to be synchrotron by the discovery of polarization (Chanan & Helfand 1990). The pulsar spindown timescale P/2 ˙P is about 1660 yr (Seward, Harnden, & Helfand 1984), somewhat longer than the kinematic age estimate resulting from dividing the radius (400
= 1 pc at our assumed distance of 50 kpc) by the expansion speed of about 1500 km s−1
, which yields a value of ∼700 yr. The pulsar spindown luminosity is 1.5×1038 erg s−1
and X-ray observations could be explained without requiring extreme values for the pulsar initial energy or other parameters. He deduced an initial pulsar period of about 30±8 ms, that is, relatively slow, and concluded that the true age of 0540 was between 800 and 1100 yr, somewhat longer than the kinematic age due to the pulsar-driven acceleration.
Up to this time, all observations were consistent with 0540 being a standard Crab-like remnant (i.e., a nonthermal center-brightened radio and X-ray nebula surrounding a pulsar), except for the hint of larger-scale structure from radio images and from X-ray observations (Seward, Harnden, & Helfand 1984). Definitive information on the structure came from higher-resolution radio observations with the Australia Telescope (Manchester, Staveley-Smith, & Kesteven 1993) which showed a clear radio shell with diameter about 6500
surrounding a radio nebula with size (about 500
FWHM) comparable to the bright X-ray nebula and [O III] ring. The shell has a radio spectral index α of about −0.4, while the central nebula has α = −0.25. At this point it was clear that 0540 is even more Crab-like than the Crab, as it possesses a clear outer blast wave interacting with surrounding material, so that we could be sure that the interior PWN is interacting with the inner SN ejecta as in Reynolds & Chevalier (1984). X-ray emission from the blast wave was confirmed with
Chandra observations (Hwang et al. 2001); the emission is brightest in the W and SW, like the radio. Spectral fits indicated abundances typical of the LMC, with a temperature of order 4 keV (for a Sedov blast wave model) and ionization timescale τ ≡ net = 3.7×10¹⁰
cm−3
s, though spectral differences are apparent in different regions, and a hard component may be called for.
The most thorough optical spectroscopic study to date was reported by Kirshner et al. (1989). They confirmed the high velocities (FWZI ∼2800 km s−1
), and reported weak Hα
emission. The average centroid of SNR lines (as opposed to narrower lines from a nearby H II region) was shifted by +370 km s−1. No [Ne III] was reported (< 1.5 % of [O III]);
they concluded that this was a real abundance deficit rather than a temperature or density effect. A detailed study by Serafimovich et al. (2004), focusing on the optical nonthermal continuum, revised the reddening and optical slope to give a power-law index in the optical of αo =−1.07. Recent observations by Morse et al. (2006) report the discovery of faint [O
III] emission extending to a radius of 800
, with a velocity of 1650 km s−1
. They find the centroid of this velocity component to be the same as that of the LMC, so that a large peculiar velocity of the system is not required.
of a lack of significant emission from hydrogen. However, recent optical observations by Serafimovich et al. (2004) and Morse et al. (2006) have detected hydrogen. In light of this, it is now believed (Chevalier 2006) that 0540 is the result of a type IIP supernova.
The infrared observations of 0540, which was detected by theInfrared Space Observatory
(ISO) (Gallant & Tuffs 1999), presented in this paper promise to advance our understanding on several fronts. The outline of our paper is as follows: In section 2, we describe the observations and data reduction, and results are given in section 3. In section 4.1, we discuss a general picture of the PWN, and sections 4.2 and 4.3 discuss in detail the line emission and dust continuum emission, respectively. In section 4.4, we discuss the origin of the O-rich clumps, whose existence we posit in section 4.2. Section 5 serves as a summary of our findings.
2. Observations and Data Reduction
During Cycle 1 of Spitzerobservations, we obtained pointed observations of 0540 with the Infrared Array Camera (IRAC) and the Multiband Imaging Photometer for Spitzer (MIPS) as part of a survey of ∼ 40 known supernova remnants in the Large and Small Magellanic Clouds (Borkowski et al. 2006; Williams et al. 2006). Our IRAC observations (28 November 2004) consisted of a dither pattern of 5 pointings with a frame time of 30 seconds for each frame. This pattern was used for all 4 IRAC channels. Our MIPS observa-tions (7 March 2005) differed based on the module used. At 24 µm, we mapped the region with 42 overlapping pointings of 10 seconds each. At 70 µm, we mapped the remnant with 94 pointings of 10 seconds each. At 160 µm, we mapped the region with 252 pointings of 3.15 seconds. Since 0540 was not detected at 160 µm, we do not discuss 160µm data here. Both the Basic Calibrated Data (BCD) and Post-BCD products were processed with version S14.4 of the PBCD pipeline. We then used the Spitzer Science Center (SSC) contributed software package MOPEX to “clean up” the images, although the improvements were min-imal. MOPEX was able to remove some of the streaks caused by bright stars in the IRAC images of the region.
Our images of the source are shown in Figure 1. With a radius of ∼ 400
, the PWN is resolved by Spitzer, and it clearly stands out from the background in IRAC and MIPS 24
µm bands. In IRAC ch. 3 & 4 (5.8 & 8.0 µm), as well as MIPS 24 µm, there is a hint of a shell around the nebula, at approximately 3000
to be virtually identical to the surrounding background unrelated to the remnant, so we are forced to conclude that its apparent relation to the SNR is coincidental.
In Cycle 2, we obtained spectroscopic pointings for 0540 using all four instruments of the Infrared Spectrograph (IRS). Our observations were done between 8-10 July 2005. We used the spectral mapping mode for the low-resolution modules, and staring mode for the high-resolution echelle modules. Figure 2 shows our coverage of the PWN with IRS overlaid on our MIPS 24 µm image. For the short-wavelength, low-resolution module (SL) we obtained 5 parallel pointings with each of the two orders, with a step direction of 3.5” perpendicular to the dispersion direction of the slit. A total of 480 seconds (2 cycles of 240 s) was obtained for each slit position. For the long-wavelength, low-resolution (LL) module, we obtained 3 parallel pointings for each order with a step direction of 10.5” perpendicular to the dispersion direction. A single cycle of 120 seconds was used for LL. Since we are primarily interested in determining the shape of the continuum from the low resolution spectra, it was important to obtain spectra of the local background as well as the source. Figure 1 illustrates the complex nature of the local background and the difficulty of accurate background subtraction. Because our source is only∼800
in diameter, we were able to extract background spectra from not only the parallel slit pointings, but also from different parts of the slit containing the source. We downloaded the Post-BCD data, pipeline version S15, from the SSC. We used the Spitzer IRS Custom Extraction (SPICE) software provided by the SSC to extract our spectra. Although the PWN is slightly extended, it is close enough to a point source, especially at longer wavelengths, to use the point source extraction mode in SPICE.
3. Results
3.1. Flux Extraction
0540-69.3 is located close to the 30 Doradus region of the LMC, and thus is in a region of high infrared background. For our IRAC and MIPS images, we simply used an annular background region to subtract off the background flux from the PWN. Because the nebula is only about 400
in radius, we used an on-source region of ∼600
radius to be sure to capture all of the flux from the object, and a background annulus between 600
and 1000
radius. At 70
µm, we derive an upper limit to the flux that could be contained in the region based purely on error analysis of the pixels. Our results, with a 3σ upper limit at 70 µm, are given in Table 1.
3.2. Spectral Extraction
For each of the SL orders, our procedure was as follows. First, we extracted spectra from three different, non-overlapping positions on each of the 5 slits. The positions corresponded to the middle and the ends of each slit. This gave us a total of 15 different spectra. Given the spatially varying background in the vicinity of the PWN, we elected to use only the background regions that were closest to the source. Thus, we excluded the 4 “corner” regions, leaving us with 11 total regions. We considered the middle 3 regions to be our “on-source” region (since flux from the PWN was extended into all 3) and added them together. We then used the remaining regions as background. As a check of this method, we integrated the background subtracted spectra over the appropriate wavelengths corresponding to the 5.8 and 8.0µm IRAC channels, factoring in the spectral response curves. Within errors, we obtained the same flux here as we did using aperture photometry on the IRAC images. In Figure 3, we show the short-low spectrum of the PWN with the both the original source spectrum and background spectrum overlaid.
For the LL slits, we followed a similar procedure. Because we only had 3 parallel slit positions, we had 9 total spectra extracted from spatially different areas. Because the LL slit is wider than SL (about 10.500
the appropriate spectral response curves, calculated a 24 µm flux that could be compared with that derived from aperture photometry on the MIPS image. Within errors, there was excellent agreement between these two methods. Figure 4 shows the long-low spectrum of the PWN.
In order to examine the shape of the synchrotron continuum from the low-resolution data, it was necessary to remove the lines from the spectra, as well as artifacts produced by obviously bad pixels. Although we detected the PWN at all wavelengths, the spatially varying background made our background subtraction procedure somewhat uncertain. Using different background subtraction regions does produce different results for the final spectrum, mainly due to the steep north-south gradient in the infrared background in the region of 0540 (see Figure 2). We believe our approach of defining an “annulus” region and averaging the backgrounds around the source is the best solution to this problem. However, it is not without significant uncertainties. We tried several variations of different background regions to see what the effects were. The largest differences came in comparing the two same-slit background positions with the two parallel slit background positions. We found variations in the absolute flux level between these two choices to be on the order of 40%. Because we have no reason to favor one over the other, we averaged them together with equal weights, thus creating our annulus. Because of this, we have used caution in interpreting the results of the extraction of the continuum. We also considered the possibility that a large number of weak lines could be interpreted as continuum. We reject this hypothesis for two reasons. First, there are only a handful of IR lines predicted in this wavelength range, and with the exception of [Ar III] at 8.99 µm, none of them even come close to the detection limit based on our line models. Second, we have high-resolution spectra of this region, and there is no evidence of lines that would be unresolved in the low-resolution data.
3.3. Line Fitting
removed artifacts that were clearly caused by bad pixels, as determined by examining the 2-D dispersed image. We also clipped bad pixels from the backgrounds in the vicinity of each line, in order to make the fitting of the actual lines easier with a longer tail for the Gaussian. We did not remove or alter any of the pixels that were contained in the line itself, except in the case of the [Ne II] line at 12.8 µm. There was an obvious bad pixel that was contaminating the line structure at around 12.86 µm. In order to correct for this, we interpolated the strength of that pixel based on the strengths of neighboring wavelength pixels. Line profiles and strengths are discussed in section 4. The complete high-resolution spectrum of the PWN is shown in Figure 5.
We find that nearly all of the lines in the spectrum have a two-component nature, with a narrow component we attribute to the surrounding H II region, and a broad component coming from the PWN. Figure 6 shows an example of a two-component fit to a line, in this case [Ne III], at 15.5 µm. The spectral resolution of both SH and LH is λ/∆λ ∼ 600, which corresponds to a minimum FWHM of 500 km s−1
. Since we do not expect the narrow component widths to be wider than this, we fixed the narrow component widths to this value. Furthermore, the LMC has an overall recession velocity relative to the Sun of +270 km s−1, so all narrow components should be redshifted by this amount. However, when we
fixed the centroid of the Gaussian for the narrow component to this velocity, the fits were unacceptably poor. According to the Spitzer Observer’s Manual, the wavelength calibration in IRS is 1/5 of a resolution element, which for the high-resolution module corresponds to 0.003-0.011µm, or 100 km s−1
. Since we found that all the narrow components seem to be off by a comparable systematic shift, we believe that the uncertainties in wavelength calibration are responsible. Thus, we measured the shift for each narrow component and averaged them to obtain a value to which we would fix each narrow component. We considered SH and LH separately, and calculated that each narrow component was redshifted on average (relative to its rest wavelength) 171 km s−1
for SH and 230.5 km s−1
for LH. Fixing the centroids of the narrow components to these values returned much more acceptable fits.
After we used Peak-O-Mat to determine the best values for the parameters of either one or two Gaussians, we then used our own least-squares algorithm to obtain errors. The errors listed on the parameters in Table 2 are 90% confidence limits, corresponding to a rise inχ2 of
4. Discussion
4.1. General Picture
We aim at a self-consistent, semi-quantitative picture of the PWN that accounts for the presence of lines (optical and IR), the extent of the synchrotron nebula, and the source of the [O III] emission at 800
radius. We find it useful to first point out some contrasts between 0540 and the most widely-known object of its class, the Crab Nebula. Although 0540 has been referred to as “The Crab’s Twin,” the two differ in some important ways. The most obvious difference is the lack of an outer shell in the Crab, while 0540’s 3000
shell has been seen in both radio and X-ray observations. For the purposes of this paper, however, the important differences lie in the PWN. In the Crab, the size of the nebula decreases with increasing frequency, so that the radio nebula is larger than the optical, which is larger than the X-ray, etc. In 0540, the synchrotron nebula is approximately identical in extent throughout all wavelengths, around 500
. The other fundamental difference is the presence in 0540 of emission located beyond the synchrotron nebula (the [O III] halo). There is nothing like this seen in the Crab, where the radio synchrotron emission extends to the outer boundary of anything known to be associated with the nebula.
In modeling the Crab Nebula, Sankrit & Hester (1997) considered two models, one a pure shock model and the other a pure photoionization model to explain the optical emission. They concluded that shocks from an expanding shell were more likely. In the case of 0540, however, a pure shock model cannot reproduce the [O III] extended emission. We therefore propose an extension to their models that incorporates both a global shock
and photoionization. The specifics of our model will be described more fully in the sections below, but our general picture of the nebula is as follows. It is based on the dynamical picture of Chevalier (2005; C05).
Approximately a millenium ago, a star exploded via the core-collapse mechanism, leav-ing behind a pulsar, and sendleav-ing a shock wave out into the interstellar medium. The outer boundary of this forward shock is now about 8 pc (angular distance of about 3000
) from the pulsar, and the reverse shock into the ejecta is somewhere between 1000
−3000
however, to expect the ejecta to be completely homogeneous. The 56Ni synthesized in the
explosion will have heated the central ejecta by radioactive decay, causing them to expand in an “iron-nickel bubble” (Li, McCray, & Sunyaev 1993), and compressing intermediate-mass ejecta into a denser surrounding shell.
We propose that the PWN shock has reached a radius of about 1.2 pc from the pulsar, which corresponds to a size of ∼500
, the size of the nebula as determined by X-ray observa-tions. The layer of shocked ejecta is geometrically thin, bounded on the inside by a contact discontinuity separating it from the the PWN proper, which is the shocked pulsar wind. The shock has already encountered and propagated through the low-density iron-nickel bubble and its surrounding shell. That shell is likely to be highly clumpy (Basko 1994); shocks driven into the clumps of heavy-element ejecta will be slow. Finally, at a sub-arcsecond radius we expect the inward-facing pulsar wind shock where the relativistic pulsar wind is thermalized. Interior to the shock driven into the ejecta, emission in optical/IR is both ther-mal and non-therther-mal, with the dominant component being synchrotron continuum emission from the relativistic electrons. However, multiple emission lines are clearly detected from dense clumps and filaments of thermal gas. In addition to this, we identify a rising con-tinuum in the mid-infrared above the synchrotron concon-tinuum that we interpret as a small amount of warm dust, collisionally heated by electrons heated by the shock. Most lines seen in optical and infrared then come from dense clumps of ejecta, where the shock wave has slowed significantly and become highly radiative.
What remains is to explain the faint [O III] emission seen at 800
. We propose that this is material that is still in free expansion, i.e. unshocked, that has been photoionized by ultraviolet photons emitted from the shockwave. The source of photoionization is two-fold; ultraviolet photons from the synchrotron nebula and those produced in fast radiative shocks both contribute appreciable amounts of ionizing radiation. We show below that to within a factor of 2, there are enough ionizing photons produced to account for the [O III] halo at 800
.
4.1.1. PWN Model
C05 discusses a model, based on a thin-shell approximation, for a pulsar wind nebula interacting with an inner supernova ejecta density profile. We have used this model along with our observations to determine various quantities about 0540, including how much hot gas should be present. Observable quantities for the pulsar include period (P), period derivative ( ˙P), luminosity ( ˙E) and for the nebula, size (R) and shell velocity (Vsh). While
the quantities for the pulsar are fairly well established by previous observations, those for the PWN are much more uncertain. Previous optical studies of the remnant (Mathewson et al. 1980; Kirshner et al. 1989), as well as radio observations (Dickel et al. 2002) interpreted the PWN as a bubble of radius ∼400
, and the optical observations gave expansion velocities less than 1400 km s−1
. Based on Chandra observations, Petre et al. (2007) concluded the nebula was slightly larger, with a radius of ∼500
. We shall adopt 500
(1.2 pc) as an estimate of the location of the ejecta shock.
However, Morse et al. (2006) detected faint [O III] emission in images extending out to a radius of∼800
. Based on similarities to the Crab Nebula, they interpreted this [O III] halo as being the outer edge of the shock from the pulsar wind overtaking the slower moving ejecta. Here we present an alternative interpretation of this [O III] halo emission. We propose that it is undecelerated ejecta that have been photoionized, rather than shock-ionized. The FWZI of the [O III] emission from Morse et al. was 3300 km s−1, which, given the extent
of 1.8 pc and our interpretation of this as undecelerated ejecta, provides the remnant age of 1140 years. While this is somewhat longer than the favored model of Reynolds (1985), it is at least reasonable given other age estimates made by previous studies of the object. Photoionization calculations are discussed in Appendix A.
As a first attempt to model the observations, we considered the case of a spherically symmetric shock wave driven by the energy input from the pulsar expanding into a medium with density profile described by ρSN = At−3(r/t)−m. We considered different values of
the parameter m, as dynamical mixing between the ejecta and surrounding medium would produce a complicated density structure. The swept-up mass does not exceed 1M in this
but we must first describe our line observations in detail.
4.2. Lines
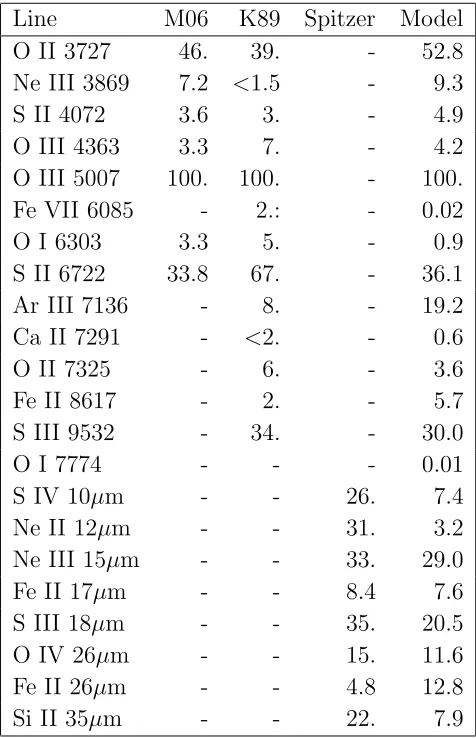
Eight emission lines are detected in the Spitzer spectrum. They provide constraints on the density and temperature of the emitting gas, and perhaps more importantly on the elemental abundances. They complement the optical spectra published by Kirshner et al. (1989) (K89), Morse et al. (2006) (M06) and Serafimovich et al (2005) (S05). We first summarize the implications of the optical spectra, then consider shock wave models for the combined optical and IR emission.
Several temperature estimates are available from the optical spectra. The [O III] line ratio I(4363)/I(5007) gives temperatures of about 24,000 K according to S05 or 34,000 K (K89). According to the CHIANTI database (Landi et al. 2006), the ratio given by K89 cor-responds to 50,000 K, while that given in M06 implies 24,000 K. K89 also find temperatures
>30,000 K from the [O II] I(7325)/I(3727) ratio and <10,000 K from [S II] I(4072)/I(6723). The [S II] ratio of M06 implies T = 14,000 K. Assuming a temperature of 10,000 K, S05 find a density of 1400 – 4300 cm−3, and at 14,000 K the range would be 1700 – 5000 cm−3.
The differences among the various temperature estimates may result partly from different reddening corrections and different slit positions, but it is clear that the [O III] lines are formed in hotter gas than the [S II] lines. The Spitzer data include only one pair of lines from a single ion, [Fe II] I(17.9µ)/I(26.0µ), which is constrained to be larger than 1.13. Again using CHIANTI, this requires a density above about 5000 cm−3 and a temperature above
4000 K. However, the ratio depends upon the deblending of the [Fe II] and [O IV] lines at 26µm, and the uncertainty may be larger than the formal value. The density contrast between the optically emitting material and the mean post-shock density from the global model indicates that as in the Crab Nebula, optically emitting material is concentrated in dense knots and/or filaments.
unless they produce no [O III] at all. Therefore, it seems likely that a model of a shock including the PWN ionizing radiation is needed.
We have computed models with the shock model described in Blair et al. (2000) illu-minated by the power law continuum described by Serafimovich et al. (2004). Briefly, the code is similar to that of Raymond (1979) and Cox & Raymond (1985), but it has been modified to describe SNR ejecta with little or no hydrogen. The most important difference is that the cooling rate is enormous, so that the electron temperature is well below the ion temperature in the hotter parts of the flow. The model is similar to those of Itoh (1981) and Sutherland & Dopita (1995). Unlike those models, we do not include the photoionization precursor of the shock, because the ionizing emission from the shock is considerably weaker than the ambient synchrotron radiation. In comparison with the spectra of Cas A, N123D and 1E0102-7219, shock models have the problems that no single shock model produces the observed range of ionization states, and that they tend to predict too much emission in the O I 7774 ˚A recombination line unless the cooling region is somewhat arbitrarily truncated (Itoh 1988). However, they do predict reasonable relative intensities from the UV to the near IR for O III and O II. Below, we attribute the truncation to mixing with hotter, lower density gas.
We assume a 20 km s−1
shock with a pre-shock density of 30 cm−3
, which produces a density of around 5000 cm−3 where the [S II] lines are formed. The elemental abundances
are O: Ne: Mg: Si: S: Ar: Ca: Fe = 1: 0.2: 0.1: 0.1: 0.1: 0.1: 0.1: 0.1 by number. H, He and N are not included in the model, because it seems likely that the lines from these elements arise in some other gas, like either the quasi-stationary flocculi or the outer shell of ejecta seen as very fast knots in Cas A (Kirshner & Chevalier 1977; Fesen 2001). The normalization of the power law flux assumes that the shocked gas is 1 pc from the center of the PWN.
data in the code are somewhat out of date and need to be updated. Nevertheless, the code gives a reasonable idea of the relative line intensities.
To compare this model with our observed IR spectra, we must place the Spitzer spectrum on the same scale as the optical spectra. We normalize the IR lines to [O III] 5007 = 100 by dividing the Spitzer intensities by 4 times the [O III] 5007 intensity given by M06. The factor of 4 is meant to account for the fact that the 200
slit used by M06 covers only about 1/4 of the remnant. This is obviously not a very accurate correction, but it is probably good to a factor of 2. Since the relative fluxes of many optical lines differ by a factor of 2 between M06 and K89, this is unfortunately the best we can do until an optical spectrum of the entire remnant becomes available.
The result is shown in Table 3. Overall, the agreement is astonishingly good for such a simple model. Several of the low ionization lines, [O I], [Ne II] and [Si II] are underpredicted, though the [Si II] line could be increased simply by increasing the silicon abundance. The ratio of the [S IV] to [S III] IR lines is too low, but inclusion of the harder part of the power law spectrum would improve that. Inclusion of the harder X-rays would also increase the intensity of the [Fe VII] line, though a lower pre-shock density or a higher shock speed would have the same effect. The oxygen column density of the model is only about 1014 cm−2
, and the thickness of the emitting region is only 6×1011 cm. If the thickness were large enough
to allow the remaining O+ to recombine, the predicted O I recombination line, which is
comfortably lower than the weakest detected lines, would increase to about 4 times the apparent detection limit of K89. The agreement would improve if the argon abundance were cut in half, but otherwise the abundances appear to match the observations.
The shock model shown in Table 2 produces 1.1×10⁻¹⁴erg cm−2 s−1 in the [Ne III] 15.5
micron emission line, so the flux shown in Table 1 would come from a region with surface area of 2×1038 cm2. This area is roughly equal to the area of a sphere of 500
radius but the emission could come from many smaller volumes with a total filling fraction of a few percent. Heavy-element ejecta enter these slow shocks at a rate of ∼0.01M yr
−1
.
We conclude that, as in the Crab (Sankrit & Hester 1997), the observations can be explained by shocks that heat and compress the gas in the radiation field of the PWN. The shock heating seems needed to reach the high temperatures seen in some line ratios and to provide the high densities observed, while the photoionization heating strengthens the low and moderate ionization lines. Oxygen is about ten times as abundant as the other elements. The shock speed and pre-shock density are not very well constrained, but a shock as fast as 80 km s−1 requires a low pre-shock density to match the observed density, and that in turn
In the last 100 years alone, about 1 M of heavy-element ejecta have been shocked,
more than the total mass of the swept-up ejecta in the global model described in Appendix B. This casts some doubt on the validity of the global, spherically symmetric model, where density within freely expanding ejecta was assumed to be a smooth power-law. It is possible that the innermost ejecta have been swept-up by an iron-nickel bubble, as inferred for SN 1987A by Li, McCray, & Sunyaev (1993) and modeled by Basko (1994) and Wang (2005) (see also brief discussion in C05). We explored the possibility that the global shock could be contained within the shell swept-up by the iron-nickel bubble. In this one-dimensional picture, the shock passed through the inner, low-density region in ∼50 years, and has since been contained within the high-density (n ∼30 cm−3
) bubble wall. We varied parameters of the model until the shock speed in the bubble was approximately 20 km s−1, as required by
line models. We find, however, that the mass flux of material entering the shock throughout the remnant’s entire lifetime has been unreasonably high for this model, approximately 0.01(t/1140 yr)−1/2M
yr
−1. In addition, a 20 km s−1 shock, even at such density, would not
adequately heat dust grains to temperatures observed. Dust heating is discussed in more detail in section 4.3.3.
We are forced to consider inhomogeneous ejecta with a fast global shock to heat dust to observed temperatures, and slower shocks producing observed line emission. We propose the following picture: The shock swept through the low-density iron-nickel bubble interior early in the life of the SNR. It then encountered the dense, clumpy shell of the bubble, slowing down and further fragmenting the shell into dense clumps, which are still being overrun by slow shocks, currently 20 km s−1. The global shock has now exited the iron-nickel bubble
shell, and is propagating through the ejecta with relatively low ambient density. The speed of this shock is not well known, but 250 km s−1 would be sufficient to heat the dust to the
4.2.1. Progenitor Mass
We have compared the abundances of heavy elements listed in section 4.2 with the predicted abundances of Woosley & Weaver (1995), who consider abundance yields from core-collapse SNe ranging in mass from 11-40M and metallicities between zero and solar.
We consider models with both solar and 0.1 solar metallicity, as this range is most likely to reflect a massive star in the LMC. Our abundances listed are somewhat uncertain, and result from fits to optical and infrared line strengths. We considered the ratios of O to Ne, Mg, Si, and Fe. The data do not single out a particular model from Woosley & Weaver (1995), but ratios of heavy elements to oxygen do favor a low-to-medium-mass progenitor. High-mass progenitors (>∼ 30 M) are less favored, since they produce larger amounts of
oxygen relative to other elements. This interpretation is consistent with that of Chevalier (2006), who favored a type IIP explosion for this object based on observations of hydrogen in the spectrum. This is also consistent with the idea that type IIP SNe should result from the explosion of a single star of 8-25M (Woosley et al. 2002).
It is possible to quantify these results even further. If we assume a constant heavy-element mass flux through the radiative shocks for 103 yr of 0.01 M
yr
−1
with our abun-dances listed above, we get a total ejected mass in oxygen of∼3.5M, though this number
should only be considered accurate to a factor of a few, and is likely an upper limit. When compared with predictions from models, this value favors stars in the range of 20-25 M.
Maeder (1992) gives slightly different abundance yields for SNe, with lower overall oxygen abundances produced. In his model, high-mass stars (>∼25M) actually produce less oxygen
than their lower-mass counterparts, due to mass-loss of outer layers and inability to synthe-size O from He and C. However, these massive stars would be Wolf-Rayet stars, and can be ruled out based on the detection of hydrogen in optical spectra.
4.3. Dust
One of the more obvious features of the continuum in 0540 as seen in Figure 9 is the excess of emission above the extrapolated radio synchrotron spectrum at longer wavelengths. A similar excess has been observed in the Crab (Temim et al. 2006), and has been attributed to warm dust. We have inferred the temperature and the amount of dust present, and have examined several possible mechanisms for grain heating.
spectrum more difficult. We have thus clipped obvious emission lines and bad pixels out of the spectrum for this analysis.
4.3.1. Synchrotron Component
In order to subtract the synchrotron component, it was necessary to produce a model synchrotron spectrum that includes the break in power-law indices from optical to radio. The synchrotron model used here is one of a class of simple outflow models in which various quantities are allowed to have power-law dependencies on radius: flow-tube width, flow veloc-ity, gas density (where mass loading might allow a range of possibilities), and magnetic-field strength (Reynolds, in preparation). Such models can produce synchrotron-loss steepening in spectral index both steeper and flatter than the homogeneous-source value 0.5 (Reynolds 2006). Here the model, used for illustrative purposes, invokes a simple outflow geometry with conical flow tubes (width w ∝ r), mass increasing as radius (due presumably to mass loading), flow velocity decreasing asr−2
roughly, and magnetic field as r−1
. The initial mag-netic field at the injection radius is B0 = 2.5×10⁻⁴ G. This model predicts a decrease in
size with frequency as θ ∝ ν−0.34, which might be slow enough to be consistent with
obser-vations, especially as it might take place along the line of sight. While this is not meant as a definitive model for 0540, it describes the data well as shown on Figure 10 and was used to estimate the synchrotron contribution.
The result of radiative losses on electrons above the break energy in a flat (N(E)∝E−s
with s <2) energy distribution is for such electrons to move to just below the break energy, where they can produce a perceptible “bump”. However, the “bump” is almost undetectable unless s is very close to 0; for the 0540 value s= 1.5, there is almost no departure from the power-law below the break frequency. The model in Figure 10 was calculated including the redistribution of electron energies, and it can be seen that the excess we observe below 24
µm cannot be attributed to this cause.
4.3.2. Fitting the Dust Component
µm in radius. In any case, in the limit of a λ, the results are independent of the choice of grain radius. We also do not know the grain composition, as general results from the LMC should not apply to ejecta dust. We thus consider two models; a graphite dust model and the “astronomical silicates” model of Draine & Lee (1984). We calculate the dust grain absorption cross section for both as a function of wavelength. We then fit a simple modified blackbody model (incorporating the grain absorption cross-section) to the data using a least-squares algorithm designed for this model. We obtain a dust mass of ∼ 3×10⁻³ M
at
a temperature of 50±8 K for silicate dust, while the resulting fit to the temperature with graphite grains was slightly higher,∼65 K, and the required dust mass was lower,∼1×10⁻³.
The errors on the dust temperature are estimates based on using different methods of removing lines and subtracting the background and the underlying synchrotron spectrum. The resultant dust spectrum is sensitive to these details. The dust mass should be considered uncertain, and is probably only accurate to within a factor of a few, as evidenced by the difference between derived masses for graphite and silicate grains. Our data do not allow us to distinguish between various dust compositions. It should also be noted that we are only sensitive to dust that has been warmed by the shock wave from the pulsar wind, and that there could be more dust that has not yet been shocked, and is still too cool to be detected. Thus, our mass estimate should be considered a lower limit.
4.3.3. Grain Heating Mechanisms
We now turn our attention to heating mechanisms for this dust. We first consider heating by the synchrotron radiation field from the PWN. Since the spectrum of the synchrotron radiation is known in the optical/UV portion of the spectrum and grain absorption cross-sections can be calculated as a function of wavelength, it is possible to estimate whether there is enough radiation to heat the dust to temperatures observed. We calculate the optical depth of the dust around the PWN, and integrate over all wavelengths from radio up 1 keV. Although the flux from the PWN is higher at longer wavelengths, most of the absorption occurs in the optical/UV portion of the spectrum, due to the steeply rising absorption cross-sections in this regime. We compare this number to the luminosity in dust derived from our dust model, ∼ 5×1035 ergs s−1
. A simple calculation showed that the radiation available falls short by several orders of magnitude of what is necessary.
the emission seen in IRS, it would predict a 70 µm flux that is several orders of magnitude higher than the upper limit we have placed on emission there. Given that these order of magnitude estimates are drastically inconsistent with our observations, we consider heating by photons from the PWN to be ruled out.
We then considered the somewhat more exotic possibility of the observed excess arising from a protoplanetary disk around the pulsar, unassociated with the nebula. It has long been known that planets can form around pulsars (Wolszczan & Frail 1992), and the supposition has been that these planets arise from a protoplanetary disk around the pulsar, the source of which has been attributed to several mechnisms (Bryden et al. 2006). Various surveys of known pulsars have been made in infrared and submillimeter wavelengths, but for the most part these surveys have only produced upper limits on the dust emission present.
However, Wang et al. (2006) conducted a survey of neutron stars with IRAC and found a debris disk around the young isolated neutron star 4U 0142+61. The authors suggest that the age of the debris disk compared to the spin-down age of the pulsar favors a supernova fallback origin. The IRAC observations combined with K-band Keck-I observations suggest a multi-temperature thermal model with temperatures ranging from 700-1200 K, where the disk has inner and outer radii of 2.9 and 9.7 R, respectively. Using the same model the
authors use (Vrtilek et al. 1990), we calculate the necessary radius to reproduce observed fluxes for 0540 for a disk with temperature ∼50 K to be on the order of 104 R
. A survey
of disks around Anomalous X-ray Pulsars (AXPs) (Durant & van Kerkwijk 2005) found several candidates for fallback disks which consistently had IR(K-band)/X-ray flux ratios of order 10−4. Although we were not able to find any archival near-infrared observations
of the PWN, we can make an estimate of this ratio by looking at the overall spectrum of the IRAC and optical points. An estimate of 5×10⁻² is reasonable for this ratio in
0540, significantly different than that found in the AXPs. Additionally, Wang et al. (2007) observed 3 known AXPs with Spitzer, and found no mid-IR counterpart to any of them. Given these discrepancies between these cases and that of 0540, we do not believe that a protoplanetary disk around the pulsar is the origin of the far-IR excess.
What then is the cause? Collisional heating by hot gas heated by shocks driven into the ejecta can provide both a qualitative and quantitative explanation for the dust present. Grain heating rate, H, goes as
H ∝ neveTe ∝P Te1/2, (1)
where ne, ve, and Te are electron density, velocity, and temperature, and P is the pressure,
temperatures much above∼25 K. Faster shocks, and thus higher temperatures, are required to heat grains to observed temperatures.
To determine whether this is plausible, given the conditions in the object, it is necessary to make an estimate of the amount of gas that is still hot, i.e. capable of heating dust grains through collisions with electrons. The shock cooling time (McKee 1987) is
tcool = 2.5×10¹⁰vs37/αρ0, (2)
wherevs7 is the shock speed in units of 107 cm s−1, ρ0 is the pre-shock density in amu cm−3,
and α≥ 1 is a parameter for the enhancement of cooling due to higher metal content. We find that a shock with velocity ∼ 250 km s−1 would effectively heat dust to 50 K, with a
pre-shock density of ∼ 8 amu cm−3, assuming the same pressure as in slow shocks. If the
dust component is composed of graphite grains at ∼65 K, a slightly faster shock of 325 km s−1 is required. Using the above equation, we find that the amount of hot gas is on the order
of a few tenths of a solar mass. This yields dust-to-gas ratios of a few percent. Given the unknown dust content within the inner ejecta of a supernova, we believe this is a reasonable explanation.
As a check on the constraints of such a fast shock, we calculated the expected X-ray emission from such a shock, and found it to be below the upper limits of thermal X-ray emission observed from the PWN, except for very metal-rich ejecta.
4.4. Origin of O-rich Clumps
Matzner & McKee (1999) considered a spherically-symmetric explosion of a 15MRSG,
and found that its He core and heavy element ejecta formed an approximately constant density, freely expanding ejecta core. C05 rescaled their results to other values of ejecta mass Mej and kinetic energy E51, arriving at the core density of
ρct3 = 2.4×10⁹(Mej/15M)5/2E −3/2
51 g cm
−3
s3. (3)
An additional compression is expected from the iron-nickel bubble effect. For the centrally-located Ni with mass MN i, the adjacent ejecta are expected to be swept up into a shell with
velocity
The compression within the Fe-Ni bubble shell is at least by a factor of 7, expected in strong, radiation dominated shocks with γ = 4/3. The shell density increases inward from a shock front to a contact discontinuity separating the shocked ejecta from the Fe-Ni bubble. In one dimensional hydrodynamical simulations, Wang (2005) finds an average shell compression by a factor of 20. The average shell density is then
ρ1t3 = 4.8×10¹⁰(Mej/15M)5/2E −3/2
51 g cm
−3 s3. (5)
(Diffusion of radiation might reduce this compression by a modest factor of ≤ 2 – Wang 2005.) At the current remnant’s age of 1140 yr, the shell density is
ρ1 = 1.0×10 −21
(Mej/15M)5/2E −3/2
51 g cm
−3
. (6)
Because the dense iron-nickel bubble shell has been accelerated by low-density gas within the bubble, the shell is subjected to the Rayleigh-Taylor instability, and we expect it to fragment into clumps. Within a factor of 2, their expected density is equal to the preshock density for the O-rich clumps in 0540. We conclude that these clumps are remnants of the iron-nickel bubble shell.
Matzner & McKee (1999) found a sharp density drop by a factor of 10 at the interface between the He core and the H envelope, with an approximately constant density through much of the H envelope. The envelope density ρenv is then
ρenvt3 = 2.4×10⁸(Mej/15M)5/2E −3/2
51 g cm
−3 s3, (7)
200 times less dense than the iron-nickel bubble shell. This density contrast is similar to the density contrast inferred between the O-rich clumps and the more tenuous inter-clump gas. It is likely that the PWN nebula expands now into the H envelope. Because the dense He core has been decelerated by the less dense H envelope during the SN explosion, the ensuing Rayleigh-Taylor instability led to a large-scale macroscopic mixing between them. As a result, we expect a two-phase medium ahead of the PWN shell, consisting of more tenuous H-rich gas and denser He-rich gas. It is possible that shocks driven into the He-rich gas became radiative; that could explain the presence of H and He recombination lines in optical spectra of 0540.
The dense iron-nickel bubble shell should contain not only O-rich ejecta, substantial amounts of He-rich gas are also expected. Slow (20 km s−1) shocks driven into the dense
species (see discussion in § 4.2). More detailed shock models are necessary to determine whether or not our picture is consistent with observations.
The identification of dense O-rich clumps in 0540 with a compressed and fragmented shell swept up by the iron-nickel bubble has important implications for ejecta detection in SNRs. Dense O-rich clumps are expected to produce strong optical or X-ray emission, once shocked and heated by the reverse shock. The optical emission should be most prominent for remnants with a particularly dense ambient medium, either of circumstellar (e.g., Cas A) or interstellar (N132D) origin. The entire class of optically emitting O-rich remnants may owe its existence to the iron-nickel bubble effect. For ejecta expanding into less dense ambient medium, X-ray emission is expected instead since clumps will be reverse-shocked much later when their densities dropped significantly because of free expansion. The O-rich clumps such as seen in 0540, even when shocked to X-ray emitting temperatures 10,000 yr after the explosion, will have substantial (∼ 1 cm−3
) electron densities and emission measures. Even old remnants should show O-rich ejecta in their interiors, in agreement with the accumulating evidence gathered by modern X-ray satellites. A good example is a 14,000 yr old SNR 0049 −73.6 in the SMC, where Chandra imaging and spectroscopy revealed the presence of a clumpy O-rich ring in its interior (Hendrick, Reynolds, & Borkowski 2005). Hendrick et al. interpreted this ring as the shell swept up by the iron-nickel bubble, based on mostly theoretical arguments. Observational evidence for the iron-nickel bubble effect in 0540 strengthens this interpretation for 0049−73.6, and possibly for many more mature SNRs with detected ejecta emission in their interiors.
Dust formation is most likely to occur where ejecta density is the highest. The dense O-rich clumps likely contain dust; this dust may survive the passage through the radiative shock. If it were mixed into the much hotter ambient medium, this surviving dust may be the source of the observed infrared emission.
5. Summary
We have observed the supernova remnant B0540-69.3 with all three instruments aboard the Spitzer Space Telescope. We detected the PWN in all 4 IRAC bands, as well as the 24 µm MIPS band. We did not detect any emission from the PWN at 70 µm, though the upper limit is rather unconstraining. We found no hint of detection at any wavelength of the ∼3000
in slope of the overall synchrotron spectrum taking place in mid-infrared wavelengths, as is required to match the radio synchrotron power-law with the optical power-law.
The IRS spectra in the 10-37 µm region show a clear excess of infrared emission that cannot reasonably be attributed to any synchrotron radiation. We conclude that this excess emission is coming from a small amount (∼ 1−3×10⁻³M
) of warm dust that has been
formed in the expanding ejecta from the SN. We consider multiple heating mechanisms for this dust, ruling out both a fallback disk around the neutron star and heating by the synchrotron radiation from the PWN itself. We conclude that the dust is being heated by shocks being driven into the ejecta by the energy input from the pulsar. We derive a dust-to-gas mass ratio of the order of a few percent, which is reasonable given how little is known about dust content in the inner ejecta of SNe.
We consider the extended (800
in radius) [O III] emission discovered by Morse et al. in HST images of the nebula, and attribute this to undecelerated ejecta that have been photoionized by photons from both the radiative pulsar wind shocks and the synchrotron radiation from the nebula. While there are not enough ionizing photons to do this assuming solar abundances, we show that realistic assumptions about the heavy element abundances in the ejecta, which are almost certainly not solar, provide a plausible explanation of the [O III] halo.
We also detect a number of lines coming from both the ejecta in the PWN and the background/foreground H II region. Most of the line structures contained both a broad and a narrow component, blended together due to the modest spectral resolution of the instrument. We performed multi-gaussian fits to the line structures to identify both of these components separately. The widths of the lines, as well as their redshift from their rest wavelength, are broadly consistent with previous line studies done in optical wavelengths. We find line widths of order 1000-1300 km s−1, and shifts between broad and narrow components
of lines of order 300-400 km s−1. We model these lines, as well as those found in optical
wavelengths, and conclude that slow (∼20 km s−1
) shocks driven into dense (∼ 30 cm−3
), O-rich clumps of material provide the most satisfactory agreement with measured intensities. We find a preshock density contrast of ∼100 between the dense, optically-emitting clumps and the rarefied gas behind the global shock, assuming rough pressure balance between the two phases.
Our global picture of the pulsar-wind nebula consists of several elements. An expanding, accelerating shell of material is driven into the inner ejecta from the supernova, passing through the iron-nickel bubble and the dense, clumpy shell, into which shocks are being driven at 20 km s−1. The fast, global shock has exited the bubble walls, and has now
has been photoionized by UV photons from both the shock and the synchrotron nebula, and this photoionized material is observed in the form of an [O III] halo. This picture is able to account for observations in the broad wavelength range from radio to X-rays.
Future, high-resolution observations of this object in infrared wavelengths, such as those which will be possible with the James Webb Space Telescope, will serve to further its un-derstanding. Just a few of the possibilities that could be studied with such observations are: spatial identification of the location of infrared lines, further search for an infrared shell at 3000
corresponding morphologically with the X-ray shell, and identification of the spatial location of the dust in the PWN. Further spectroscopy on the warm dust component could potentially constrain the composition of dust formed out of ejecta. The global shock is just one possible location for the hot gas capable of heating dust grains, it is also possible that the shocked and dusty heavy-element ejecta have been reheated in the turbulent and hot PWN interior. The order of magnitude increase in the spatial resolution of JWST can shed light on our hypothesis of the global picture of the PWN. In addition, deep ground-based spectra of the [O III] halo can confirm or refute the photoionization origin we have suggested here.
REFERENCES
Basko, M. 1994, ApJ, 425, 264
Blair, W.P., Raymond, J.C., Danziger, J. & Mateucci, F. 1989, ApJ, 338, 812
Blair, W.P., et al. 2000, ApJ, 537, 667
Borkowski, K.J., et al. 2006, ApJ, 642, L141
Bryden, G., et al. 2006, ApJ, 646, 1038
Chanan, G.A., & Helfand, D.J. 1990, ApJ, 352, 167
Chanan, G.A., Helfand, D.J., & Reynolds, S.P. 1984, ApJ, 287, L23
Chevalier, R.A., & Fransson, C. 1992, ApJ, 395, 540
Chevalier, R.A. 2005, ApJ, 619, 839
Chevalier, R.A. 2006, Proceedings of 2006 STScI May Symposium on Massive Stars, astro-ph/0607422
Clark, D.H., Tuohy, I.R., Long, K.S., Szymkowiak, A.E., Dopita, M.A., Mathewson, D.S., & Culhane, J.L. 1982, ApJ, 255, 440
Cox, D.P. & Raymond, J.C. 1985, ApJ, 298, 651
Dickel, J.R., et al. 2002, ASPC, 271, 195
Draine, B.T., & Lee, H.M. 1984, ApJ, 285,89
Durant, M. & van Kerkwijk, M.H. 2005, ApJ, 627, 376
Ercolano, B., Barlow,M.J., & Sugerman, B.E.K. 2007, MNRAS, 375, 753
Fesen, R.A. 2001, ApJS, 133, 161
Gaensler, B.M., & Slane, P.O. 2006, ARA&A, 44, 17
Gallant, Y.A., & Tuffs, R.J. 1999, ESASP, 427, 313
Hendrick, S.P., Reynolds, S.P., & Borkowski, K.J. 2005, ApJ, 622, 117
Henize, K. G. 1956, ApJS, 2, 315
Itoh, H. 1981, PASJ, 33, 5211
Itoh, H. 1988, PASJ, 40, 673
Kaaret, P., et al. 2001, ApJ, 546, 1159
Kennel, C.F., & Coroniti, F.V. 1984, ApJ, 283, 710
Kirshner, R.P. & Chevalier, R.A. 1977, ApJ, 218, 142
Kirshner, R.P., Morse, J.A., Winkler, P.F., & Blair, W.P. 1989, ApJ, 342, 260
Landi, E., Del Zanna, G., Young, P.R., Dere, K.P., Mason, H.E. & Landini, M. 2006, ApJS, 162, 261
Le Marne, A.E. 1968, MNRAS, 139, 461
Li, H., McCray, R., & Sunyaev, R.A. 1993, ApJ 419, 824
Livingstone, M.A., Kaspi, V.M., & Gabriil, F.P. 2005, ApJ, 633, 1095
Long, K.S., & Helfand, D.J. 1979, ApJ, 234, L77
Maeder, A. 1992, A & A, 264, 105
Manchester, R.N., Staveley-Smith, L., & Kesteven, M.J. 1993, ApJ, 411, 756
Mathewson, D.S., & Clarke, J.N. 1973, ApJ, 180, 725
Mathewson, D.S., Dopita, M.A., Tuohy, I.R., Ford, V.L., 1980, ApJ, 242, L73
Matzner, C.D., & McKee, C.F., 1999, ApJ, 510, 379
McKee, C.F., 1987, in Spectroscopy of Astrophysical Plasmas, edited by A. Dalgarno and D. Layzer (Cambridge University Press, Cambridge), p. 226
Mills, B.Y., Turtle, A.J., & Watkinson, A. 1978, MNRAS, 185, 263
Milne, J.K., Caswell, J.L., & Haynes, R.F. 1980, MNRAS, 191, 469
Morse, J.A., Smith, N., Blair, W.P., Kirshner, R.P., Winkler, P.F. & Hughes, J.P., 2006, ApJ, 644,188
Pacini, F., & Salvati, M. 1983, ApJ, 186, 249
Pun, C.S.J. et al. 2002, ApJ, 572, 906
Raymond, J. 1979, ApJS, 39, 1
Raymond, J.C., Cox, D.P., & Smith, B.W. 1976, ApJ, 204, 290
Rees, M.J., & Gunn, J.E. 1974, MNRAS, 161, 1
Reynolds, S.P. 2006, BAAS, 38, 343
Reynolds, S.P. 1985, ApJ, 291, 152
Reynolds, S.P., Chevalier, R.A. 1984, ApJ, 278, 630
Sankrit, R. & Hester, J.J. 1997, ApJ, 491, 796
Serafimovich, N.I., Shibanov, Yu.A., Lundqvist, P., & Sollerman, J. 2004, A&A, 425, 1041
Serafimovich, N.I., Lundqvist, P., Shibanov, Yu.A., & Sollerman, J 2005, Ad. Sp. Res., 35, 1106
Seward, F.D., Harnden, F.R., & Helfand, D.J. 1984, ApJ, 287, L19
Shull, J.M., McKee, C.F. 1979, ApJ, 227, 131
Sutherland & Dopita 1995 ApJ 439, 381
Temim, T., et al. 2006, AJ, 132, 1610
Vrtilek, S.D. et al. 1990, A&A, 235, 162
Wang, C., 2005, ApJ, 626, 183
Wang, Z., Chakrabarty, D., & Kaplan, D. 2006, Nature, 440, 772
Wang, Z., Kaspi, V.M., & Higdon, S.J. 2007, ApJ, 655, 1292
Williams, B.J., et al. 2006, ApJ, 652, L33
Wolszczan, A. & Frail, D.A. 1992, Nature, 355, 145
Woosley, S.E. & Weaver, T.A. 1995, ApJS, 101, 181
Woosley, S.E., Heger A., & Weaver, T.A. 2002, Rev. of Mod. Phys., 74, 1015
Table 1. Measured Fluxes
Channel Flux
IRAC Ch.1 (3.6µm) 1.77±0.23 IRAC Ch.2 (4.5µm) 2.19±0.27
IRAC Ch.3 (5.8µm) 3.61±0.46
IRAC Ch.4 (8.0µm) 5.10±0.74
MIPS Ch.1 (24µm) 13.19±3.95 MIPS Ch.2 (70µm) <366
–
30
–
Narrow Component Broad Component
Line λ(µm) Fluxa
FWHMb
(µm) λ(µm) Fluxa
FWHMb
FWHM (km s−1) Shift (km s−1)
[S IV] (10.5105) 10.5165 2.12+0.53
−0.53 1.75 10.5261
+0.0017
−0.0015 7.32
+1.0
−1.0 3.89
+0.32
−0.21 1110
+91
−60 +274
+49
−43 [Ne II] (12.8135) 12.8208 5.86+0.50
−0.50 2.14 12.8436
+0.0036
−0.0034 4.98
+0.85
−0.85 4.28
+0.61
−0.66 1000
+72
−154 +534
+84
−80 [Ne III] (15.5551) 15.5639 4.59+0.29
−0.29 2.59 15.5823
+0.0018
−0.0019 7.29
+0.56
−0.56 6.86
+0.31
−0.32 1320
+62
−62 +354
+35
−37
[Fe II] (17.9359) - - - 17.9663+0.0025
−0.0025 3.01
+0.38
−0.38 6.84
+0.54
−0.65 1140
+90
−109
-[S III] (18.7130) 18.7236 2.22+0.40
−0.40 3.12 18.7407
+0.0012
−0.0011 10.18
+0.59
−0.59 6.07
+0.18
−0.16 972
+28
−26 +274
+19
−19
[O IV] (25.8903) - - - 25.9454+0.025
−0.0062 5.32
+1.7
−1.7 13.39
+3.8
−1.4 1650
+300
−180
-[Fe II] (25.9883) - - - 26.0375 1.71+0.61
−1.7 10.03 1140
-[Si II] (34.8152) 34.8419 5.13+0.27
−0.27 5.81 34.8875
+0.0018
−0.0061 2.75
+0.31
−0.31 8.42
+0.25
−0.79 724
+22
−68 393
+16
−53
a
Flux in units of 10−14ergs cm−2 s−1
b
FWHM in units of 10−2µm
Table 3
Normalized Emission Line Fluxes
Line M06 K89 Spitzer Model
O II 3727 46. 39. - 52.8
Ne III 3869 7.2 <1.5 - 9.3
S II 4072 3.6 3. - 4.9
O III 4363 3.3 7. - 4.2
O III 5007 100. 100. - 100.
Fe VII 6085 - 2.: - 0.02
O I 6303 3.3 5. - 0.9
S II 6722 33.8 67. - 36.1
Ar III 7136 - 8. - 19.2
Ca II 7291 - <2. - 0.6
O II 7325 - 6. - 3.6
Fe II 8617 - 2. - 5.7
S III 9532 - 34. - 30.0
O I 7774 - - - 0.01
S IV 10µm - - 26. 7.4
Ne II 12µm - - 31. 3.2
Ne III 15µm - - 33. 29.0
Fe II 17µm - - 8.4 7.6
S III 18µm - - 35. 20.5
O IV 26µm - - 15. 11.6
Fe II 26µm - - 4.8 12.8
Fig. 7.— A cartoon sketch of our general picture discussed in section 4.1. Not to scale. FS refers to the forward shock from the SN blast wave, at a radius of ∼ 3000
. RS refers to the reverse shock, which has not yet been observed, and is at an unknown position between 10 and 3000
from the pulsar. [O III] refers to the extent of the halo of material that has been photoionized, and is seen in optical images to extend to 800
. PWN refers to the edge of the shock driven by the pulsar wind, and is located at a radius of 500
"!
$#% $#% $#& $ $ $
'(%)
*
+%, -%.
/
0123547673874:97;7<=2>@?7A7BC?7DFECGIH
A. PHOTOIONIZATION CALCULATION
There are two sources of ionizing photons that can pre-ionize the material ahead of the shock; ionizing photons produced behind radiative shocks, and those produced by relativistic electrons in the form of synchrotron radiation. We examine each of these in turn. Detailed photoionization calculations would require modeling that is beyond the scope of this paper, and we present calculations that are only intended to be rough estimates. Since we do not have a detailed, multi-dimensional model that provides the shock dynamics after it encounters the iron-nickel bubble, we here detail the calculations done in the absence of the bubble, assuming the models of C05 describe the global shock encountering the inner ejecta. We intend only for this rough calculation to show that photoionization is a plausible mechanism for ionizing material out to 800
.
First, it is necessary to determine the amount of ionizing radiation emergent from behind the shock. Shull & McKee (1979) give emergent photon number fluxes per incoming hydrogen atom as a function of shock speed. Since we know both the density and the shock speed in 0540 as a function of time for a given density profile, we are able to calculate the number of ionizing photons emerging from the shock over the lifetime of the remnant. Here we consider the m= 1.06 case. We count all photons with energies above 13.6 eV as ionizing. However, Shull & McKee only considered shocks up to 130 km s−1. By calculating the cooling time
from equation (2), we see that shocks in 0540 are radiative up to speeds of over 150 km s−1.
In order to extrapolate the numbers given in Shull & McKee, we use figure 13 of Pun et al. (2002), and assume a single constant factor as the relationship between the total number of Hα photons and the total number of ionizing photons. We then simply integrate the total number of ionizing photons throughout the lifetime of the nebula. We exclude early times when densities were high enough that recombination times were shorter than the age of the remnant (about the first 450 years). Using the same conditions as were used above for modeling the nebula, we find that photoionization from radiative shocks can ionize 0.53
M.
We then calculated how far out the ionization front would extend, to see if this could account for the [O III] emission at 800
observed by Morse et al. Using m = 1.06 as the power-law index for the ejecta density profile, the relation between the mass and radius of the ionization front to that of the shock front can be written as
(Mif
Msh
)0.515 = Rif
Rsh
, (A1)
where Mif is the mass ionized by both mechanisms, plus the mass swept up during the
early stages of the remnant when recombinations were occuring, and Msh is the mass swept
by the shock, given above as 0.75 M. With Mif = 1.25M and Msh = 0.75M, we find a
ratio ofRif toRsh of 1.3. While this is not quite enough to account for the observed [O III]
emission at 1.8 pc, this is almost certainly an underestimate of the amount of photoionized material.
The same calculations for the case of a flat density profile yield the following values. UV photons from the radiative shocks can photoionize 0.83 M, while the synchrotron photons
from the nebula can ionize 0.18M (the difference in this number is due to the fact that the
recombination timescale is slightly longer for the higher densities involved in this case, thus fewer photons are included in the final photon count). The shock itself sweeps up 0.95 M,
and the relation between the mass interior to the ionization front and the mass interior to the shock front is given by
(Mif
Msh
)1/3 = Rif
Rsh
. (A2)
We find that the ionization front is 1.2 times farther out than the shock front. Again, while this is not enough to account for what is observed, it can be considered a lower limit.
As a possible resolution to this, we return to the issue of heavy element abundances. The calculations above assume standard solar abundances, but, one would clearly expect the shock encountering the ejecta to be overtaking material that is higher in metallicity than solar. If the ejecta that the shock is running into is enriched in helium and other heavier elements, more mass can be ionized per ionizing photon (differences in ionization potential notwithstanding). Since, for the case of m = 1.06, a modest factor of∼2 in the amount of shock ionized mass would account for the emission seen at 800