FAILURE ASSESSMENT DIAGRAM ASSESSMENTS OF LARGE-SCALE
CRACKED STRAIGHT PIPES AND ELBOWS
R A Ainsworth1, M Gintalas1, M K Sahu2, J Chattopadhyay2 and B K Dutta2
1
The University of Manchester, Pariser Building, Sackville Street, Manchester M13 9PL, UK
2 Reactor Safety Division, Hall-7, Bhabha Atomic Research Centre, Mumbai 400085, India
ABSTRACT
This paper reports defect assessments of experiments on large-scale straight pipes and elbows using failure assessment diagram (FAD) methods. The pipes and elbows were of various pipe diameters and contained a range of sizes of cracks sharpened by fatigue loading. Solutions in the literature for stress intensity factor and limit load have been evaluated and up-to-date solutions used as inputs to the FAD assessments. The assessed loads for crack initiation are close to those observed experimentally for straight pipes under pure bending. For elbows, the assessed loads using the FAD approach are generally lower than the experimental loads for crack initiation demonstrating conservatism in the FAD approach. The FAD assessments give confidence in the use of the modern stress intensity factor and limit load solutions for practical defect assessments. The paper indicates how constraint modifications to the FAD may be used to improve accuracy.
INTRODUCTION
In a wide range of industries, structural integrity assessments of piping components containing defects are required to demonstrate safe and reliable operation. For example, leak-before-break (LBB) assessments of primary piping systems of some nuclear power plant assume the presence of cracks and demonstrate that such cracks lead to detectable leakage before pipe burst. There have been many studies addressing the defect tolerance of piping components, some addressing the influence of defects on the collapse load, others addressing fracture using linear and non-linear fracture mechanics. This has led to the inclusion of procedures for assessment of piping components within more general fracture assessment approaches such as R6 (2013), BS7910 (2013), API 579 (2007), RSE-M (2010) and others.
There is some large-scale experimental validation of the methods for assessment of piping components. For example, recently Zhu and Leis (2012) examined the burst pressure prediction of over 100 uncracked pipes while Bedairi et al. (2012) examined the influence of corrosion defects on fracture. Another study involved a large number of large-scale tests on straight pipes and elbows of various pipe sizes and crack configurations subjected to different loading conditions, as summarised by Chattopadhyay et al. (2000), Chattopadhyay et al. (2005) and assessed recently in Chattopadhyay et al. (2014).
This paper revisits the experimental data on large-scale piping components of Chattopadhyay et al. (2000, 2005). Although these data have been assessed using a number of fracture mechanics approaches as discussed in Chattopadhyay et al. (2014), recently there have been developments in both stress intensity factor and limit load solutions for defective straight pipes and elbows (An
et al.
(2010), Lei(2011), Kimet al.
(2007), Leiet al.
(2014), Chattopadhyayet al
(2004), Chattopadhyay and Tomar (2006)). ThisEXPERIMENTAL DATA
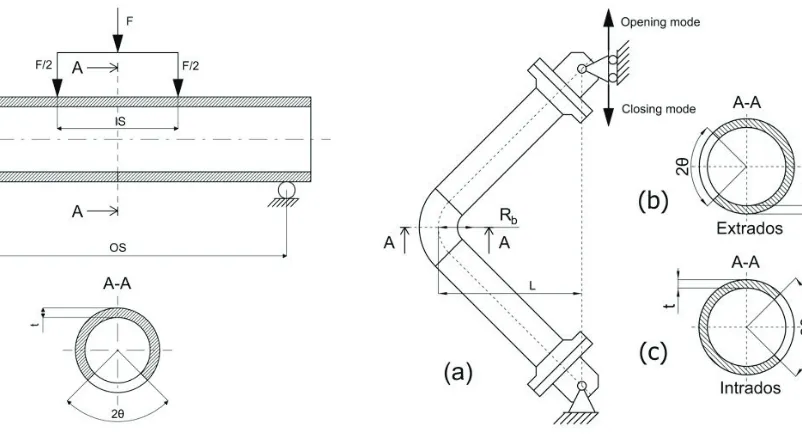
Six fracture tests were carried out on cracked pipes of SA333 Grade 6 steel under quasi-static monotonic four-point bending as shown schematically in Figure 1. The geometries of the cracked pipes in terms of outer diameter, Do, thickness, t, mean radius, Rm, and total crack angle of the circumferential cracks, 2θ, are given in Table 1. Measurements of inner (IS) and outer span (OS) dimensions are also presented in Table 1. Values of the total load applied to the pipes, the load-line displacement and crack length/growth were recorded during each test. Initiation loads, , were defined at a crack extension of 0.2mm. More details of the tests are described by Chattopadhyay et al. (2000) and Chattopadhyay et al. (2005).
Table 1: Dimensions of large-scale pipe tests
Test number Outer diameter Do [mm]
Thickness t [mm] Rm/t
Outer span OS [mm]
Inner span IS [mm]
Crack angle 2θ [°] θ/π
SPBMTWC8-1 219 15.15 6.73 4000 1480 65.6 0.18
SPBMTWC8-2 219 15.10 6.75 4000 1480 93.9 0.26
SPBMTWC8-3 219 15.29 6.66 4000 1480 126.4 0.35
SPBMTWC16-1 406 32.38 5.77 5820 1480 96.0 0.27
SPBMTWC16-2 406 32.15 5.81 5820 1480 126.3 0.35
SPBMTWC16-3 406 32.36 5.77 5820 1480 157.8 0.44
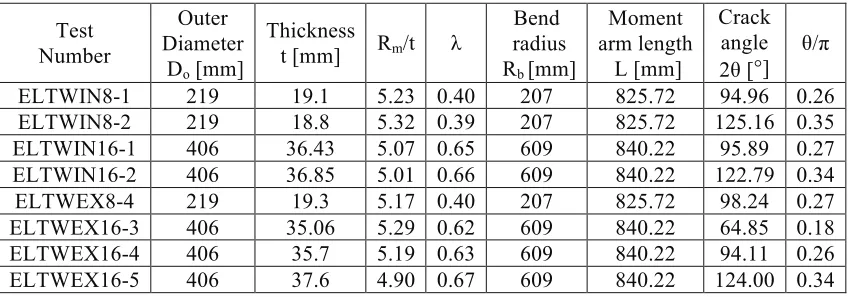
Eight 90º elbows of SA333 Grade 6 steel with circumferential through-wall cracks, at the intrados or extrados, were tested by applying static in-plane bending. The elbows cracked at the extrados were tested under closing mode and those cracked at the intrados were tested under opening mode. Straight pipes were welded to each side of an elbow and to flanges, bolted to circular plates, for connection to the loading. Figure 2 is a schematic of an elbow test set up.
The geometric properties of the elbows are given in Table 2 and are similar to those of the straight pipes but additionally include the bend radius, Rb and the elbow factor, λ, defined by
! (1)
Elbows cracked at the intrados have test numbers containing “IN”; elbows cracked at the extrados have test numbers which contain “EX”. The experimental loading arrangement is given in terms of the moment arm length, L, shown in Figure 2.
Table 2: Dimensions of large-scale elbow tests
Test Number Outer Diameter Do [mm] Thickness
t [mm] Rm/t λ
Bend radius Rb [mm] Moment arm length L [mm] Crack angle 2θ [°] θ/π
ELTWIN8-1 219 19.1 5.23 0.40 207 825.72 94.96 0.26
ELTWIN8-2 219 18.8 5.32 0.39 207 825.72 125.16 0.35
ELTWIN16-1 406 36.43 5.07 0.65 609 840.22 95.89 0.27
ELTWIN16-2 406 36.85 5.01 0.66 609 840.22 122.79 0.34
ELTWEX8-4 219 19.3 5.17 0.40 207 825.72 98.24 0.27
ELTWEX16-3 406 35.06 5.29 0.62 609 840.22 64.85 0.18
ELTWEX16-4 406 35.7 5.19 0.63 609 840.22 94.11 0.26
! !
Figure 1. (a) Loading configuration for the pipe test, where outer span (OS) is distance between the supports and inner span (IS) is distance between the loading points; (b) cross-sectional view of a pipe with a through-wall crack
Figure 2. Loading configuration of an elbow under in plane bending moment: (a) test set up, (b)
cross-sectional view of an elbow with a through-wall crack at extrados-closing mode, (c) crack at
intrados-opening mode
INPUTS TO FAD ASSESSMENT
Material data from small-scale tests
Materials data have been obtained from standard tensile tests and three-point bend (TPB) specimens for the SA 333 Grade 6 carbon steel used in the pipe tests. Results are presented in Table 3; the yield stress, , ultimate stress, , and fracture toughness data depend on the outer diameter of the pipe, Do.Ductile
initiation fracture toughness values J0.2were obtained using stretch zone width (SZW) measurements at a crack growth of Δa=0.2mm.
Table 3: Properties of SA 333 Grade 6 steel as a function of pipe diameter
D0 [mm]! E [GPa]! ν! σy [MPa]! σu [MPa]! J0.2 [N/mm]! βT!
219 203 0.3! 288! 420! TPB 8: a/W=0.513220 from
! 0.096!
406! 203! 0.3! 312! 459! TPB 16: a/W=0.453 236 from 0.045!
For the 219mm pipe diameter, initiation toughness was determined from TPB 8 specimens with a relative crack depth a/W=0.513 and for the 406mm pipe from TPB 16 specimens with a/W=0.453. Values of a constraint parameter βT ( where Lr is the R6 load to limit load ratio and T is the elastic
T-stress) were calculated from
Equation (2) is taken from R6 (2013) for S/W=4 and is valid for 0≤a/W≤0.8. Positive values of constraint parameter indicate that the fracture toughness values of 220 and 236 N/mm correspond to high constraint.
Stress Intensity Factor Solutions
In order to apply FAD methods, it is necessary to evaluate the stress intensity factor, . The following solution for circumferentially through-wall cracked pipes under in-plane bending moment (R6 (2013), Zahoor (1985)) was used:
! (3)
where the bending stress, , is defined in terms of the bending moment as
! (4)
The correction function, , in Equation (3) is
Fb=1+A 4.5967
[
(
θ/π)
1.5+2.6422(
θ/π)
4.24]
!"#$! ! (5)where
A=
[
0.125 R(
m/ t)
−0.25]
0.25 !"#$! ! (6)For each pipe the values of the ratios and are included in Table 1. All the pipes tested are
within the validity limits on and in Equations (5, 6).
The stress intensity factor for circumferentially through-wall cracked elbows under in-plane bending is taken from the solution developed by An et al. (2010) which is also in the form of Equations (3, 4). Values for the function in this case are presented in tabular form in An et al. (2010) for particular
elbow sizes as functions of , and . Calculated values of for the eight elbows are listed in Table 4.
Table 4: Values of the function for a crack at the centre of the elbow
ELTWIN 8-1
ELTWIN 8-2
ELTWIN 16-1
ELTWIN 16-2
ELTWEX 8-4
ELTWEX 16-3
ELTWEX 16-4
ELTWEX 16-5
1.654 2.247 1.603 2.022 1.097 0.853 1.201 1.625
Limit Load Solutions
For circumferentially through-wall cracked pipes under combined bending moment and internal pressure, a limit load, , is given by Lei et al (2014), which for bending moment only solution simplifies to
ML=4Rm
2
tσy
[
cos(
θ/π)
−(1 /2) sinθ]
1+(
1 /12)
(
t / Rm)
2The limit moment for circumferentially through-wall cracked elbows under in-plane closing bending is taken as the product of the limit moment for an un-cracked elbow and a weakening factor :
! (8)
The solution for a defect free elbow under closing moment was recently developed in Lei (2011):
! (9)
where is the limit moment for the uncracked straight pipe:
! (10)
and λ is the elbow factor defined in Equation (1).
The weakening factor due to the presence of the crack is (Lei et al. (2014)):
! (11)
The values of the ratio and λ are included in Table 2 for each elbow.
The limit moment solution for circumferentially through-wall cracked elbows under in-plane opening bending is again taken as the product of the solution for an un-cracked elbow and a weakening factor as in Equation (8). The solution for a defect free elbow under opening moment was again recently developed by Lei (2011) as:
!!!!!!!!"#$! ! (12)
where the uncracked straight pipe limit moment is again given by Equation (10). The weakening factor due to the presence of the crack in this case is (Chattopadhyay et al. (2006)):
!!!!!!!"#$! ! (13)
FAD RESULTS
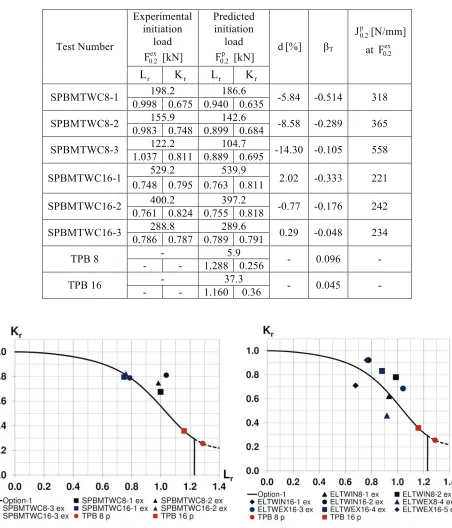
assessment points being on the FAD at the experimental initiation load are also given. Figure 3 shows the assessment points ( , ) evaluated at the experimental initiation loads plotted on the FAD.
Table 5: Comparison of experimental and predicted initiation loads for pipes
Experimental initiation
load [kN]
Predicted initiation
load [kN]
Test Number [%] βT
[N/mm]
at
198.2 186.6
SPBMTWC8-1
0.998 0.675 0.940 0.635 -5.84 -0.514 318
155.9 142.6
SPBMTWC8-2
0.983 0.748 0.899 0.684 -8.58 -0.289 365
122.2 104.7
SPBMTWC8-3
1.037 0.811 0.889 0.695 -14.30 -0.105 558
529.2 539.9
SPBMTWC16-1
0.748 0.795 0.763 0.811 2.02 -0.333 221
400.2 397.2
SPBMTWC16-2
0.761 0.824 0.755 0.818 -0.77 -0.176 242
288.8 289.6
SPBMTWC16-3
0.786 0.787 0.789 0.791 0.29 -0.048 234
- 5.9
TPB 8
- - 1.288 0.256 - 0.096 -
- 37.3
TPB 16
- - 1.160 0.36 - 0.045 -
! !
Figure 3. Circumferentially through-wall cracked pipes. Experimental initiation load points
(Δa=0.2 mm) on FAD
Figure 4. Circumferentially through-wall cracked elbows. Experimental initiation load points
It can be seen that that ductile initiation occurs before plastic collapse and that the predicted initiation loads are close to the experimental loads. Table 5 includes the percentage differences
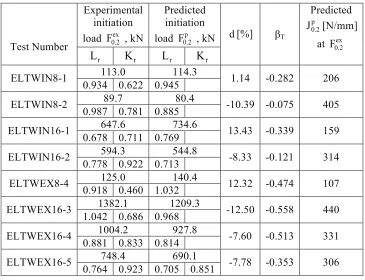
For the 8 elbows, the predicted ductile initiation loads are compared with the experimental initiation loads in Table 6. Also included in the table are the values of , at the experimental and predicted
initiation loads and predicted values of which would lead to assessment points being on the FAD at
the experimental initiation loads. Figure 4 shows the assessment points ( , ) evaluated at the experimental initiation loads, plotted on the FAD. It can be seen that the predicted initiation loads generally exceed the experimental loads, with the percentage differences given in Table 6, and that ductile initiation occurs before plastic collapse, although often close to =1.
Table 6: Comparison of experimental and predicted initiation loads for elbows
Experimental initiation load , kN
Predicted initiation load , kN Test Number
[%] βT
Predicted [N/mm]
at
113.0 114.3
ELTWIN8-1
0.934 0.622 0.945 1.14 -0.282 206
89.7 80.4
ELTWIN8-2
0.987 0.781 0.885 -10.39 -0.075 405
647.6 734.6
ELTWIN16-1
0.678 0.711 0.769 13.43 -0.339 159
594.3 544.8
ELTWIN16-2
0.778 0.922 0.713 -8.33 -0.121 314
125.0 140.4
ELTWEX8-4
0.918 0.460 1.032 12.32 -0.474 107
1382.1 1209.3
ELTWEX16-3
1.042 0.686 0.968 -12.50 -0.558 440
1004.2 927.8
ELTWEX16-4
0.881 0.833 0.814 -7.60 -0.513 331
748.4 690.1
ELTWEX16-5
0.764 0.923 0.705 0.851 -7.78 -0.353 306
Also shown in Figures 3 and 4 are assessment points for the two sizes of three-point-bend specimen at initiation, based on solutions for limit load and stress intensity factor in R6 (2013). The positions of the assessment points clearly differ for components and specimens with crack initiation in specimens occurring close to the collapse load. There are differences between specimens and components because of the different geometries and different constraint conditions. A transferability approach to address these differences is considered next.
CONSTRAINT MODIFIED FAD ASSESSMENT
at initiation in the pipe and elbow tests with those in specimens is as follows. First, for the component tests, the parameters Kr, Lr and the predicted fracture toughness at the initiation load are known from application of the failure assessment procedure and results from Table 5 are reproduced in Table 7 for one sample pipe tests. From recent finite element results (Gintalas and Ainsworth (2015)), values of βT were evaluated for cracked pipes under bending and the solution for the sample test is given in Table 7.
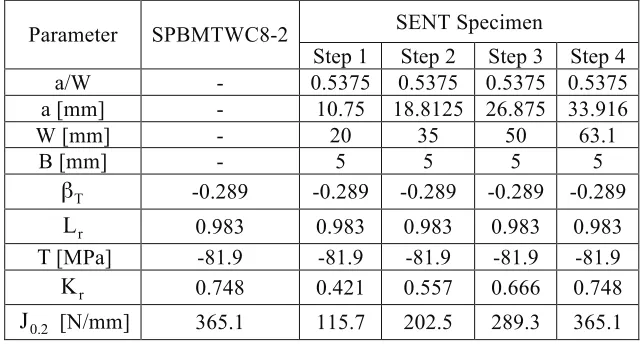
Table 7: Transferability parameters for SPBMTWC8-2 pipe and SENT specimen
SENT Specimen Parameter SPBMTWC8-2
Step 1 Step 2 Step 3 Step 4
a/W - 0.5375 0.5375 0.5375 0.5375
a [mm] - 10.75 18.8125 26.875 33.916
W [mm] - 20 35 50 63.1
B [mm] - 5 5 5 5
-0.289 -0.289 -0.289 -0.289 -0.289
0.983 0.983 0.983 0.983 0.983
[MPa] -81.9 -81.9 -81.9 -81.9 -81.9
0.748 0.421 0.557 0.666 0.748
[N/mm] 365.1 115.7 202.5 289.3 365.1
A test specimen geometry of arbitrary thickness (=5mm here) is then selected. To illustrate the approach, a long single edge notched tension (SENT) specimen under fixed grip loading has been chosen to match the SPBMTWC8-2 pipe test. In practice, a number of low constraint test specimen geometries might be considered. Values of limit load, stress intensity factor and in SENT specimens can be found in R6
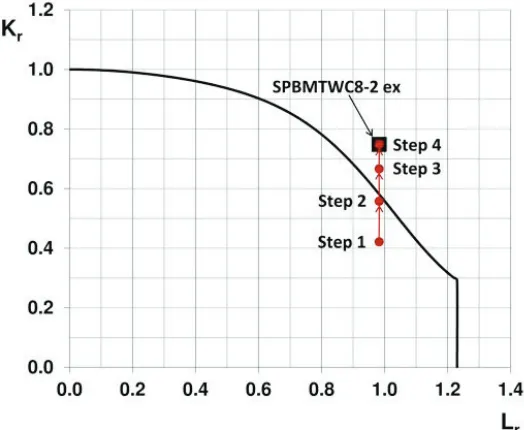
(2013) and depend on a/W; by selecting a/W=0.5375, the value of for the specimen is matched to that of the cracked pipe. The ratio Kr/Lr in the SENT specimen depends not only on a/W but also on absolute size. The next step is to choose W (and hence a, since a/W has already been chosen) for the specimen to match the ratio of Kr/Lr in the component. Table 7 and Figure 5 show how this has been done in four steps to illustrate the effect of specimen size. An initial choice of W=20mm leads to a ratio of Kr/Lr in the SENT specimen which is much lower than that in the pipe, similar to the low ratio shown for TPB specimens in Figure 3. As illustrated in Table 7, increasing W leads to an increase in the ratio of Kr/Lr and choosing W=63.1 mm, a=33.9 mm for the SENT specimen matches the SPBMTWC8-2 pipe test.
Crack initiation using the FAD is predicted to occur when the line with slope Kr/Lr intersects the failure assessment curve. Therefore, if initiation in the specimens and components is accurately predicted by the FAD, i.e. occurs at loads corresponding to points (Kr/Lr ) on the failure assessment curve, then not only will the ratios of Kr/Lr be the same in components and specimens but also the individual values of Kr and Lr will be the same. These individual values are listed in Table 7 along with the initiation toughness corresponding to the value of Kr based on the standard R6 Option 1 failure assessment curve. However, loss of constraint can be described by defining Kr in terms of a fracture toughness from a high constraint specimen but using a failure assessment curve which lies outside the Option 1 curve, as set out by Ainsworth and O’Dowd (1995). If constraint loss is defined in terms of the T-stress, then the modification to the failure assessment curve depends only on Lr, and material parameters. Thus, since
with a higher value of Kr than that based on the Option 1 curve. This higher value of Kr would be expected to correspond to a lower toughness closer to the high constraint toughness in Table 3 than the elevated toughness value in Table 7. There is ongoing work to quantify the material parameters describing the constraint modified failure assessment curve and hence to quantify this.
Table 7 shows that this transferability approach can be successfully applied using a SENT specimen to match pipe test SPBMTWC8-2. The defined SENT specimen width, W, fits within the limits of the pipe cross-section, and it would be possible to cut such a specimen from the pipe wall. However, the approach is limited by the accuracy of the FAD approach, as the failure assessment point at initiation in the component may not exactly lie on the FAD, even allowing for constraint loss.
Figure 5. Illustration of the transferability approach plotting Kr and Lr values from Table 7
CONCLUSIONS
This paper has presented assessments of the loads for ductile fracture initiation in 14 large-scale piping tests; 6 straight pipes and 8 elbows. It has been shown that the use of modern stress intensity factor and limit load solutions, recently presented in the literature, in conjunction with standard failure assessment diagram methods, leads to generally accurate assessments of the loads for ductile crack initiation, with a tendency for some conservatism and greater scatter in elbow tests than in straight pipes under bending.
Applications of constraint based approaches in procedures such as R6 use fracture toughness as a function of constraint level obtained by testing specimens of different geometry and crack size. An alternative approach has also been illustrated whereby it has been shown that by selection of specimen geometry (for example SENT), specimen size, W, and relative crack size, a/W, it is possible in principle to match constraint levels to those in a specific cracked component.
ACKNOWLEDGEMENTS
REFERENCES
Ainsworth, R. A. and O’Dowd, N. P. (1995). “Constraint in the failure assessment diagram approach for fracture assessment”, ASME J Pres Ves Tech 117(3), 260-267.
API 579-1/ ASME FFS-1, Fitness-for-service (2007). American Petroleum Institute/ASME, Washington DC.
An, J-H., Kim, Y-J. and Budden, P. (2010). “Elastic stress intensity factors and crack opening displacements for circumferential through-walled cracked elbows,” Engng Fract Mech 77, 2821-2839.
Bedairi, B., Cronin, D., Hosseini, A. and Plumtree, A. (2012). “Failure prediction for crack-in-corrosion defects in natural gas transmission pipelines,” Int J Pres Ves Piping 96-97, 90-99
BS7910:2013, Guide to methods for assessing the acceptability of flaws in metallic structures (2013). BSi, London.
Chattopadhyay, J., Dutta, B. K. and Kushwaha, H. S. (2000). “Experimental and analytical study of three point bend specimens and throughwall circumferentially cracked straight pipe,” Int J Pres Ves Piping 77, 455-471.
Chattopadhyay, J., Tomar, A. K. S., Dutta, B. K. and Kushwaha, H. S. (2004). “Closed form collapse moment equation of throughwall circumferentially cracked elbows subjected to in-plane bending moment,” ASME J Pres Ves Technology 126, 307-317.
Chattopadhyay, J., Pavan Kumar, T., Dutta, B. K. and Kushwaha, H. S. (2005). “Fracture experiments on through wall cracked elbows under in-plane bending moment: test results and theoretical/numerical analyses,” Engng Fract Mech 72, 1461-1497.
Chattopadhyay, J. and Tomar, A. K. S. (2006). “New plastic collapse moment equations of defect-free and throughwall circumferentially cracked elbows subjected to internal pressure and in-plane bending moment,” Engng Fract Mech 73, 829 – 854.
Chattopadhyay, J., Kushwaha H. S. and Roos, E. (2006). “Some recent developments on integrity assessment of pipes and elbows, Part I: Theoretical investigations.” Int J Solids Structures 43, 2904-2931.
Chattopadhyay, J., Dutta, B. K. and Vaze, K. K. (2014). “Development of new correlations for improved integrity assessment of pipes and pipe bends,” Nucl Engng Design 269, 108-115.
Gintalas, M. and Ainsworth R. A. (2015). “Constraint based assessment of large-scale cracked straight pipes and elbows,”, Proc., ASME 2015 Pressure Vessels & Piping, Boston, USA.
Kim, Y-J., Kim, Y-I. and Song, T-K. (2007). “Finite element plastic loads for circumferential cracked pipe bends under in-plane bending,” Engng Fract Mech 74, 643-668.
Lei, Y. (2011). “Review of Limit Loads Solutions for Defective Pipe Bends,” Report E/REP/BBGB/0060/GEN/09 Revision 000, EDF Energy Nuclear Generation, Gloucester, UK Lei, Y., Li, Y. and Gao, Z. (2014). “Global limit load solutions for thick-walled cylinders with
circumferential cracks under combined internal pressure, axial force and bending moment, Part I: Theoretical solutions,” Int J Pres Ves Piping 114-115, 23-40.
R6: Assessment of the integrity of structures containing defects, Revision 4, including subsequent updates (2013). EDF Energy Generation, Gloucester, UK.
RSE-M Code, In-service Inspection Rules for the Mechanical Components of PWR Nuclear Islands, Appendix 5.4 – Analytical Methods for Calculating Stress Intensity Factors and J Integral (2010). 2010 Edition, AFCEN, Paris.
Zahoor, A. (1985). “Closed form expressions for fracture mechanics analysis of cracked pipes,” ASME J Pres Ves Technology 107, 203-205.