i
Abstract
LOESING, RAINER, Development of High Resolution Depth Profiling Of Ultra Shallow Dopant Implants with SIMS (under the direction of Phillip E. Russell)
Secondary Ion Mass Spectrometry (SIMS) is considered a reliable technique for precise and accurate dopant depth profiling in Si with respect to junction depth and implanted dose. The junction depths of source drain extension structures are predicted to be between 19-33nm for the 0.1µm MOSFET generation. Accurate high depth resolution analysis of these ultra-shallow junctions by SIMS can only be provided if atomic mixing caused by energetic primary ion bombardment is minimized and extensive beam induced crater bottom roughening is avoided. For quantitative measurements, the influence of primary ion implantation, sputter rate changes and beam induced crater bottom roughness on secondary ion intensities has to be known. In this work SIMS was used to develop techniques for the accurate analysis of ultra shallow B, P and As implants in Si.
Low energy O2+ primary ion bombardment was found to give the highest depth
resolution for the analysis of B and P in Si, while low energy Cs+ and CsC6- primary ion
bombardment resulted in the highest depth resolution for the analysis of As in Si. To obtain a more accurate profile shape and depth scale it was found to be essential to limit beam induced crater bottom roughness by means of sample rotation, variations of primary ion angle of incidence or change in sample chamber vacuum conditions. Beam induced crater bottom roughness was investigated for low energy O2+, Cs+ and CsC6- ion
ii sputter rate in the initial stages of a SIMS depth profile. It was shown that dose
measurements of ultra shallow implants can be improved by using a correction procedure based on bulk doped standards. SIMS was proven to be a valuable tool for the
i
DEVELOPMENT OF HIGH RESOLUTION DEPTH PROFILING OF
ULTRA SHALLOW DOPANT IMPLANTS WITH SIMS
by
RAINER LOESING
A dissertation submitted to the Graduate Faculty of
North Carolina State University
in partial fulfillment of the
requirements for the Degree of
Doctor of Philosophy
MATERIALS SCIENCE AND ENGINEERING
Raleigh
2001
ii
Biography
iii
Acknowledgements
I would like to express my sincere gratitude to the following people
• Dr. Dieter Griffis and Dr. Phil Russell, for providing me with this
excellent opportunity; his encouragement, guidance and technical assistance; and for making my graduate school so enjoyable
• Dr. Georgiy Guryanov, Dr. Dale Batchelor and Mr. Roberto Garcia for their encouragement, guidance and technical assistance
• Dr. Jerry Hunter at Accurel, Inc. for his cooperation and support
• Dr. Jean Moran and Intel Corp. for their generously funding of the research
• Shane Phillips, Donovan Leonard and Mike Salmon and everybody at AIF for their support and for making my graduate school experience so enjoyable
• Dr. Frank Stadermann for increasing my interest in surface analytics
• My parents, Klemens and Gertrud, and my sister Birgit and her family for their support
iv
Table Of Contents
List of Symbols, Terms and Acronyms ...ix
List of Figures:...xi
List of Tables:... xvii
1
Introduction and Problem Overview...1
1.1 Dissertation Structure... 1
1.2 Introduction and Motivation ... 1
1.3 References ... 6
2
Secondary Ion Mass Spectrometry (SIMS)...7
2.1 Introduction... 7
2.2 History Of Secondary Ion Mass Spectrometry... 8
2.3 Fundamental Concepts in Secondary Ion Mass Spectrometry Related to High Resolution Depth Profiling ... 11
2.3.1 Ion Solid Interaction... 11
2.3.2 Changes in Surface Topography due to Ion Bombardment ... 15
2.3.3 Instrumental Factors that Influence Depth Resolution in SIMS Depth Profiling ... 17
2.3.4 The Transient Zone ... 17
2.3.5 Secondary Ion Yield Models ... 18
2.3.6 O2 Flooding... 21
2.3.7 Depth Resolution Criteria ... 22
2.4 References ... 23
3
Experimental Method...28
3.1 Introduction... 28
3.2 The CAMECA IMS 6F ... 29
3.2.1 Ion Sources... 29
3.2.1.1 Duoplasmatron... 30
v
3.2.1.3 Peabody PSX-120 Sputter Negative Ion Source... 35
3.2.2 The Sample Rotation Stage ... 36
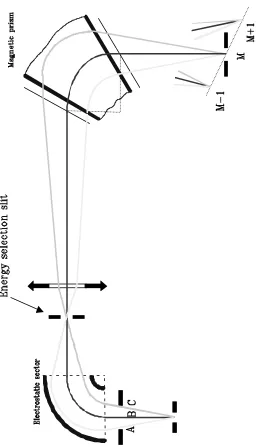
3.2.3 The Mass Spectrometer... 40
3.2.4 Secondary Ion Detection... 42
3.3 Crater Depth and Topography... 46
3.3.1 Stylus Instruments... 47
3.3.2 Atomic Force Microscopy ... 47
3.3.3 Optical Profilometry ... 49
3.4 Samples used in this Study ... 52
3.4.1 Low Energy Dopant Implants... 52
3.4.2 Bulk Doped Standards ... 53
3.4.3 Multiple Delta Doped Structures ... 54
3.5 References ... 55
4
SIMS Depth Profiling of Low Energy B in Si Implants using Low
Energy O
2 +Ion Bombardment using a CAMECA IMS 6F ...58
4.1 Introduction... 58
4.2 Experimental Method... 59
4.3 Results and Discussion ... 61
4.3.1 Crater Bottom Roughness Development and Profile Shifts Produced by Glancing Angle O2+ IonBombardment ... 61
4.3.1.1 Influence of Angle of Incidence on Crater Bottom Roughness Development and Profile Shifts Produced by Glancing Angle O2+ Ion Bombardment... 66
4.3.1.2 Influence of O2 Flooding on Crater Bottom Roughness Development and Profile Shifts Produced by Glancing Angle O2+ Ion Bombardment ... 69
4.3.1.3 Sample Rotation – An Alternative to Reduce Beam Induced Crater Bottom Roughness and Profile Shifts ... 73
4.3.2 Influence of O2 Flooding on Depth Resolution ... 75
vi
4.4 Summary... 80
4.5 References ... 81
5
SIMS Depth Profiling of Low Energy P Implants in Si using Low
Energy O
2 +and Cs
+Ion Bombardment on a CAMECA IMS 6F ...83
5.1 Introduc tion... 83
5.2 Details of Experimental Method ... 84
5.3 Results and Discussion ... 87
5.3.1 Ion Beam Induced Crater Bottom Topography Changes under Low Energy Cs Bombardment ... 87
5.3.2 Artifacts in SIMS Depth Profiles of Ultra Shallow P in Si Profiles under Glancing Angle O2+ Ion Bombardment ... 90
5.3.3 Decay Length of Ultra Shallow P in Si Ion Implants analyzed using Low Energy Cs Beams ... 90
5.3.4 Ion Yield Transients under Cs+ and O2+ Primary Ion Bombardment ... 92
5.3.5 Low Energy O2+ Ion Bombardment as an Alternative to Cs+ for SIMS Depth Profiling of Low Energy P in Si Implants on a CAMECA IMS 6F ... 94
5.4 Summary... 98
5.5 References ... 98
6
Negative Cluster Ion Bombardment: An Alternative for SIMS
Depth Profiling of Low Energy Implants of n-Dopants ...100
6.1 Introduction... 100
6.2 Details of Experimental Method ... 101
6.3 Results and Discussion ... 103
6.3.1 Investigation of Source Target Materials for Sputter Negative Ion Sources with Respect to High Resolution SIMS Depth Profiling of Ultra Shallow N-dopants. ... 103
6.3.2 Ion Beam Induced Crater Bottom Topography Changes and Profile Shift under Molecular Ion Bombardment ... 115
vii 6.3.4 Comparison of SIMS Depth Profiling of Low Energy As Implants in Si
using CsC6- Primary Ions versus O2+ and Cs+ Primary Ion Beams ... 126
6.4 Summary... 128
6.5 References ... 129
7
Comparison of Secondary Ion Mass Spectrometry Depth Profiling
of Low Energy P and As Implants in Si on Magnetic Sector and
Quadrupole Instruments ...132
7.1 Introduction... 132
7.2 Details of Experimental Method ... 133
7.3 Results and Discussion ... 135
7.3.1 Analysis of Ultra Shallow P in Si Implants ... 135
7.3.2 Analysis of Ultra Shallow As in Si Implants ... 138
7.4 Summary... 140
7.5 References ... 140
8
Methods to Improve Analysis Accuracy of Secondary Ion Mass
Spectrometry in the Transient Zone ...142
8.1 Introduction... 142
8.2 Details of Experimental Method ... 145
8.3 Results and Discussion ... 146
8.3.1 Quantification inside the Transient Zone... 146
8.3.2 Depth Calibration in the Transient Zone ... 150
8.3.2.1 OP Evaluation and Comparison of OP with AFM on Experimental Sized Craters ... 150
8.3.2.2 Evaluation of OP for “Real Life” SIMS Crater ... 154
8.3.2.3 Comparison of OP with T-DYN Simulations ... 157
8.4 Summary... 160
8.5 References ... 160
9
Conclusions and Future Work ...162
viii
9.2 Beam induced Crater Bottom Roughness and Profile Shift... 162
9.3 Analysis of Ultra Shallow Dopants using SIMS... 163
9.4 Quantification within the Transient Zone ... 164
9.5 Recommendations for Future Work... 165
9.5.1 Beam Induced Crater Bottom Roughness ... 165
9.5.2 Profile Shifts in SIMS Depth Profiles... 165
ix
List of Symbols, Terms and Acronyms
A = Electron Affinity
AFM = Atomic Force Microscopy ALE = Atomic Layer Epitaxy CVD= Chemical Vapor Deposition Dx,y = Surface Diffusivity Terms
ε = Constant describing ion yield dependence on normal particle escape velocity EF = Fermi Level
EM = Electron Multiplier FC = Faraday Cup
FLIG = FLoating Ion Gun
go = Statistical weight of the atom state
gi = Statistical weight of the ion state
FWHM = Full Width at Half Maximum I = Ionization potential
IMS = Ion MicroScope
ITRS = International Technology Roadmap for Semiconductors LAD = Laser Ablation/Deposition
LVDT = Linear Variable Differential Transducers
λd = Decay length λr = Rise length λ = Ripple wavelength
λ = Wavelength of light
MBE = Molecular Beam Epitaxy
MOSFET = Metal Oxide Semiconductor Field Effect Transistor NA = Numerical Aperture
OP = Optical Profilometry
φ = Sample work function
x ppm = parts per million
ppb = parts per billion Rp = Projected range
R(z) = Resolution function RMS = Root Mean Square RSF = Relative Sensitivity Factor SDE = Source Drain Extension
SEM = Secondary Electron Microscopy SIA = Semiconductor Industry Association SIMS = Secondary Ion Mass Spectrometry
σ = Standard deviation
SRIM = Stopping and Ranges of Ions in Motion
θ = Angle of incidence T = Temperature
TEM = Transmission Electron Micrsocopy TOF = Time Of Flight
ULSI = Ultra Large Scale Integration VLSI = Very Large Scale Integration
νo = Erosion rate
υx,y = Surface tension terms
xi
List of Figures:
Figure 1-1: Schematic of a MOSFET with Source/Drain Extensions ... 2
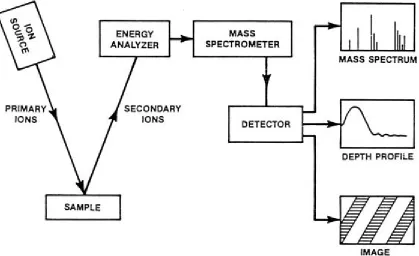
Figure 2-1: SIMS experiment schematic ... 8
Figure 2-2: Collision cascade after primary ion impact and illustration of the large variety of particles that leave the sample (27) ... 13
Figure 2-3: Illustration of curvature dependant sputtering ... 16
Figure 2-4: Illustration of the transient zone in SIMS sputter depth profiling ... 18
Figure 2-5: Illustration of level crossing. Example H+ to H ... 20
Figure 2-6: Illustration of decay length λd(1/e) and λ(decade)... 23
Figure 3-1: Illustration of a duoplasmatron (13)... 30
Figure 3-2: Maximum O2+ primary ion current extracted from a duoplasmatron ion source with and without the Accel/Decel system as a function of extraction high voltage (14) ... 31
Figure 3-3: Schematic of the Accel/Decel system addition to the IMS-6F duoplasmatron (14) ... 32
Figure 3-4: Schematic of a Cs microbeam surface ionization source (16) ... 34
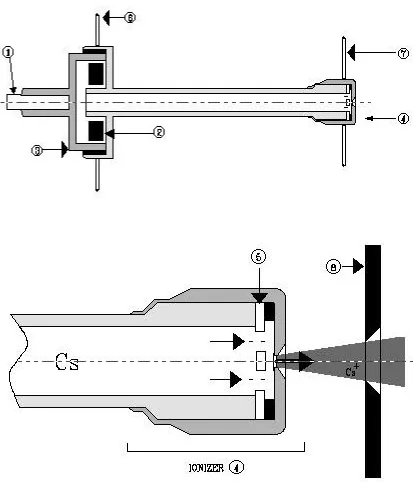
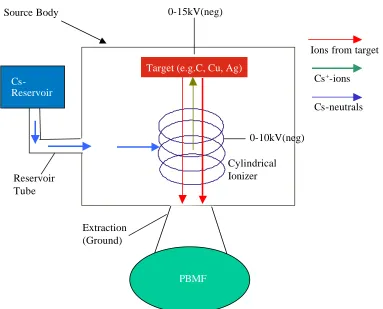
Figure 3-5: Schematic of the working principle of the PSX-120 sputter negative ion source ... 36
Figure 3-6: SIMS depth profile of a Ni/Cr- multi- layer structure with and without sample rotation... 39
Figure 3-7: 5x5um AFM images of the Ni/Cr-Multilayer sputter crater bottom a) Height image, no sample rotation b) Height image, with sample rotation c) Phase image, no sample rotation d) Phase Image, with sample rotation ... 40
Figure 3-8: Mass separation for ions of same energy with different trajectories ... 42
Figure 3-9: Schematic of an electron multiplier post-acceleration system... 45
xii Figure 3-11: Schematic of an Atomic Force Microscope ... 48 Figure 3-12: Illustration of cross coupling in an AFM ... 49 Figure 3-13: Illustration of an Optical Profilometer ... 50 Figure 3-14: Illustration of a MOS Field Effect Transistor and decreasing SDE junction
depth... 52 Figure 3-15: Illustration of a B delta doped structure and a simulation of an ideal SIMS
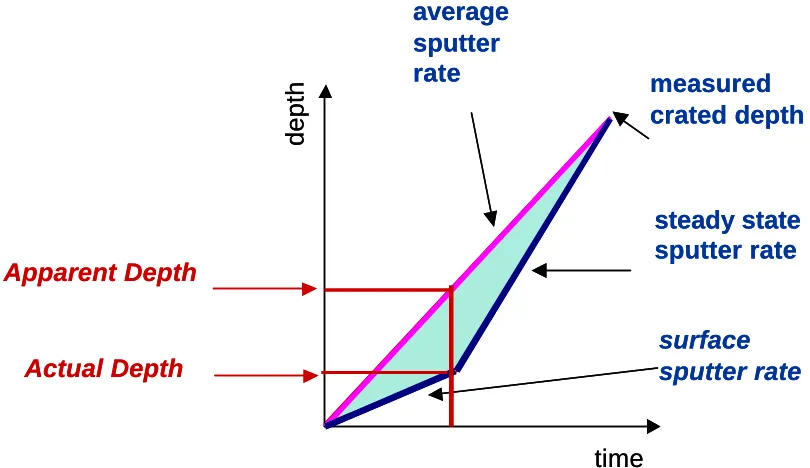
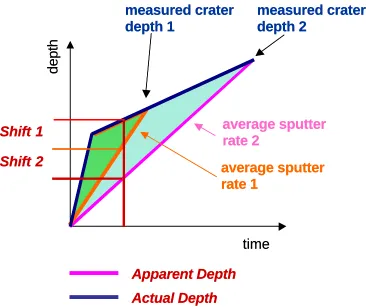
profile of this structure ... 55 Figure 4-1: Difference in actual and apparent profile depth depending on depth
calibration... 62 Figure 4-2: Difference in actual and apparent profile depth depending on depth
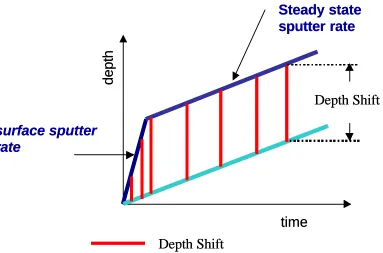
calibration... 63 Figure 4-3: Dependence between actual and apparent depth on final crater depth ... 64 Figure 4-4: Depth shift after applying a steady state sputter rate to the whole
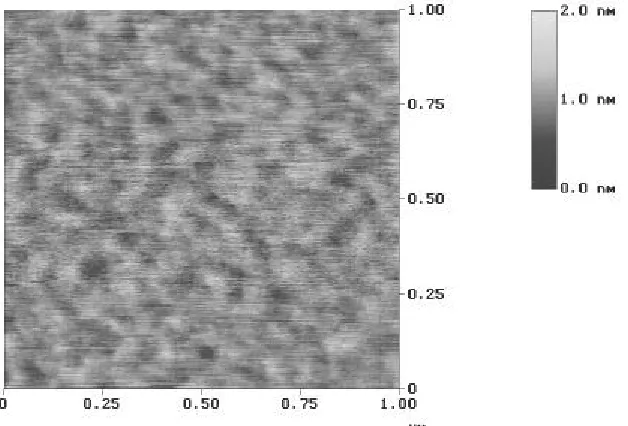
measurement ... 65 Figure 4-5: AFM micrographs of pristine sur faces obtained from a B delta doped Si wafer
... 66 Figure 4-6: 1 x 1 µm AFM micrographs of SIMS crater bottoms after profiling (100) Si
with a 1keV O2+ primary ion beams while using O2 flooding and changing the angle
of incidence from 56 to 50 to 45o... 68 Figure 4-7: Depth profiles obtained from a B delta doped structure with a 1keV, 56o O2+
and 1keV, 45o O2+ primary ion beam with using O2 flooding ... 69
Figure 4-8: 1 x 1 µm AFM micrographs of SIMS crater bottoms after profiling (100) Si with a 1keV, 56o, 1keV, 50o and 500eV, 48o O2+ primary ion beams with and
without using O2 flooding ... 71
Figure 4-9: Depth profiles obtained from a B delta doped structure with a 1keV, 56o O2+
primary ion beam with and without using O2 flooding... 72
xiii Figure 4-11: 1 x 1 µm AFM micrographs of SIMS crater bottoms after profiling (100) Si
with a 1keV, 56o O2+ primary ion beam with and without sample rotation using O2
flooding ... 74 Figure 4-12: Depth profiles obtained from a B delta doped structure with a 1keV, 56o O2+
primary ion beam with and without sample rotation using O2 flooding... 75
Figure 4-13: 500eV, 1E15 atoms/cm2 B implant into (100) Si analyzed with 500eV, 48o and 1keV O2+, 56ounder O2 flooding conditions. Sample rotation was used for the
1keV O2+, 56o to reduce beam induced crater bottom roughness ... 78
Figure 4-14: 300eV, 1E15 atoms/cm2 B implant into (100) Si analyzed with 500eV, 48o and 1keV O2+, 50ounder O2 flooding conditions ... 80
Figure 5-1: 6µm by 6µm SEM micrographs of SIMS craters sputtered with 9.5 (a), 5 (b), 2.5 (c) and 1.6keV (d) total Cs+ primary ion impact energy... 88 Figure 5-2: 20µm by 20µm AFM topography image (height scale = 20nm) of SIMS
craters sputtered with 2.5keV, 24o Cs+ primary ion impact energy... 89 Figure 5-3: Sputter crater RMS roughness vs. Cs+ primary ion impact energy... 89 Figure 5-4: Depth profiles obtained from a a) 2keV, 4E14 atoms/cm2 and b) a 1keV, 1.1
E14 P implant into (100) Si analyzed with Cs+ primary ion beams with impact energies between 7.0 and 1.6keV... 91 Figure 5-5: Depth profiles obtained from a 1keV, 1.1 E14 P implant into (100) Si
analyzed with a 2.5keV Cs+ primary ion beam with and without sample rotation... 92 Figure 5-6: Transient zone as measured by the part where 30Si secondary ion intensity
reaches 90% for different Cs+ impact energies ... 94 Figure 5-7: a) P depth profiles of a 1keV, 1.1E14 atoms/cm3 P implant into (100) Si
obtained with 1keV, 50o and 500eV, 47o O2+ primary ion beams under the use of O2
flooding ... 95 Figure 5-8: a) P depth profiles of a 1keV, 1.1E14 atoms/cm3 P implant into (100) Si
obtained with 500eV, 47o O2+ (+ox. flood) and 2.5keV, 24o Cs+... 97
xiv Figure 6-2: Mass spectra of primary ions obtained from a Cs2SO4/C source sputter target
that was bombarded by a 4.8keV Cs+ ion beam within the PSX-120 sputter negative ion source obtained by sweeping the primary beam mass filter ... 106 Figure 6-3: Mass spectra of primary ions obtained from a Si source sputter target that was
bombarded by a 4.8keV Cs+ ion beam within the PSX-120 sputter negative ion source obtained by sweeping the primary beam mass filter ... 108 Figure 6-4: Mass spectra obtained by sweeping the primary beam mass filter from a
graphite rod source sputter target that was bombarded by a 4.8keV Cs+ ion beam within the PSX-120 sputter negative ion source ... 109 Figure 6-5: Primary ion current as a function of primary ion mass with low and high
primary ion mass resolution... 110 Figure 6-6: Maximum C2- current extracted from the PSX-120 negative sputter ion source
versus target impact energy... 111 Figure 6-7: Si- secondary ion matrix signals acquired during 3.9keV, 50o CsC6- depth
profiling of (100) Si wafers as a measure for CsC6- primary ion current stability . 112
Figure 6-8: Image of a graphite sputter target after approximately 12 hrs of 4.8keV Cs+ ion bombardment inside the PSX-120 sputter negative ion source ... 113 Figure 6-9: Images taken from PSX-120 extraction electrode a) after cleaning and b) after three days of source operation with low extraction energies... 115 Figure 6-10: AFM micrographs of (100) after CsC6 sputtering over a range of energies
and angles: a) unsputtered, RMS = 0.15nm; b) 3.8keV, 410, RMS = 0.16nm; c) 2.9keV, 480, RMS-0.59nm; d) 2.3keV, 550, RMS = 1.21nm; e) 2.6keV, 420 RMS = 0.44nm; f)1.75keV, 470, RMS = 1.41nm ... 117 Figure 6-11: Ripple wavelength as a function of a) total carbon impact energy and b)
effective carbon impact energy. Both impact energies are calculated according to the mass fraction of carbon atoms in the CsC6- primary cluster ion. ... 119
xv Figure 6-13: AFM images and associated Fourier transformations of crater bottoms with
depth between 3 and 5nm created with a) 3.8keV 41o, b) 2.9keV 48o and c) 2.55keV 52o CsC6- primary ion bombardment ... 122
Figure 6-14: a) P depth profiles of a 1keV, 1.1E14 atoms/cm3 into (100) Si obtained with 500eV, 47o and 1keV, 50o O2+ (+ox. flood), 2.5keV, 24o Cs+ and 2.9keV, 48d CsC6
-(+ox. flood and sample rotation)... 126 Figure 6-15: As depth profiles of a 500eV, 1E15 atoms/cm3 into (100) Si obtained with
1keV, 50o O2+ (+ox. flood), 2.5keV, 24o Cs+ and 2.9keV, 48d CsC6- (+ sample
rotation) ... 128 Figure 7-1: SIMS depth profiling of a 500eV, 1E15 atoms/cm2 P implant into (100) Si. a)
Comparison of profiles obtained using 3keV, 24o Cs+, 500eV, 47o O2+ and 2.9keV
CsC6- on a CAMECA IMS 6F, with profiles obtained us ing 500eV, 60o Cs+ and
250eV, 0o O2+ on an ATOMIKA 4500 b) Profiles obtained using 500eV, 47o O2+ on
a CAMECA IMS 6Fand 250eV, 0o O2+ on an ATOMIKA 4500 ... 136
Figure 7-2: SIMS depth profiling of a 500eV, 1E15 atoms/cm2 P implant into (100) Si. Comparison of profiles obtained using 500eV, 47o O2+ on a CAMECA IMS 6F, with
profiles obtained using 500eV, 47o O2+ and 500eV, 60oO2+ on an ATOMIKA 4500
... 138 Figure 7-3: SIMS depth profiling of a 500eV, 1E15 atoms/cm2 As implant into
preamorphized (100) Si. Comparison of profiles obtained using 3keV, 24o Cs+, 1keV, 50o O2+ and 2.9keV CsC6- on a CAMECA IMS 6F, with profiles obtained
using 500eV, 60o Cs+ and 500, 0o O2+ on an ATOMIKA 4500... 139
Figure 8-1: Si- and P- ion yield transients, P-/Si- ratio and normalized correction factor for a 2.9keV CsC6- primary ion beam impacting on a P bulk doped Si wafer ... 147
Figure 8-2: Si- and P- ion yield transient, P-/Si- ratio and normalized correction factor for a 3.0keV Cs+ primary ion beam impacting on a P bulk doped Si wafer... 148 Figure 8-3: SIMS depth profiles of a 1keV, 1.1E14 atoms/cm2 P implant into (100) Si
analyzed a) with 2.9keV CsC6- and b) 3keV Cs+ before and after applying bulk
xvi Figure 8-4: AFM and OP topographical micrographs of crater edges after 1.4 E16
atoms/cm3, 3keV Cs sputtering illustrating the data provided by these respective instruments (X, Y and Z axes are all in nm) ... 151 Figure 8-5: AFM and OP sputtered depth measured from crater lip to crater bottom.... 153 Figure 8-6: Change in sputter rate with dose as measured using AFM and OP for 3keV,
24o Cs+ primary ion bombardment ... 154 Figure 8-7: Crater depth obtained using OP from SIMS craters after 5E14 to 1E17
atoms/cm2 3keV, 24o Cs+ ion bombardment... 156 Figure 8-8: Difference between depth as determined by OP and applying a constant
sputter rate for calibration. A fourth order polynomial approximation is shown for the Cs dose range of 5E14 and 5E16 atoms/cm2 ... 156 Figure 8-9: Instantaneous sputter rates determined from OP data and T-DYN simulations
as a function of Cs+ primary ion dose (left y-scale). Depth as measured by OP is shown as a function of Cs+ primary ion dose for comparison (right y-scale)... 159 Figure 8-10: SIMS depth profiles obtained from 14.5 and 3.0keV, 1E17 atoms/cm2 Cs+
xvii
List of Tables:
Table 3-1: Samples used in this study... 53
Table 4-1: Experimental conditions used for B analysis in this work ... 59
Table 4-2: Experimental conditions (see section 4.1 for complete description of conditions)... 77
Table 5-1: Experimental conditions used for P analysis in this chapter ... 85
Table 5-2: Primary ion beam conditions and decay length for a 1 and 2keV P implant into (100) Si... 91
Table 5-3: Primary ion beam cond itions and transient zone width ... 93
Table 5-4: Transient zone width and decay length (1/e) for 1keV, 50o and 500eV, 47o O2+ ion bombardment under the use of O2 flooding and 2.5keV Cs+, 24o ion bombardment ... 97
Table 6-1: Experimental conditions with energies in kV (keV) ... 103
Table 6-2: Examples for high boiling point organic compounds ... 114
Table 6-3: Experimental conditions with energies in keV... 116
Table 6-4: Ripple wavelength and RMS roughness values for listed impact energies and angles ... 119
Table 6-5: Transient zone width, decay length (1/e), detection limits, useful and sputter yields for 1keV, 50o and 500eV, 47o O2+ under the use of O2 flooding, 2.5keV Cs+, 24o and 2.9keV, 48o CsC6- ion bombardment ... 125
Table 7-1: Experimental conditions used for P and As analysis in this chapter ... 134
1
1 Introduction and Problem Overview
1.1 Dissertation Structure
Chapter one covers the motivation for this work and the context in which it was performed. Chapter two describes the history of secondary ion mass spectrometry and the fundamentals of the SIMS technique focusing on various aspects of high depth
resolution depth profiling of ultra shallow features using SIMS. Chapter three focuses on the details of the experimental methods used in this work. Chapter four discusses details of depth scale and impurity distribution accuracy when using low energy O2+ ion
bombardment for ultra shallow analysis of B in Si. Chapter five examines some
alternatives for analysis of ultra shallow P ion implants in Si with SIMS using low energy Cs+ and O2+ primary ion beams. Chapter six introduces a different approach for ultra
shallow P analysis with SIMS employing negative cluster ions for the primary ion analysis beam. Chapter seven compares the adva ntages and disadvantages of magnetic sector and quadrupole type SIMS instruments with respect to the analysis of ultra shallow n-dopants. The chapter eight describes a method for improving depth scale calibration and correcting procedures for ion yield changes in the transient zone during SIMS depth profiling. Then conclusions and future work are given in chapter nine.
1.2 Introduction and Motivation
2 Figure 1-1: Schematic of a MOSFET with Source/Drain Extensions
Most commonly formation of p/n junctions in state of the art MOSFET devices is achieved using ion implantation. Ion implantation allows excellent control of the amount of dopant introduced into the sample and the depth over which the dopant is distributed and hence junction depths. Sputter depth profiling in combination with Secondary Ion Mass Spectrometry (SIMS) has been shown to provide accurate and reproducible analysis for high and medium energy ion implants with respect to implanted dose, junction depth and profile shape. Dose measurement precision, a value describing the repeatability of SIMS measurements, of better than 1 percent is obtainable (3). Dose measurement accuracy, a statement which describes how closely a measured value represents an actual value, is achieved by measuring a standard with a well characterized dose under the same analytical conditions as the unknown specimen and applying the dose calibration to the measurement. In general at least one substrate (matrix) signal is measured together with the dopant signal as a function of time throughout the SIMS depth measurement. The ratio of dopant to matrix signal is then converted to dopant concentration by applying a Relative Sensitivity factor (RSF) (4), obtained from the calibration standard. The time axis of the depth profile is converted into a depth scale by applying a constant sputter rate obtained from final crater depth measurements. Since the peaks for high and medium energy ion implants are well below the surface, changes in the initial part of the depth profiling process have only a limited influence on dose measurement and depth calibration for these implants.
Sidewall spacer
3 The accuracy and precision provided by SIMS for high and medium energy ion implants will also be required for ultra shallow implants to allow reliable production (requires precision) and further development of device theory and modeling for
improvement of device design (requires accuracy) of future MOSFET generations. State of the art SIMS depth profiling can not provide measurements of ultra shallow junction implants that are not compromised by ion beam induced mixing, and by changes in secondary ion yield and sputter rate during the depth profile. Sputter rate and secondary ion yield changes occur in a complicated and not well understood way due to
implantation of primary ions into the sample and removal of surface layers, which
complicates quantification. These changes are most prominent in the top few nanometers of the sample. The region over which sputter and ion yield changes occur is called transient zone.
With the peak concentration of ultra shallow implants lying in the immediate vicinity of the surface, accurate quantification is more difficult compared to deeper ion implants. Ion yield and sputter rate changes can be reduced, but not eliminated, by using e.g. lower primary beam impact energies or flooding the sample surface with O2. It is
essential that methods are developed which enable quantification in the near surface (transient) region of a SIMS depth profile to achieve the same dose accuracy for low energy ion implants that can be achieved for medium and high energy ion implants. Existing correction as well as newly developed models are applied in this work to improve quantification accuracy of ultra shallow ion implants.
4 ion range and therefore atomic mixing are to increase the primary ion angle of incidence, to minimize normal impact energies or to use cluster ions with each atom in the cluster carrying an energy according to the mass fraction of the ion in the cluster (8)(9). Beam induced crater bottom roughness can be reduced by rotating the sample (10)(11)(12), which results in an improved depth resolution and a more constant sputter rate throughout the profile and hence a more accurate depth scale.
In this work special emphasis will be given to the dopants phosphorus (P) and arsenic (As). As has a lower diffusivity in Si compared to P and hence will be the likely choice for ultra shallow junction formation (13). However, the semiconductor industry is also interested in shallow P analysis, since due to the overall reduction in device
dimensions shallow P analysis will become important. SIMS is also used to measure unintentional dopant cross contamination by P produced during ion- implantation. This measurement requires accurate concentration determination, with the depth of the cross contaminant typically being less than the depth of the intentionally implanted species.
Characterization of P and As dopant profiles by SIMS requires high mass resolution (M/∆M~4000) to eliminate mass interferences between 30SiH and 31P and between 29Si30Si16O and 75As. Consequently SIMS depth profiling of P and As is
essentially limited to magnetic sector or Time Of Flight (TOF) SIMS instruments, which have the capabilities to resolve these mass interferences (14). Exceptions are applications where P and/or As are of sufficient high concentration so that quadrupole instruments can be used effectively or samples are pumped down in UHV for extended periods (around 10 hours or over night) to reduce the respective mass interferences mentioned above. However, while interference separation is important, minimization of transient zone width, beam induced crater bottom roughness and atomic mixing are at equally important for measuring P or As secondary ion intensity with high accuracy during a depth profile.
5 energy primary ion bombardment is one of the most important parameters for high depth resolution profiling, the possibilities and limitations of using Cs+ ion bombardment for the analysis of P with the CAMECA IMS 6F are investigated.
O2+ primary ions and positive secondary ion extraction provide an alternative for
analysis of P with SIMS. The positive sample bias used to extract the positive secondary ions repels positive primary ions, which reduces their total impact energy. The impact angle of positive primary ions onto the positively biased sample is increased as a result of the repelling sample potential, which reduces normal primary ion impact energies and atomic mixing and hence should improve depth resolution as stated above. This possible gain in depth resolution using O2+ and positive secondary ion extraction instead of Cs+
and nega tive ion extraction is not often utilized for the analysis of P with SIMS, because the positive ion yield of P under O2+ ion bombardment is about one order of magnitude
lower compared to the negative ion yield of P under Cs+ bombardment. The increased levels of dopant concentration in ultra shallow junction formation to reduce depletion layer width may make O2+ ion bombardment a more feasible alternative to Cs+
bombardment for high depth resolution measurements. The use of Cs+ and O2+
bombardment is compared for the analysis of P with the CAMECA IMS 6F. The effect of glancing angle O2+ bombardment on beam induced crater bottom roughness and its
influence on depth resolution was investigated using a B delta doped structure. The use of B instead of P doped samples is possible, since due to the low dopant concentration results are assumed to be independent of dopant type and should apply to all investigated dopants.
As described above, Cs+ and negative secondary ion extraction gives the lowest detection limits for P and As, while sample potentials which repel the incoming primary ions as in the case of O2+ primary ions and positive secondary extraction can give better
6 appears to be CsC6-. CsC6- is used in this work for depth profiling of P and As in Si and
compared with depth profiling of P and As in Si using O2+ and Cs+ primary ion beams.
1.3 References
1. International Technology Roadmap for Semiconductors, SIA (1999) 2. S.B. Felch et al. J. Vac. Sci. Technol. B14 (1), 336 (1996)
3. B.W. Schueler and D.F. Reich, proceedings of the 6th International Workshop on Ultra Shallow Junctions, Napa, CA, USA (2001)
4. A. Benninghoven, F.G. Rüdenauer, H. W. Werner, in Secondary Ion Mass Spectrometry, John Wiley and Sons, (1987)
5. M. Dowsett, in Proceedings of SIMS XI, eds. G.Gillen, R. Lareau, J. Bennett and F. Stevie, John Wiley and Sons, New York, 259, (1998)
6. Z.X. Jiang and P.F.A. Alkemade, Appl. Phys. Lett., 73, 315 (1998)
7. P.A. Ronsheim and R.J. Murphy, USJ-99, Research Triangle Park, NC, USA, Proceedings, 126 (1999)
8. G. Gillen et al., in SIMSXII proceedings, eds. A. Benninghoven, P.Bertrand, H.N. Migeon and H.W. Werner, Elsevier, Amsterdam, 279 (2000)
9. R. Loesing, G.M. Guryanov, M. S. Phillips and D.P. Griffis, submitted to J. Vac. Sci. Technol. (2001)
10. J.G.M. van Berkum, in SIMSXII proceedings, eds. A. Benninghoven, P.Bertrand, H.N. Migeon and H.W. Werner, Elsevier, Amsterdam, 55 (2000)
11. R. Loesing, M. Schumacher, G. M. Guryanov, and D. P .Griffis, in SIMSXII
proceedings, eds. A. Benninghoven, P.Bertrand, H.N. Migeon and H.W. Werner, Elsevier, Amsterdam, 581 (2000)
12. F.A. Stevie, J.L. Moore, S.M. Merchant, C.A. Bollinger, and E.A. Dein, J. Vac. Sci. Technol. A 12, 2363 (1994)
13. S. M. Sze, VLSI Technology, McGraw-Hill, New York, 287 (1988)
14. J. C. Vickerman, A. Brown and N. M. Reed, in Secondary Ion Mass Spectrometry, Oxford University Press, Oxford, 101, (1989)
7
2 Secondary Ion Mass Spectrometry (SIMS)
2.1 Introduction
In the last two decades the analytical demand for high elemental sensitivities down to parts per million (ppm) and parts per billion (ppb) as a function of depth has
significantly increased. SIMS has developed during the last 30 years into a major technique that can provide this information for the surface analysis of solids (and
sometimes liquids) (1). In SIMS a surface is bombarded with energetic particles, usually ions. Momentum is transferred to the atoms in the sample via a serious of binary
collisions between the primary particle and sample atoms as well as solely between sample atoms. This is often described as a collision cascade. Some of the sample atoms that are set in motion during the collision cascade follow trajectories that reach the surface of the sample. Atoms that arrive at the surface with an energy that exceeds the surface binding energy can leave the sample and a fraction of these atoms are ionized. The theoretical description of ionization is complicated due to the simultaneous
8 Figure 2-1: SIMS experiment schematic
2.2 History Of Secondary Ion Mass Spectrometry
The development of Secondary Ion Mass Spectrometry began in 1910, when Sir Joseph Thomson observed and identified the emission of positive secondary ions when he bombarded a metal surface with primary ions in a discharge tube (2). Woodcock
recorded the first spectrum of negative secondary ions twenty-one years later in 1931 when he bombarded NaF and CaF2 with 500eV Li+ ions. In 1949 Vieböck under the
supervision of Herzog constructed a SIMS instrument that used electric fields to accelerate primary ions to the sample and an electric field parabola spectrograph to separate the secondary ions and record a secondary ion mass spectra from metal oxides (3,4).
9 to stigmatically extract secondary ions and to project a magnified secondary ion image onto a fluorescent screen, thus producing the first ion microscope. This instrument was able to achieve a spatial resolution of about 1 µm. A commercial version of this
instrument was developed by Rouberol et al. at CAMECA instruments and commercially introduced in 1968 as the IMS-300 (7). The IMS-300 used a retarding field electrode for energy separation and a magnetic prism for mass separation. At about the same time (1967) Liebl developed an ion microprobe that used a finely focused ion beam rastered over a surface to erode the surface and produce a chemical map of the sample (8). This instrument, which was able to achieve a spatial resolution of 1 µm, was made
commercially available in 1967 as the Ion Microprobe Mass Analyzer (IMMA) by Applied Research Laboratories. In the early 1980’s the obtainable lateral resolution on ion microprobe type instruments was vastly improved by the introduction of liquid metal ion sources that operate by field ionization of metals from a sharp tip (9). Lateral
resolution of 20nm and below can now be obtained using liquid metal ion sources (10). In 1975 Wittmaack developed the first secondary ion mass spectrometer with mass separation based on a quadrupole (11). The ATOMIKA differential in-depth analyzer (ADIDA), based on the design by Wittmaack, was commercially introduced in 1976 by ATOMIKA GmbH of Germany(12,13,14).
10 In 1977 CAMECA introduced IMS 3f as a replacement of the IMS 300. Design changes from the IMS 300 included the incorporation of a transfer optical system that improved the matching of the ion optics to the size of the analyzed area. In the IMS-3F, the double pass spectrometer was also replaced with a double focusing mass
spectrometer. In a double focusing mass spectrometer an electrostatic sector and a magnetic sector are utilized in serial arrangement, so that the chromatic aberrations of each sector cancel each other and the mass dispersive properties of the magnetic sector are retained (17). This arrangement provides mass resolution over a range from 300 to 10000 M/∆M (18). The next generation in what became now the CAMECA F-series was introduced by H.N. Migeon of CAMECA in 1985 as the IMS-4F. While based on a design similar to that of the IMS 3-F, capabilities such as a normal incidence electron gun and scanning ion image capability were added (19). The IMS-4F was replaced with the IMS-5F in 1991 (20). Improvements introduced on the 5F included digital control of the instrument, continuously adjustable sample potential from –5kV to +5kV to allow more flexibility in impact energy, a newly designed thermal ionization ion source for a Cs+ microprobe (21) and improvements in the vacuum system to allow analysis of gaseous species with improved sensitivity. The next generation in the CAMECA F-series was introduced in 1996 as the CAMECA IMS-6F. In the IMS-6F, the magnet for secondary ion mass separation was replaced by a laminated magnet. The use of a laminated magnet reduced hysteresis which dramatically reduces the time necessary to switch between masses, especially at high mass resolution. Rapid mass switching capability reduces mass switching time which increases the amount of secondary ion acquisition time improving secondary ion sensitivity and/or depth resolution. Later improvements for the IMS-6F include a post acceleration system which enhances the conversion efficiency of the electron multiplier detector for low impact energies, a rotating stage which minimizes beam induced crater bottom roughness and a system for the duoplasmatron ion source of the instrument which allows low voltage primary ion extraction from the source with higher efficiency.
11 at high energy before deceleration of the primary ions near the sample, allowing impact energies as low as 150eV (24). With the increasing need for analyses of more and more shallow features, interest in dopant depth profiling with Time-O f-Flight (TOF) type instruments, which were traditionally only used for static SIMS, has increased. In 1998, Niehuus of ION-TOF developed a TOF instrument which uses two primary ion beams for depth profiling, one beam for rapid removal of material and a short-pulsed beam for the creation of secondary ions (25).
2.3 Fundamental Concepts in Secondary Ion Mass Spectrometry Related to High Resolution Depth Profiling
There are three major factors that determine the attainable depth resolution using SIMS. These factors are ion beam mixing, surface roughness, which can be either initial (prior to SIMS analysis) or primary ion beam induced surface roughness and
instrumentation related factors. Other described phenomena are the transient zone (the initial part of a sputter depth profile where removal rates and ionization efficiencies change), ion yield models which describe the theoretical treatment of ionization of sputtered particles and oxygen flooding of the sample surface, which is a method to increase ion yields and reduce transient zone width.
2.3.1 Ion Solid Interaction
12 for the primary recoil to describe a trajectory of a certain length in the target. These primary recoils will set other target atoms in motion (secondary recoils) as long as their transferable energies exceed a certain threshold value that is for most elements in the order of 20eV (26). The vast majority of the higher order recoil atoms have lost the directional character dedicated by momentum conversation of the first one. The
13 Figure 2-2: Collision cascade after primary ion impact and illustration of the large variety of particles that leave the sample (27)
14 position and direction. Only nuclear collisions are assumed to be able to cause changes in direction of primary ions or target atoms that were set into motion, while between collisions particles are assumed to fly in a straight path. Ions lose discrete amounts of energy in nuclear collisions and lose energy continuously due to electronic losses. Nuclear and electronic energy losses are assumed to be independent. To calculate energy losses and angular deflections due to nuclear scattering the program uses the universal ZBL (Ziegler, Biersack, Lindhard) interatomic potential derived from solid state electron distributions (28). Electron stopping at low velocities, which are important for SIMS, are calculated based on the formalism of Lindhard and Scharff (29). In SRIM simulation the path of the ion ends either when the ion leaves the sample or when its energy drops below that necessary to displace target atoms. Because an amorphous target is assumed, no crystallinity affects are taken into account and thus neither directional effects on sputtering rates nor channeling are simulated.
In addition to cascade mixing, primary ion implantation introduces defects in the crystalline material. These defects can cause radiation enhanced segregation of
impurities in the target. Radiation-enhanced segregation is a non-equilibrium process, since ion bombardment causes the defect concentration in the material to greatly exceed its equilibrium concentration. The increase in defect concentration also leads to a greatly enhanced diffusion in ion bombarded materials, as the diffusion coefficient is
15
2.3.2 Changes in Surface Topography due to Ion Bombardment
The initial physical characteristics of the sample to be analyzed can strongly influence obtainable depth resolution. The best depth resolution can only be achieved if the sample has a perfectly flat surface. Dust particles that act as local erosion masks and/or scratches in the sample surface lead to unacceptable distortions in SIMS depth profiles, but proper sample handling and/or cleaning can be used to avoid this problem. For dopant and impurity depth profiling of Si wafer having surfaces with a surface roughness of 0.lnm RMS and where minimum surface contamination is readily achievable, depth resolution is often not limited by the initial surface characteristics. However, in SIMS depth profiling, depth resolution can still be severely compromised by the formation of sputter induced surface topography.
Ion bombardment of a sample can form commonly known lattice imperfections like Frenkel and Schottky defects (33), dislocations (34) or defect cluster formation (35). If the damage introduced by ion bombardment exceeds a certain damage threshold, amorphization of crystalline samples occurs. For ion bombardment with fluencies of >1E16 ions/cm2, many types of surface features have been observed, like cones, etch pits, facets, grain boundaries, cell structures, ripples or an increase in random roughness. Impurities with lower sputter yields compared to the surrounding matrix are often the reason behind cone formation, with the same often being true for grain boundaries. Facets are usually seen after eroding a poly crystalline sample resulting from the different sputter rate of different crystallographic planes.
16 PL P PR
OL O OR
Figure 2-3: Illustration of curvature dependant sputtering
It can be seen that the energy deposited at point O by beams impacting at O, OL and OR is
lower than the energy contributed by beams impacting at P, PL and PR to the total energy
deposited at point P.
Bradley and Harper also postulated that ripple formation competes with surface diffusion and that this interplay generates ripples with wavelength in the order of
λ =√(D/υ)
, where D is the surface diffusivity and a term describing the negative surface tension. To test Bradley and Harpers theory, McLaren bombarded GaAs with 17keV Cs+ in the temperature range from –50 to 200o C (38). When decreasing the temperature from 200 to 55oC he observed the reduction in ripple wavelength according to the theory, with a ripple wavelength proportional to the square root of the diffusion constant. At 55oC the ripple wavelength stabilized, giving indication to a temperature independent, ion induced, surface diffusion constant. Temperature independent surface diffusion due to ion
bombardment was termed effective surface diffusion. Based on angular dependant sputtering, curvature depending sputtering and surface diffusion terms, Makeev and Barabasi (39) derived the equation of motion of a single valued height function h(x,y,t) measured from an initial flat surface which lies in the x,y plane:
Equation 1 4 4 4 4 2 2 2 2 2 2 ) ( 2 ) ( 2 y h D x h D y h x h y h x h x h v t h I y I x y x y x o ∂ ∂ − ∂ ∂ − ∂ ∂ + ∂ ∂ + ∂ ∂ + ∂ ∂ + ∂ ∂ + − = ∂ ∂ γ λ λ υ υ . The first term (νo) is the erosion rate, the second term (γ(δh/δx)) is for the
17 represent slope depending sputtering, υx and υy are constant for surface tension terms
induced by curvature dependent sputtering and terms for the effective surface diffusion. Using the computer code COSIPO and a simplified model for surface diffusion based on the premise that atom jumps are irreversible and that atoms will jump to posit ions which will provide them with the maximum number of bonds to nearest neighbors, Koponen et al. (40) successfully simulated the formation of ripples for ion bombardment of amorphous carbon with 5keV Ar+ primary ions at angles of incidence of 30o and 60o. The ability to simulate ripple formation supports the theoretical derived view of ripple formation and demonstrates a general improved understanding of ripple formation.
2.3.3 Instrumental Factors that Influence Depth Resolution in SIMS Depth Profiling
Ion sources commonly used in SIMS often produce other ion species in addition to the species to be used for depth profiling. Without mass filtering of these additional primary ions, simultaneous sputtering with different primary ions would occur. These ions would generally have different composition, primary ion range and/or momentum, which would lead to an increase in depth over which surface composition, and hence sputter and ion yield, changes occur compared to single species sputtering. This means a primary ion mass filter is a prerequisite for reliable analysis. Also proper focusing and rastering of the primary ion beam is necessary to get a reproducible flat crater bottom and avoid erosion inhomogeneity. Erosion inhomogeneity results in a decrease in depth resolution with depth (∆z∝z) and can be the dominant factor controlling depth resolution. Erosion inhomogeneity can be significantly reduced by sample rotation.
2.3.4 The Transient Zone
18 changes in sputter rate and ion yield result from primary ion implantation, changes in sample composition from the surface layers to the bulk or contamination of the sample. The width of the transient zone is often taken to be the point at which the secondary ion intensity of the matrix element has reached 90% of its steady state value.
SIMS-Signal Concentration
of 28Si in Si
Conc. [atoms/cm
3
]
Int. [
cts
/sec.]
depth Native Oxide ~ 1.7nm
Transient Zone
~0.5-10nm SIMS
depth/time
Figure 2-4: Illustration of the transient zone in SIMS sputter depth profiling
Since the rate of change of the sputter rate and ion yields in the transient region is currently unpredictable, quantification of impurity concentrations in the transient region is impossible. Unfortunately, with the lower ion implant energies used to form ultra-shallow junctions by ion implantation, a large amount of the total implant dose comes to rest within the transient zone, making it necessary to develop and apply correction models to allow quantification within this zone. An effort will be made to develop a correction method, which will allow quantitative impurity analysis.
2.3.5 Secondary Ion Yield Models
A particle sputtered from the surface has a certain probability to be in an ionized state and leave the sample as a secondary ion. The ratio of secondary ions of a given element to the total number of sputtered particles of the same element is called secondary ion yield. Secondary ion yields largely determine the minimum concentration with which an element can be detected.
19 required for amorphizatio n depends on the mass and energy of the primary ion and the composition of the sample (41), (42). Even at the initial stages of ion bombardment the material is largely disturbed at the point of ion impact. Therefore, with respect to the effect of the material structure on ion yield, it seems more appropriate to not consider the electronic band structure of the material, but rather to consider the material as being amorphous with continuous energy states. There are essentially two models that discuss ionization probabilities in SIMS, the perturbation or electron-tunneling model and the bond-breaking model. Both of these models will be discussed below.
In the perturbatio n model (43), (44), ionization probability is believed to be highest close to the surface. However, neutralization probability is also high close to the surface and thus escape probability of the atom in the ionized state is low. As an ion moves further away from the surface, the coupling between ion and the surface becomes weaker and escape probability increases. However, if the sputtered atom or molecule is not already ionized, ionization probability also decreases. Thus at a distance a few Ångstroms away from the surface a point exists where the probability of ion escape is at maximum. Following this reasoning, the ionization probabilities can be shown to be proportional to:
P+∝ exp [- (I-φ)/ε] P-∝ exp [- (φ-A)/ε]
where P+ and P- are positive and negative ionization probabilities, I is the ionization potential, A is the electron affinity, φ is the work function of the material and ε0 =
hγν/Cπ, with h being Planck’s constant, γ is a characteristic constant of approximately 2Å-1, v is the velocity of the leaving ion and C being a constant.
20 reducing the work function of the material which can be for example achieved for a Si matrix via Cs implantation (47).
In contrast to the tunneling model which deals primarily with metal and semiconductor surfaces, the bond-breaking model (48) deals specifically with ion emission from ionic surfaces. If an element is already in an ionic state at the surface, the probability of the occurrence of a secondary ion depends simply on the probability of the atom or molecule remaining in a state that is more to an energetically fa vorable to the ionic state versus that of the neutral state as it moves away from the surface. Ionization probability will depend on the position at which the ionic and neutral potential energy curves cross. Figure 2-5 illustrates level crossing. The position of the crossing point is influenced by the ground state energies of the associated species, the difference between ionization potential and electron affinities of the positive and negative ions and the range over which electrostatic interaction occurs. If the ionic and neutral potential energy curves do not cross, a very high ionization probability results.
separation from surface E
H+ (ion) + e
-H (neutral)
point of level crossing
separation from surface E
H+ (ion) + e
-H (neutral)
point of level crossing
Figure 2-5: Illustration of level crossing. Example H+ to H
Other ionization models are the molecular model which is based on the
21 includes direct desorption of preformed positive and negative ions as well as fast
ion/molecule reactions, electron ionization and molecular dissociation (50).
2.3.6 O2 Flooding
Extensive reports detailing effects of O2 flooding during SIMS depth profiling of
Si have been published (51) (52). O2 flooding in combination with O2+ primary ion
bombardment is a method frequently used in SIMS to increase sensitivity, reduce transient zone width and eliminate or reduce the matrix effects in multi- layer analysis (53). O2 flooding results in stochiometric SiO2 at the surface similar to the SiO2 surface
layer formed by near normal O2+ ion bombardment often used in quadrupole SIMS in
which case full oxidation occurs without O2 flooding (54).
In ultra shallow depth profiling, the reduction in transient zone width with the use of O2 flooding is especially important since a large fraction of the depth from which
impurity information is desired is located in the top few nanometers of the sample. A reduction in transient zone will allow more accurate quantification in ultra shallow SIMS depth profiling.
The description of the effects of O2 flooding on depth resolution in SIMS depth
profiling varies. Both improvement (55) and degradation (56) of depth resolution has been found when O2 flooding is used. Improvement in depth resolution is likely to be
related to increased target swelling associated due to the additional O uptake resulting in a decrease in effective Si matrix mixing and/or a smoothening of the surface.
Degradation in depth resolution may be connected with an increase in beam induced crater bottom roughness which occurs under certain bombardment conditions or from segregation of analyzed elements away from the O rich surface into the O depleted bulk or into the SiOx/Si interface. A detailed study investigating the effect of O2 flooding on
22 Si (57). Some elements such as Mg or Be, which have a higher oxide heat of formations compared to Si, segregate into the oxide which results in a decrease in decay length or apparent but erroneous improvement in depth resolution.
For ma ny species the positive ion yield shows a roughly 10-fold increase when O2
flooding was used during the depth profiling Si with O2+ primary ion beams (58). A
higher enhancement in positive ion yield is seen for species with a high electronegativity, like As or P. When measuring the increase in positive ion yield as a function of oxygen surface concentration it is seen that most of the increase in positive ion yield occurs when the O surface concentrations is higher than 64%(59). It is assumed that at this oxygen surface concentration the SiO2 band gap starts to form, which reduces neutralization of
ions leaving the sample in accordance with the electron tunneling ion yield model described in chapter 2.3.5. An increase in sensitivity is essential for the measurement of ultra-shallow junctions in SIMS, since detection limits are reduced for high resolution depth profiling due to lower primary ion impact energies which reduces the amount of secondary ions produced per time interval and voltages which results in decreased secondary ion collection efficiency due to reduced secondary ion extraction.
2.3.7 Depth Resolution Criteria
23 signal drop over 1/e on an exponentially decaying slope, e.g. the trailing edge of an implant. While decay length (1/e) is sometimes quoted as depth resolution, it gives an overoptimistic view of true depth resolution, i.e. distinguishability (60). To resolve sharp features, their spacing has to be larger than 3λd (61) or approximately the signal drop over
one decade, λd(decade). Figure 2-6 illustrates the decay length concept for λd(1/e) and λd(decade).
1E+18 1E+19 1E+20
0 5 10 15 20 25 30
depth [nm]
conc. [ats/cm3]
Figure 2-6: Illustration of decay length λλd(1/e) and λλ(decade)
2.4 References
1. Workshop on Ultra Shallow Depth Profiling, in SIMS XII proceedings,
eds. A. Benninghoven, P.Bertrand, H.N. Migeon and H.W. Werner, Elsevier, Amsterdam, 257 (2000)
2. J.J. Thomson, Phil. Mag., 20, 252, (1910)
1E20
1E20 * (1/e) ~ 3.8E19
⇒λd(1/e)
1E20 * (1/10) = 1E19
24 3. R.E. Hönig, in Secondary Ion Mass Spectrometry, SIMS V, Springer Series in
Chemical Physics, Vol.44, ed. A.Benninghoven et al., p. 2, Springer Verlag, Berlin, (1986)
4. R.F.K Herzog,. and F.P. Vieböck, Phys. Rev., 76, 855L, (1949) 5. R. Castaing and G. Slozdian, J. Mircos. 1, 395 (1962)
6. R. Castaing and G. Slozdian, C. R. Acad. Sci. (Paris), 255, 1893 (1962)
7. Rouberol, J.M. et al., in Proc. Fifth Int. Conf. on X-Ray Optics and Microanalysis, Springer Verlag, Berlin, (1969)
8. H. Liebl, J. Appl. Phys. 38, 5277 (1967)
9. F.G. Rüdenauer, et al., in Secondary Ion Mass Spectrometry III, ed. A. Benninghoven et al., Springer Verlag, Berlin, 43 (1982)
10. R. Levi-Setti, Y.L. Wang, G. Crow, J. Phys., Paris, C9-147 (1984) 11. K. Wittmaack, Rev. Sci. Instruments., 47, 157 (1976)
12. K. Wittmaack in Advances in Mass Spectrometry 7A, edited by N.R. Daly, HeydenandSons, London, 758 (1978)
13. K. Wittmaack, in Proceedings of the 8th International Conference on X-Ray Optics and Microanalysis, Boston, 1977, edited by D. Beaman, R.Ogilvie, and D. Wittry. Pendell, Midland, MI, 311 (1980
14. K. Wittmaack, M.G. Dowsett and J.B. Clegg, Int. J. Mass Spectrom. Ion Phys. 43, 31 (1982)
15. A. Benninghoven, Z. Physik, 230, 403 (1970)
16. J. C. Vickerman, A. Brown and N. M. Reed, in Secondary Ion Mass Spectrometry, Oxford University Press, Oxford, 187, (1989)
17. J. C. Vickerman, A. Brown and N. M. Reed, in Secondary Ion Mass Spectrometry, Oxford University Press, Oxford, 97, (1989)
18. J.M. Rouberol, in Proc. Eight Int. Congress X-Ray Optics and Microanalysis, ed. D.R. Beaman et al., Pendell Pub. Co., Midland, (1980)
19. H.N. Migeon, C. Le Pipec, J.J. Le Goux, in Proceeding of SIMS V, Springer Verlag, 1985
25 21. G. Slodzian, B. Daigne, F. Girard, F. Boust, F. Hillion, in Proceeding of SIMS VIII,
eds. A Benninghoven et al, Wiley and Sons, 227, 1991
22. M.G. Dowsett, N.S. Smith, R. Bridgeland, C. Richards, A.C. Lovejoy and P. Pedrick, in SIMS X proceedings, John Wiley and Sons, 367 (1996)
23. J.L. Maul and S.B. Patel, in Proceedings of SIMS XI, eds. G.Gillen, R. Lareau, J. Bennett and F. Stevie, John Wiley and Sons, New York, 707, 1998 24. S.B. Patel and J.L. Maul, in Proceedings of the 5th Workshop on Ultra Shallow
Junctions,Research Triangle Park, NC, 212 (1999)
25. E. Niehuis, T. Heller, C. Bendel and J. Zehnpfenning, in Proceedings of SIMS XI, eds. G.Gillen, R. Lareau, J. Bennett and F. Stevie, John Wiley and Sons, New York, 779, 1998
26. H. H. Andersen, Appl. Physics 18, 131 (1979) 27. CAMECA IMS 6F user manual, 5 (1995)
28. J.F. Ziegler, J.P. Biersack and U. Littmark, in The Stopping and Range of Ions in Solids, Pergamon Press, NY (1985)
29. J. Lindhard, M. Scharff and H. Schiott, Mat. Fys. Medd. Dan. Vid. Selsk., 33, 1 (1963)
30. F. Family and T. Vicsek, J. Appl. Phys. A 18, L75 (1985)
31. P. Wynblatt, R.C. Ku, in Interfacial Segregation, ed. By W.C. Johnson, J.M. Blaekly, Amer. Soc. Metals, Metals Park, Ohio, 115, 1979
32. H.Gnaser, in Low-Energy Ion Irradiation of Solid Surfaces, Springer Verlag, Berlin, 105 (1999)
33. G.H. Kinchin, R.S. Pease, Rep. Prog. Phys, 18, 1 (1955) 34. N. Hermanne, Radiat. Eff., 19, 161 (1973)
35. R.S. Nelson and D.J. Mazey, Radiat. Eff., 18, 127 (1972)
36. R.M. Bradley and J.M.E Harper, J. Vac. Sci. Technol, A6, 2390 (1988) 37. R. Cuerno and A.L. Barabasi, Phys. Rev. Lett., 74, 4746 (1995)
38. S.W. MacLaren, J.E. Baker, N.L. Finnegan and C.M. Loxton, J. Vac. Sci. Technol, A10, 468 (1992)
26 41. J. B. Clegg and I. G. Gale, Surf. Interface Anal. 17, 190 (1991)
42. M. Meuris, P. De Bisschop, J.F. Leclair and W. Vandervorst, Surf. Int. Anal., 14, 739 (1989)
43. J. W. Mayer, L.Eriksson and J. A. Davie, in Ion Implantation in Semiconductors, Academic Press, 96 (1970)
44. A. Benninghoven, F.G. Rüdenauer, H. W. Werner, in Secondary Ion Mass Spectrometry, John Wiley and Sons, (1987)
45. J.K. Norskov and B.I. Lundquist, Phys. Rev. B19, 5661 (1979) 46. P. Williams, App. Surf. Sci, 13, 241 (1982)
47. M.L. Yu and N.D. Lang, Phys. Rev. Let., 50, 127 (1983) 48. M.L. Yu and N.D. Lang, Nuc. Inst. Meth, B14, 403 (1986) 49. M.L. Yu and N.D. Lang, Phys. Rev. Let., 40, 574 (1978) 50. P. Williams, App. Surf. Sci, 13, 241 (1982
51. W. Gerhard and C.Plog, Z. Phys. B, 54, 59 (1983)
52. W.H. Gries and F.G. Rüdenauer, Int. J. Mass Spectrom. Ion Phys., 53, 111 (1983) 53. C. Tian and W. Vandervorst, J. Vac. Sci. Technol. A15 (3), 452 (1997)
54. K. Wittmaack and S.F. Corcoran, J. Vac. Sci. Technol, B16, 272 (1998)
55. A.Wilson, F.Stevie and C.Magee, in Secondary Ion Mass Spectrometry, John Wiley and Sons, New York, (1989)
56. R. Loesing, G.M. Guryanov, M. S. Phillips and D.P. Griffis, submitted to J. Vac. Sci. Technol.
57. M. Meuris, P. De Bisschop, J.F. Leclair and W. Vandervorst, Surf. Int. Anal., 14, 739 (1989)
58. P. C. Zalm and C. J. Vriezema, Nucl. Inst. and Methods in Physics Research B64, 626 (1992)
59. C.J. Vriezema and P.C. Zalm, Surf. Interface Anal. 17, 875 (1991)
60. J. W. Erickson and R. Brigham, J. Vac. Sci. Technol. B14 (1), 353 (1996)
61. T. Janssens and W. Vandervorst, in SIMS XII proceedings, eds. A. Benninghoven, P.Bertrand, H.N. Migeon and H.W. Werner, Elsevier, Amsterdam, 581 (2000) 62. M. Dowsett, in Proceeding of SIMS X, eds. A. Benninghoven et al., John Wiley and
27 63. M. Dowsett, in Proceedings of SIMS XI, eds. G.Gillen, R. Lareau, J. Bennett and
28
3 Experimental Method
3.1 Introduction
Secondary Ion Mass Spectrometry is considered the most reliable technique for accurately analyzing dopant profiles with respect to junction depth and implanted dose. In each new transistor generation junction depth is reduced. Source drain extension structures are predicted to have a junction depth of 11-19nm by 2011 (1)(2). Accurate analysis of these ultra-shallow junctions by SIMS can only be provided if atomic mixing caused by energetic primary ion bombardment is minimized, and if extensive beam induced crater bottom roughening can be avoided. Lower primary ion energy and higher angle of incidence reduces atomic mixing. In addition, changes in sputter rate and ion yields in the transient zone, the initial part of the depth profile where ion and sputter yields are changing must be sufficiently understood. The CAMECA IMS 6F is a state of the art magnetic sector SIMS, a type of SIMS especially suited for analyses which require the combination of high depth resolution with high mass resolution. Recent development of the instrument improves its capabilities for high depth resolution analysis. High depth resolution analysis requires the minimization of surface topography development under primary ion beam bombardment. The nanometer scale changes in surface roughness that occur during ion bombardment can be investigated using AFM. While AFM can be used to analyze shallow sputter crater depths, optical and stylus depth profilometry are more suitable for investigating the relatively large craters (>(150µm)2) usually produced in SIMS. Samples used in this work were selected to allow the investigation of
29
3.2 The CAMECA IMS 6F
3.2.1 Ion Sources
In the most common configuration, a CAMECA IMS 6f is equipped with two ion sources: a duoplasmatron plasma ionization source and a Cs surface ionization source. In most cases O2+ primary ion ions are extracted from the duoplasmatron for the analysis of
electropositive elements. In this case positive secondary ions are extracted from the sample which in magnetic sector SIMS requires a positive sample potential. The positive sample potential repels the incoming positive O2+ primary ions, which results in a more
glancing angle of incidence. A more glancing angle of incidence results in lower penetration depth of the primary ions, a condition that is favorable for high depth resolution analysis (3)(4)
Cs+ ion bombardment results in higher negative ion yields for elements that have a high electronegativity (5). In magnetic sector SIMS, the sample is negatively biased for extraction of negative secondary ions, which accelerates the positive primary ions
towards the surface and result in impact energies higher than the initial primary ion beam energy. Since lowest Cs primary ion energy is 1.5keV and lowest practical sample potential is –1.0keV, resulting in a minimum Cs impact energy of 2.5keV, the possibilities for high depth resolution analysis using Cs+ and negative secondary ion extraction are limited (6).
If negative primary ions are used instead of the positive Cs+ for negative secondary ion detection, the negative sample potential repels the primary ions, which reduces primary ion impact energies. The use of sputter negative ion sources, described in detail in chapter 3.2.1.3, for production of negative primary ions is well documented in accelerator physics (7)(8)(9)(10)(11). Peabody Scientific has developed a sputter
30
3.2.1.1 Duoplasmatron
The first duoplasmatron ion source was developed by v.Ardenne in 1956 as a compact ion beam source which delivered high brightness and good beam quality at moderate cost (12). Gas is introduced into the source at a low pressure through a hollow cathode. The anode is kept at a potential difference of several hundred volts with respect to the cathode and a plasma is formed by an arc going from the cathode to the anode. A conical intermediate electrode, which is connected to the anode via a resistor, helps in creating and maintaining the ion discharge plasma. The plasma is densified close to the anode by an axial magnetic field produced by a coil between the intermediate electrode and the anode forming two plasma regions of different densities. The plasma extends through the anode due to pressure differences between the plasma region and the outside of the gun. Positive and negative ions can be extracted from the duoplasmatron
depending on the polarity of the voltage applied on the anode. The most common ions extracted are O2+ and O- when using O2 as a source gas and Ar+ when using Ar as a
source gas. An illustration of a duoplasmatron is shown in Figure 3-1 (13).
31 Ion extraction from a duoplasmatron is very efficient for high extraction
potentials (>10keV). For lower extraction voltages, primary ion current extracted from the source decreases sharply as shown in Figure 3-2 (14). The low primary ion currents obtained using low extraction voltages make analysis using O2+ primary ions with
primary beam energies below 3keV and impact energies below 1keV unfeasible. However, analysis of ultra shallow ion implants with SIMS requires lower impact energies. To allow SIMS depth profiling with O2+ primary ions with impact energies as
low as 500eV on the IMS-6F, CAMECA introduced a modification to the duoplasmatron ion extraction system, the Accel/Decel system. Maximum O2+ current extracted from a
duoplasmatron with and without Accel/Decel system as a function of extraction high voltage is shown in Figure 3-2. In this system primary ions are extracted from the source using high potentials before they are decelerated to the desired primary ion beam energy as shown in Figure 3-3. An additional lens was added between the duoplasmatron and the primary beam magnetic sector (PBMS) to further increase extraction efficiency.
0 5 10
DP_HV (kV)
0 1000 2000 3000
Ip_max (nA)
Maximum intensity = f(Duoplasmatron extraction voltage)
Accel_Decel Standard IMS 6f L4 aperture = 400 µm
1 2 3
0 200 400 600
32
A c c e l e r a t i o n _ H V D u o _ H V
S a m p l e _ H V I m p a c t e n e r g y
E x t r a c t i o n _ H V
Duoplasmatron AccelerationDeceleration Focusing
Primary
Beam Mass
Filter
A c c e l e r a t i o n _ H V D u o _ H V
S a m p l e _ H V I m p a c t e n e r g y
E x t r a c t i o n _ H V
Duoplasmatron AccelerationDeceleration Focusing
Primary Beam Mass Filter Primary Beam Mass Filter Primary Beam Mass Filter Primary Beam Mass Filter
Figure 3-3: Schematic of the Accel/Decel system addition to the IMS-6F duoplasmatron (14)
3.2.1.2 Cs Surface Ionization Source
While in the IMS 6-F a duoplasmatron is used for the production of O2+ primary
ion beams, as described in the previous section, a surface ionization source is used for the production of Cs+ primary ion beams. Surface ionization, first considered by Langmuir and Kingdon (15), describes the ionization pf atoms when they come in contact with a hot metal surface. If the residence time of the atom on the hot metal surface is long enough so that it can reach thermal equilibrium with the surface, the ionization probability is described by the Langmuir-Saha equation
1 / ) ( 0
)
1
(
+
− −=
e I kTi
i
e
g
g
P
φ (1)where go and gi are the statistical weight of atom and ion states, I is the ionization
33 A schematic of the micro beam Cs surface ionization source used in the CAMECA IMS 6F (16) is shown in Figure 3-4. Cesium chromate (Cs2CrO4) or Cesium Carbonate
(Cs2CO3) is heated up to approximately 400oC (Cs2CrO4) or 150oC (Cs2CO3) andCs