WANG, YIZHUANG. Development of the Framework of Performance-Engineered Mixture Design for Asphalt Concrete. (Under the direction of Dr. Y. Richard Kim and Dr. Shane Underwood).
Mixture design is the starting point of the asphalt production line. A low-quality mix
design will directly result in pavements with poor performance. The goal of the mixture design
has always been finding the optimum combination of the given components to yield asphalt
pavements with good performance and long duration. However, due to the limitations in
mechanical modeling and technologies in the past, the state-of-the-practice mix design is still an
empirical method based on the control of volumetric properties. Since the late 1990s, researchers
and pavement engineers have been seeking for design methods that can explicitly relate the
candidate designs to pavement performance.
In order to develop the design method that can find the “true” performance-optimum
design, this research starts with developing mechanistic models for fatigue performance
prediction. The Simplified ViscoElastic Continuum Damage (S-VECD) model is a mechanical
model describing the change in material constitutive relationship as fatigue damage evolves. It
can predict the material behavior with damage at different modes of loading and loading
conditions. However, a failure criterion is needed to indicate the occurrence of macro-cracking. This research developed a failure criterion called the “DR” failure criterion based on the pseudo
strain energy theory. It has been found that the average loss of material integrity up to failure is a
constant for an asphalt mixture. It is a material property that can be used to predict the macro
failure with given pseudo strain loading history. Compared with the old failure criterion, using
VECD model is used to predict pavement fatigue damage in structural analyses.
The new failure criterion is implemented in two aspects. On one hand, a fatigue index
parameter has been developed using the S-VECD model and the DR failure criterion. The index is designated as “Sapp”. It considers the effects of the material stiffness and toughness on the
fatigue resistance. Higher Sapp values indicate greater fatigue resistance. The parameter was
developed using 105 asphalt mixtures including different types of asphalt mixtures. The results
of the evaluation on asphalt mixture fatigue resistance were consistent with field observation and
engineers’ judgements. Threshold values of Sapp have been proposed for mixtures designed for
different traffic volumes. On the other hand, as opposed to develop the material-level
performance index, the developed failure criterion has been implemented in the structural analysis. The pavement structural performance analysis program FlexPAVE™ is used in this
study. The program analyzes the pavement responses using viscoelastic material properties and
apply the S-VECD model in fatigue damage analysis. The DR failure criterion has been
implemented in the structural analysis to determine the failure of the nodes in the finite-element
mesh. An improvement in the prediction results has been observed after the implementation.
Besides, a transfer function has been developed to convert the predicted fatigue damage within
the asphalt-layer cross-section to the amount fatigue cracking on the pavement surface.
In this study, the performance-volumetric relationship (PVR) has been developed. The
PVR function allows the users to correlate the changes in the volumetric properties in an asphalt
mixture to the changes in its performance, i.e., fatigue damage and rut depth. This function
becomes the key component of the proposed predictive Performance-Engineered Mix Design
© Copyright 2019 by Yizhuang Wang
Development of the Framework of Performance-Engineered Mixture Design for Asphalt Concrete
by Yizhuang Wang
A dissertation submitted to the Graduate Faculty of North Carolina State University
in partial fulfillment of the requirements for the degree of
Doctor of Philosophy
Civil Engineering
Raleigh, North Carolina
2019
APPROVED BY:
_______________________________ ______________________________
Y. Richard Kim Shane Underwood
Co-chair of Advisory Committee Co-chair of Advisory Committee
ii
DEDICATION
To my parents, Tiejun Wang and Chunwei Fu, for their endless unconditional love and
iii
BIOGRAPHY
Yizhuang David Wang was born as the only child in the family in August 1989 in
Harbin, China. He spent his first 22 years in Harbin, a northeastern city with a population of 10
million. He attended High School Attached to Harbin Normal University and graduated with
honors in June 2008. In August 2008, he enrolled at Harbin Institute of Technology, one of the
top engineering schools in China. During his undergraduate years, David was involved in
research in transportation structures and materials under the direction of Dr. Yiqiu Tan and Dr.
Zejiao Dong. In 2012, he graduated from college with GPA ranking the first in his major and
was offered the opportunity to become a master student in HIT. He chose to come to North
Carolina State University to continue his study under the direction of Dr. Richard Kim.
Following the gradation from Master of Science, David continued his research in Dr. Kim’s
group as a Ph.D. Student. During his Ph.D. study, he learned the fundamentals of mechanics in
asphalt research and had the chance to conduct research with different topics, such as modeling
of asphalt fatigue, rutting, pavement structure analysis, pavement management, and asphalt
mixture design. While working on the development of performance-related specifications with
the Federal Highway Administration and providing technical supports to local state agencies, he
gained experiences in working in industry and learned how to coordinate research with
industry’s expectation, and he has built great relationships with state agencies. This document
iv
ACKNOWLEDGMENTS
First of all, I would like to acknowledge the colleagues that I first knew when I came to
NCSU. They are Dr. Luis Alberto Nascimento, Dr. Jongsub “Jay” Lee, Dr. Andrew Lacroix, Dr.
Amirhossein “Hossein” Norouzi, Dr. Mohammad Sabouri, Dr. Seyed Amirshayan Safavizadeh,
Dr. Yeongtae “Yeong” Choi, Dr. Hong-Joon Park, Dr. Wei Cao, Jing Jin, Dr. Dahae Kim, Dr.
Andrew Wargo, Dr. Morteza Ashouri, Dr. Seonghwan Cho, Dr. Jeong Hyuk “JK” Im, Dr. Javon
Adams, and Dr. Mohammad Ilias. At that time, I was the youngest in the group and had little
experience in researching and living in the United States. During my first two years in the group,
they made great impact on me. I was impressed by the way they conducted their research as well
as the details and the quality of their work. It was those senior students who passed the great
culture of this research group to me. There were so many moments, such as the initial training
from Luis and Hossein, the demonstrations of the modeling theories, the many times of
discussions and the trouble shootings, that are like movies vividly playing in my mind.
I would also like to acknowledge Dr. Jongsub Lee, Dr. Luis Alberto Nascimento, Dr.
Amirhossein Norouzi, Dr. Dahae Kim, Dr. Andrew Wargo, Dr. Behrooz Keshavarzi, Amir
Ghanbari, and Jaehoon Jeong. We worked together on one or more research projects closely. I
want to thank them for being kind, patient, productive, professional, and knowledgeable.
I also want to mention Sonja Pape, Kangjin “Caleb” Lee, Dr. Farinaz Safaei, Dr. Michael
Elwardany, Dr. Farhad Yousefi Rad, Dr. Haritha Malladi, Dr. Abhilash Kusam, Mary Rawls, and
Elizabeth Braswell with my gratitude. I appreciate the friendship built from working together and
sharing office and labs for many years. I also extend my thanks to my current and former
v Gulzar, Narges Matini, Boris Goenaga, Mukesh Ravichandran, Kazuo Kuchiishi, Ern-Yeong
"Ernie" Song, and many others, who are working very hard and being very supportive.
I would like to acknowledge Dr. Luis Alberto Nascimento, Dr. Jongsub “Jay” Lee, Dr.
Amirhossein “Hossein” Norouzi, Dr. Mohammad Sabouri, Dr. Behrooz Keshavarzi, Amir
Ghanbari, Jaehoon Jeong, Sonja Pape, Kangjin “Caleb” Lee, Nooralhuda Saleh, Douglas
Mocelin, Dr. Andrew Lacroix, Dr. Yeongtae “Yeong” Choi, Dr. Wei Cao, and Dr. Dahae Kim
for sharing their precious research data with me. Those data played important roles in my
research. I give my special thanks to them for their selflessness and their hard work. Meanwhile,
I am proud of the great culture in the research group.
Last but not least, I want to give my heartfelt gratitude to my advisory committee from
the bottom of my heart. Dr. Cassie Castorena and I attended our very first group meeting
together on August the 1st, 2012. Since then, she became my advisor (though not written on the Plan of Work) and mentor. I cannot even describe how much I have learned from those many
hour-long conversations and how much they have helped me. She is a young model about my
age, a friend, and a mentor guiding my professional development on the right path. I also want to
thank Dr. Murthy Guddati. I appreciate the trust he has on me. Working with him has been an
opportunity to learn the state-of-the-art knowledge in mechanics. To become as knowledgeable
in mechanics as him has always been a goal to me. Dr. Shane Underwood was a legend to me.
He left North Carolina probably a few days before I arrived, and we never met until at one TRB
conference years later. When I came to NC State, there were the labs he helped to build and
stories told by everyone. I remembered I asked him one question via email during the first year
of my Master program. The quick response and the follow-up email full of well-explained details
vi different world to me. Learning from the way he thinks and proceeds in his research, the way he
defends his work, and the way he communicates with other specialists has made me grow
extensively. Finally, I would like to specially thank Dr. Kim. He has been an advisor and a father
for me. Of many things that I want to thank him for, the first part is the trust he had on me. It
was the trust that gave me the freedom and the power to fight to become a better researcher and a
better person. It was also the trust that brought back the confidence when I even lost the trust on
myself. The name “David” was given by him. This one simple word has become an important
landmark in my career and in my life. There are so many aspects I want to thank him for: the
great opportunity to work on the Performance-Related Specification research project, the many
things I have learned from him that have become part of myself, and his many other excellent
vii
TABLE OF CONTENTS
LIST OF TABLES ... xi
LIST OF FIGURES ... xii
Chapter 1. Introduction ... 1
1.1. Research Needs ... 1
1.2. Scope and Objectives ... 2
1.3. Dissertation Outline ... 2
Chapter 2. Literature Reivew ... 5
2.1. Introduction ... 5
2.2. History of Mix Design ... 5
2.2.1. Early Mix Design Method ... 5
2.2.2. The Hveem Mix Design Method ... 6
2.2.3. The Marshall Mix Design Method ... 7
2.3. The Superpave Mix Design ... 7
2.4. Volumetric Parameters and other typical parameters ... 10
2.4.1. Volumetric Parameters... 11
2.4.2. Film thickness ... 17
2.4.3. Ndes and Compaction Effort ... 19
2.4.4. Dust-to-binder Ratio and Permeability ... 20
2.4.5. Gradation... 20
2.5. Balanced Mix Design ... 21
2.5.1. Definition of BMD ... 21
2.5.2. Performance-related Tests Commonly Used in BMD ... 25
2.5.3. Case study ... 28
2.6. Summary ... 31
Chapter 3. Development of A Pseudo Strain Energy-Based Fatigue Failure Criterion For Asphalt Mixtures ... 32
3.1. Introduction and Literature Review ... 32
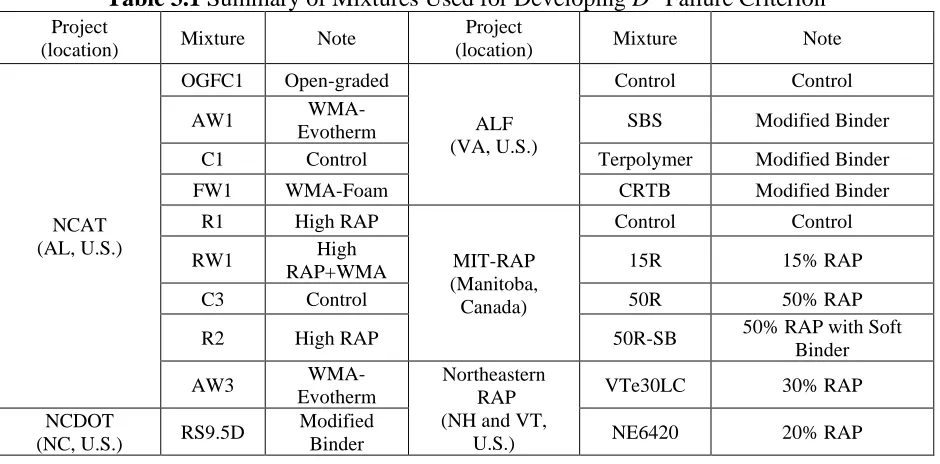
3.2. Materials and Test Methods ... 36
3.3. Development of Failure Criterion ... 38
3.3.1. Development of Failure Criterion ... 38
3.3.2. GR Failure Criterion ... 43
3.3.3. The Proposed DR Failure Criterion ... 45
viii
3.4.1. Test Results and Discussion... 49
3.4.2. Statistical Analysis of Test Results ... 53
3.5. Summary ... 58
Chapter 4. Development of A Fatigue Index Parameter for Asphalt Concrete Based on Viscoelastic Continuum Damage Theory ... 60
4.1. Introduction ... 60
4.2. Theoretical Background ... 62
4.3. Materials ... 64
4.4. Test Methods ... 65
4.4.1. Dynamic Modulus Testing ... 65
4.4.2. Direct Tension Cyclic Fatigue Testing ... 66
4.5. Derivation of Sapp Using S-VECD Theory... 67
4.5.1. Identifying Important Factors for Modelling Fatigue Damage... 67
4.5.2. Proposing the index parameter... 71
4.6. Effects of Mixture Factors on Sapp ... 79
4.6.1. Effects of RAP content, binder content, and binder grade ... 79
4.6.2. Effects of using different types of mixtures ... 82
4.6.3. Effects of aggregate gradation, binder content, and air voids ... 83
4.6.4. Effects of oven aging on mixtures ... 85
4.7. Limited Field Verification ... 86
4.8. Suggested Sapp Thresholds for Traffic Levels ... 88
4.9. Summary ... 92
Chapter 5. Fatigue Performance Predictions of Asphalt Pavements Using FlexPAVETM With The S-VECD Model and DR Failure Criterion ... 93
5.1. Introduction ... 93
5.2. Materials and Pavements ... 95
5.3. Models and Failure Criteria ... 96
5.3.1. The S-VECD Model ... 96
5.3.2. The GR Failure Criterion ... 97
5.3.3. The DR Failure Criterion ... 98
5.3.4. FlexPAVE™ ... 100
5.4. Comparison of Predicted Fatigue Damage Results Using the Two Tailure Criteria ... 102
5.5. Simulation Results and Discussion criterion. ... 104
5.5.1. Federal Highway Administration Accelerated Loading Facility Pavements ... 104
ix
5.5.3. KEC Test Road ... 111
5.5.4. Binzhou Perpetual Pavements... 112
5.6. Summary ... 113
Chapter 6. Development of Preliminary Transfer Functions For Performance Predictions In FlexPAVE™ ... 115
6.1. Introduction ... 115
6.2. Performance Predictions Using FlexPAVE™ ... 117
6.3. Field Sections ... 120
6.3.1. KEC Test Road ... 120
6.3.2. NCAT Test Track ... 122
6.3.3. MIT-RAP Test Road ... 123
6.3.4. MnROAD Test Road ... 124
6.3.5. Quantification of Distress in the Field ... 124
6.4. Development of Fatigue Transfer Function for FlexPAVE™ ... 125
6.5. Development of Rutting Transfer Function for FlexPAVE™ ... 130
6.6. Summary ... 132
6.7. Future Work ... 132
Chapter 7. Development of The Performance-Volumetric Relationship For Asphalt Mixtures 133 7.1. Introduction ... 133
7.2. Understanding Volumetric Properties of Asphalt Mixtures ... 136
7.3. Mechanistic Models for Performance Characterization ... 140
7.3.1. Mechanistic Models for the Material Level ... 140
7.3.2. Performance Predictions for Asphalt Pavement Structures ... 141
7.4. Experimental Design and Test Results ... 143
7.4.1. SM12.5 Mixture ... 144
7.4.2. RS9.5B Mixture ... 147
7.4.3. Shadow Mixture ... 148
7.5. Development of Performance-Volumetric Relationship Function ... 149
7.5.1. Response Surface Model... 150
7.5.2. Characterization of Performance-Volumetric Surface ... 156
7.6. Summary and Future Work ... 161
Chapter 8. Development of Framework of The Predictive Performance-Engineered Mix Design Procedure for Asphalt Mixtures ... 164
8.1. Introduction ... 164
x
8.3. Background ... 167
8.3.1. Mechanistic Models and Test methods ... 167
8.3.2. Performance-Volumetric Relationship ... 169
8.4. Testing Materials ... 172
8.4.1. North Carolina RS9.5B Mixture ... 172
8.4.2. Virginia SM12.5 ... 173
8.4.3. North Carolina RI19C Mixture ... 174
8.5. Performance-Engineered Mixture Design Procedure and Results ... 175
8.5.1. Material Selection ... 175
8.5.2. Design Gradations and Generate the Design Volumetric Space ... 176
8.5.3. Performance Test and Calibrating PVR Function ... 182
8.5.4. Determine the Pavement Life at Different Volumetric Conditions ... 187
8.5.5. Determine the Candidate Design ... 192
8.5.6. Check the Volumetric Properties and Moisture Susceptibility ... 195
8.6. Summary ... 196
Chapter 9. Conclusions ... 198
REFERENCES ... 202
xi
LIST OF TABLES
Table 2.1 Existing Asphalt Mixture Performance Tests ... 27
Table 3.1 Summary of Mixtures Used for Developing DR Failure Criterion ... 36
Table 3.2 Summary of DR Values for Study Mixtures ... 52
Table 3.3 Test Data for Two Representative Asphalt Mixtures ... 54
Table 3.4 Statistical Analysis of Test Data Using Linear Regression Method ... 56
Table 3.5 Statistical Analysis of Test Data Assuming Normal Distribution of DR... 58
Table 4.1 Materials Used in the Development and Validation of the Sapp Parameter. ... 70
Table 4.2 Mixture Properties Used in NE RAP Study. ... 81
Table 4.3 Volumetric Conditions Used in NCSU PEMD Study... 85
Table 4.4 Recommended Threshold Values of Sapp Parameter at Different Traffic Levels. ... 89
Table 6.1 Mixtures Used in NCAT Test Sections ... 123
Table 6.2 Mixture Information for MnROAD Cells ... 124
Table 7.1 Volumetric Properties and Test Results of SM12.5 Mixture ... 146
Table 7.2 Volumetric Properties and Test Results of RS9.5B Mixture ... 147
Table 7.3 Volumetric Properties and Test Results of Shadow Mixture ... 149
Table 7.4 Statistical Parameters in Regression Analysis ... 154
Table 8.1 Volumetric Properties of the RS9.5B Mixture ... 172
Table 8.2 Volumetric Properties of the SM12.5 Mixture ... 174
Table 8.3 Volumetric Properties of the RI19C Mixture ... 175
Table 8.4 Typical Structures for Different Design Traffic Volumes ... 184
xii
LIST OF FIGURES
Figure 1.1 Flow chart of the organization of the dissertation ... 4
Figure 2.1 Volumetric diagram for asphalt mixtures. ... 12
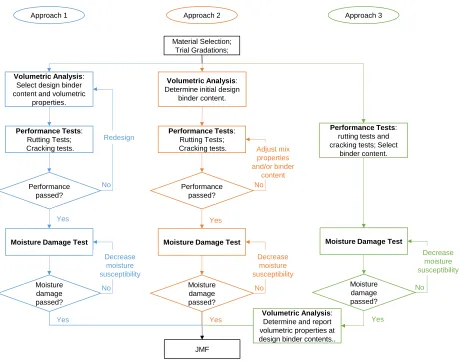
Figure 2.2 Schematic illustration of the three BMD approaches. (West et al. 2018) ... 24
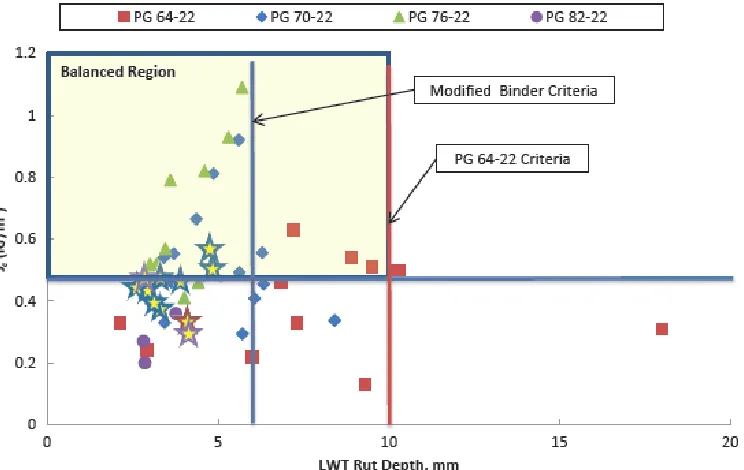
Figure 2.3 Example of the performance space diagram (PSD). (West et al. 2018) ... 24
Figure 2.4 Pavement distresses that SHAs intend to address in BMD and contractors experience in their mixes. Note: na = not available. ... 25
Figure 2.5 Balanced mix design analysis for Louisiana mixes. Source: Copper III et al. 2016. . 29
Figure 3.1 Pseudo hysteresis loops for controlled CX cyclic tests. ... 40
Figure 3.2 Schematic representation of (a) pseudo stiffness and (b) total released pseudo strain energy in the S-VECD model. ... 41
Figure 3.3 Relationship between GR and number of cycles to failure under different test modes and temperatures (VTe30LC mixture). ... 44
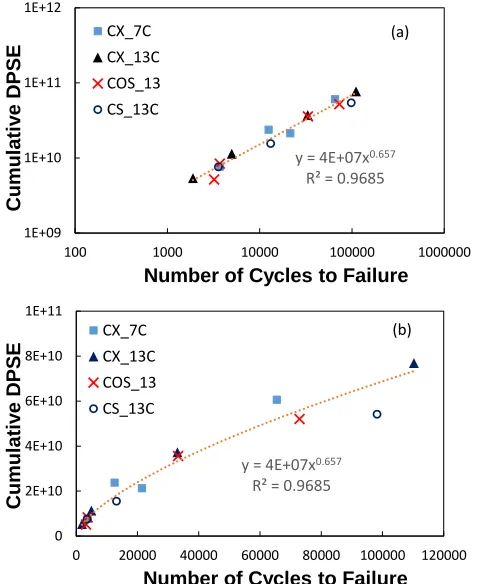
Figure 3.4 Relationship between the cumulative 𝑊𝐶𝑅 and number of cycles to failure under different test modes and temperatures (VTe30LC mixture): (a) log-log scale and (b) arithmetic scale... 46
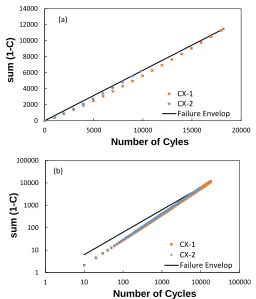
Figure 3.5 Relationship between the cumulative (1-C) and number of cycles under different test modes and temperatures (VTe30LC mixture). ... 47
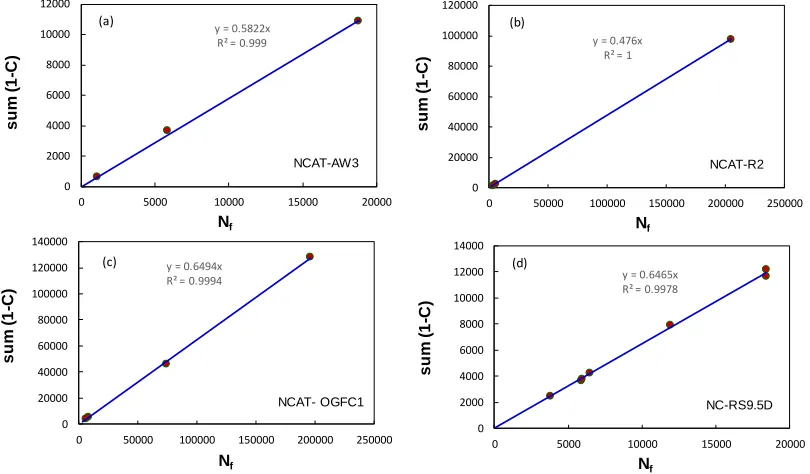
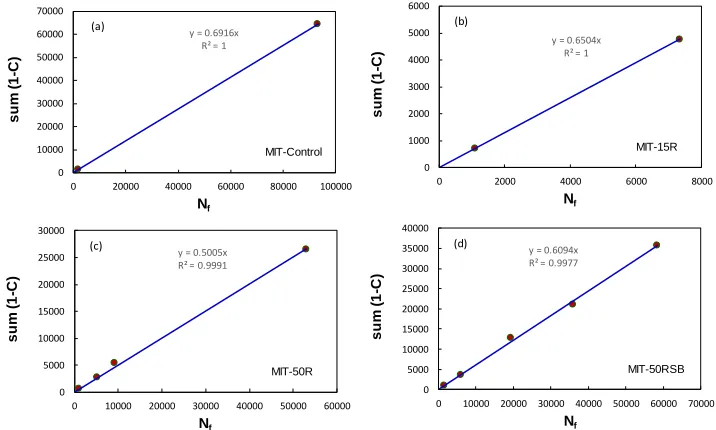
Figure 3.6 Relationship between Sum(1-C) to failure and number of cycles to failure. ... 47
xiii
Figure 3.8 Implementation of the new failure criterion using different mixtures. ... 50
Figure 3.9 Implementation of the new failure criterion using ALF mixtures. ... 51
Figure 3.10 Implementation of the new failure criterion using MIT mixtures with different RAP contents. ... 51
Figure 3.11 Damage characterization curves of NCAT surface mixtures. ... 53
Figure 4.1 (a) Damage characteristic curves for NH6440-opt and NH6420opt mixtures and (b) C vs. N curves for the two mixtures at different strain levels in cyclic fatigue tests. ... 69
Figure 4.2 Damage characteristic curves for NCAT C3 (Control) and NCAT R3 (50% RAP) bottom-layer mixtures. ... 71
Figure 4.3 Schematics for Cavg and Srep with damage characteristic curves: (a) NH6420opt and NH6440-opt mixtures and (b) NCAT-C3 and NCAT-R3 mixtures... 73
Figure 4.4 Srep values of mixtures with various RAP contents and binder contents. ... 77
Figure 4.5 Srep values of aged mixtures (NCAT mixtures with 50% RAP oven-conditioned for 0 days, 7 days, 11 days, and 21 days, respectively). ... 78
Figure 4.6 Evaluation of effects of RAP content and soft binder using Sapp (MIT-RAP mixtures). ... 80
Figure 4.7 Sapp values of mixtures used in the NE RAP study... 81
Figure 4.8 Change in Sapp values as binder content increases. ... 82
xiv
Figure 4.10 Sapp values of study mixtures with different mix design volumetric conditions: (a)
FHWA PEMD study and (b) NCSU PEMD study. ... 85
Figure 4.11 Sapp values of oven-aged mixtures: (a) NC RS9.5B mixture and (b) NCAT
mixture with 50% RAP. ... 86
Figure 4.12 Sapp values and field performance of the ALF-RAP mixtures: (a) Sapp values, (b)
loading passes before the first crack appears, and (c) comparison between the Sapp values and
the field performance. ... 87
Figure 4.13 Sapp values of FHWA ALF mixtures with modified binders and their field
performance: (a) Sapp values of the mixtures, (b) percentage of cracking at each test lane,
and (c) comparison between index values and field cracking measurements. ... 88
Figure 4.14 Allowable traffic levels of mixtures based on Sapp. ... 90
Figure 4.15 Sapp values vs. predicted % damage in layers where target mixtures were utilized. 92
Figure 5.1 Materials and pavement test structures used in this study: (a) FHWA-ALF, (b) NCAT, (c) KEC, and (d) Binzhou pavements. ... 96
Figure 5.2 Failure criteria for the asphalt mixtures used in the KEC test road: (a) GR failure criterion and (b) DR failure criterion. Note: each data point represents one cyclic fatigue test
sample at one strain level. ... 99
Figure 5.3 Reference area for ‘percent damage’ definition in FlexPAVE™. ... 101
Figure 5.4 Damage contours: (a) Section A2 based on the GR criterion, (b) Section A2 based on the DR criterion, (c) Section A13 based on the GR criterion, and (d) Section A13 based on the DR criterion ... 104
Figure 5.5 Contours for damage factors used in 20-year simulations of FHWA ALF test
xv
Figure 5.6 Cracking evolution derived from (a) FlexPAVE™, (b) FHWA ALF test section results, (c) predicted damage vs. measured cracking, and (d) predicted damage vs. measured cracking if only total failed nodes are counted. ... 107
Figure 5.7 . Contours for 40-month simulation results obtained from FlexPAVE™ for NCAT mixtures: (a) NCAT-Control, (b) NCAT-AW, (c) NCAT-FW, (d) NCAT-RW, (e)
NCAT-R, and (f) NCAT-OGFC. ... 109
Figure 5.8 Cracking evolution derived from (a) FlexPAVE™, (b) NCAT test track results, and (c) predicted ‘percent damage’ vs. measured cracking area at the end of the experiment. . 110
Figure 5.9 (a) ‘Percent damage’ for KEC test road simulations and (b) KEC field results. Note that the asphalt layer thicknesses are indicated in the legend. ... 111
Figure 5.10 Eight-year simulation results obtained from FlexPAVE™ for Binzhou test road sections. ... 113
Figure 6.1 Predicted fatigue damage in asphalt layer cross-section: (a) damage contours and (b) total effective area used for %Damage calculations. (Wang et al. 2018) ... 119
Figure 6.2 Layout of pavement test sections: (a) KEC test road, (b) NCAT test track, and (c) MIT-RAP test road. Note, the numbers in the figures indicate the thickness (cm) of the
layers. ... 122
Figure 6.3 Measured %Cracking and predicted %Damage: (a) field measurements and (b) FlexPAVE™ predictions. ... 127
Figure 6.4 Preliminary fatigue transfer function: (a) range of %Damage is 0% to 40% and (b) range of % Damage is 0% to 20 percent. ... 128
Figure 6.5 Predicted vs. measured %Cracking for pavement sections after application of fatigue transfer function: (a) NCAT test track, (b) KEC test road, (c) MIT-RAP test road,
and (d) MnROAD sections. ... 130
xvi
Figure 7.1 Volumetric diagrams: (a) at design compaction level (Ndes) and (b) as-constructed
(in-place) compaction level. ... 137
Figure 7.2 Distribution of volumetric conditions for SM12.5 mixture. ... 146
Figure 7.3 Distribution of volumetric conditions for RS9.5B mixture. ... 148
Figure 7.4 Distribution of volumetric conditions for shadow mixture. ... 149
Figure 7.5 Contours of response surface: (a) SM12.5 mixture, (b) RS9.5B mixture, and (c) shadow mixture. ... 151
Figure 7.6 Linearity in performance-volumetric relationship: (a) % damage vs. in-place VFA and (b) % damage vs. in-place VMA. ... 152
Figure 7.7 Regression analysis results: (a) and (b) residual plots, (c) normal probability plot, and (d) comparison between predictions and observations. ... 156
Figure 7.8 Evaluation results for combinations of volumetric conditions in model regression. Note: the acceptable error threshold for (c) and (d) was fixed to be 10 percent. ... 160
Figure 7.9 Prediction results obtained from calibrated PVR function: (a) and (b) SM12.5 mixture, (c) and (d) RS9.5B mixture, and (e) and (f) shadow mixture. ... 161
Figure 8.1 The volumetric space and the PVR function: (a) the volumetric space formed by VMAIP and VFAIP; (b) %Damage contour in a pavement structure in the volumetric space. . 171
Figure 8.2 RS9.5B mixture design information: (a) created gradation, (b) relationship between air void content at Ndes and binder content, (c) measured volumetric data of the points in (b), and (d) selected design area and critical points in the volumetric space. ... 180
xvii
Figure 8.4 RI19C mixture design information: (a) created gradation, (b) relationship between air void content at Ndes and binder content, (c) measured volumetric data of the
points in (b), and (d) selected design area and critical points in the volumetric space. ... 182
Figure 8.5 FlexPAVE™ simulation results for RS9.5B: (a) %Damage vs. time at different volumetric conditions, (b) % average permanent strain vs. time, (c) %Damage contours
predicted by PVR, and (d) % average permanent strain contours. ... 185
Figure 8.6 FlexPAVE™ simulation results for SM12.5: (a) %Damage vs. time at different volumetric conditions, (b) % average permanent strain vs. time, (c) %Damage contours
predicted by PVR, and (d) % average permanent strain contours. ... 186
Figure 8.7 FlexPAVE™ simulation results for RI19C: (a) %Damage vs. time at different volumetric conditions, (b) % average permanent strain vs. time, (c) %Damage contours
predicted by PVR, and (d) % average permanent strain contours. ... 187
Figure 8.8 The predicted pavement life based at different volumtric conditions of the RS9.5B mixture: (a) pavement life based on fatigue %Cracking; (b) pavement life based on % permanent strain; (c) pavement life with combined %Cracking and % permanent strain. Note: the unit for life is year. ... 190
Figure 8.9 The predicted pavement life based at different volumtric conditions of the SM12.5 mixture: (a) pavement life based on fatigue %Cracking; (b) pavement life based on % permanent strain; (c) pavement life with combined %Cracking and % permanent strain. Note: the unit for life is year. ... 191
Figure 8.10 The predicted pavement life based at different volumtric conditions of the RI19C mixture: (a) pavement life based on fatigue %Cracking; (b) pavement life based on % permanent strain; (c) pavement life with combined %Cracking and % permanent strain. Note: the unit for life is year. ... 192
Figure 8.11 Pavement life in the design AC-AV space and design results: (a) RS9.5B mixture, (b) PEMD final gradation of RS9.5B mixture, (c) pavement life in design AC-AV space and PEMD conditions for SM 12.5 mixture, and (d) pavement life in design AC-AV space and PEMD conditions for RI19C mixture.. ... 194
1
CHAPTER 1. INTRODUCTION
1.1. Research Needs
Mix design is one of the most popular research topics in the asphalt paving field. A
low-quality mix design will directly result in pavements with poor performance. A research project
called Strategic Highway Research Program (SHRP), funded and managed by several national
and federal organizations with $50 million of budge, was initiated in 1987. One the of the major
objectives of the research project was to develop an improved mix design method. Although
mechanistic models were planned to be implemented, due to the limitations in the modeling and
testing technologies, only the empirical design method called Superpave was approved as the
final product. The Superpave mix design controls the volumetric properties of mixtures to
indirectly ensure the mixture performance. The Superpave mix design has been implemented in
most of the states in the U.S. However, the need for a mix design method that can directly relate
the candidate mix designs to mixture or pavement performance and allow users to obtain the “performance-optimum” design still exists. Recently, some mechanical tests have been added in
mix design. Those tests aim to ensure the mixture distress resistances by index parameters.
However, there are several drawbacks in using index parameters only:
• most of these mechanical tests and index parameters only model the mixture at one fixed temperature and loading condition. However, the environment that asphalt mixtures
experience in pavements is much more complicated.
• the distress evolution in the mixture as time growth cannot be modelled by index
2 • most of these mechanical test index parameters are evaluating mixtures on the material
level only. However, asphalt mixtures are placed in pavement structures under various
loading conditions. These index parameters cannot consider the structure effects.
A mix design method based on the prediction of the pavement major distresses, i.e.,
fatigue damage and rutting, is proposed in this research. The method applies mechanistic models
to predict the pavement distresses as a function of time and optimize the design based on the
maximum pavement life.
In order to predict fatigue performance of an asphalt mixture under traffic loads, a robust
mechanistic model is needed. The Simplified ViscoElastic Continuum Damage (S-VECD) model
is one of the few that can predict the damage evolution under various loading conditions. The
model is consistent of two parts: the damage characteristic curve and the failure criterion. The
existing failure criterion requires considerable amount of laboratory testing and has limited
accuracy in predicting the fatigue damage in structure analysis due to the inevitable extrapolation
in the log-log scale. A new failure criterion should be developed to model the fatigue damage
evolution in asphalt mixtures and pavements.
1.2. Scope and Objectives
This research has two major objectives:
1. to develop a new failure criterion for the S-VECD model.
2. to develop the framework of the Performance-Engineered Mix Design procedure.
1.3. Dissertation Outline
Nine chapters are presented in this dissertation. The organization are presented as the
3 • Chapter 1: Introduction. This chapter introduces the research needs and objectives of this
study.
• Chapter 2: Literature review. This chapter focuses on the literature for mix design. It summarizes the study about volumetric properties and new mix design methods. • Chapter 3: Development of the DR failure criterion. Chapter 3 to Chapter 6 focus on the
development of mechanistic fatigue models. This chapter presents the development and
validation of the new failure criterion.
• Chapter 4: Development of the fatigue index parameter, Sapp. The DR failure criterion is
implemented in the material level evaluation of asphalt mixture fatigue resistance. This
chapter presents the development of the material index parameter and the evaluation
results of the fatigue resistance of over 100 asphalt mixtures.
• Chapter 5: Fatigue performance prediction in structural analyses using the DR failure
criterion. This chapter presents the implementation of the DR failure criterion in the pavement structure analysis program FlexPAVE™. Improved performance simulation
results have been reported.
• Chapter 6: Development of preliminary transfer function for FlexPAVE™. FlexPAVE™ predict the amount of fatigue damage in the asphalt-layer cross-section directly. Transfer
function converts the prediction results to the amount of fatigue cracking on the
pavement surface and meanwhile calibrate the predicted results to the field
measurements. This chapter presents the development of the transfer function and the
final prediction results of FlexPAVE™.
4 PEMD. The PVR function serves as the tool linking the volumetric changes and the
changes in mixture / pavement performance. It plays an important role in the proposed
PEMD. This chapter presents the development of the PVR function.
• Chapter 8: Development of the Framework of the PEMD. This chapter presents the procedure of PEMD. The results of design examples are also presented in this chapter. • Chapter 9: Conclusion of this study.
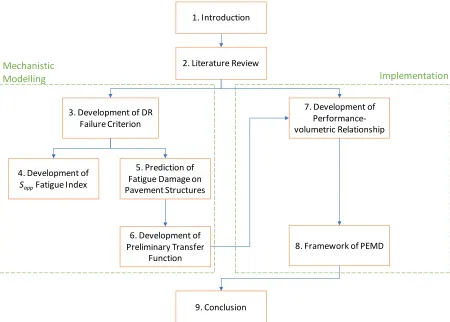
Figure 1.1 presents a flow chart of the organization of the dissertation.
Figure 1.1 Flow chart of the organization of the dissertation 1. Introduction
2. Literature Review
3. Development of DR Failure Criterion
4. Development of
SappFatigue Index
5. Prediction of Fatigue Damage on Pavement Structures
6. Development of Preliminary Transfer
Function
7. Development of Performance-volumetric Relationship
8. Framework of PEMD
9. Conclusion Mechanistic
5
CHAPTER 2. LITERATURE REIVEW
2.1. Introduction
The United States has the world’s largest road network (Road Traffic Technology, 2014).
According to the Federal Highway Administration (FHWA), there are 4.1 million miles of public
roads in the U.S., and among the 1 million miles road that are managed by the FHWA and state
agencies, 84% of the paved roads are asphalt (NAPA 2019). Roughly 350 million tons of asphalt
pavement materials are produced per year across the U.S. The performance of the asphalt
mixtures on the roads have great impacts on the economy and everyone’s daily life. In fact, many
pavement distresses can be attributed to the immature mix designs. An asphalt mixture consists
of many components, such as aggregate from different sources, asphalt binder, reclaimed
materials, and other additives. The proportion of each components should be designed rationally.
The section summarizes the work and studies about mix designs.
2.2. History of Mix Design
2.2.1.Early Mix Design Method
The history of pavement designs can be traced back to the late 19th century and the early
20th century. A design formula and construction specification were first published by F.V. Greene of the Barber Asphalt Paving Company. In 1905, Clifford Richardson published a book
named ‘The modern Asphalt Pavement’, where asphalt mixes were first categorized, and
aggregate gradations and asphalt contents were specified. The ‘pat-paper test’ was proposed to
determine the asphalt content for a sand mix. Richardson also mentioned that the Voids in
Mineral Aggregates (VMA) should be adjusted to include the correct amount of asphalt in
asphaltic concrete. The concept of the asphaltic concrete is more similar to what current-day Hot
6 asphalt content was not determined by the ‘pat-paper’ test, but by the amount of the
macro-texture filled with mastic visually inspected after mixtures were compacted with a heated hand
tool in the laboratory. The air void content was not controlled in the design method but was
required to be reported. The key idea evolving from pavement design at the beginning of the 20th century was the concept of using an asphaltic concrete as the base layers with a sand asphalt mix
at the surface. (McDaniel et al. 2011)
Later in the 1920s, the Hubbard Field mix design method was created. The method was
widely used by state agencies in the first half of the 20th century. The method was built upon the
Richardson design method. Instead of using a stain test, the Hubbard Field design suggested
using another method to evaluate the design binder content. Air voids and the so-call VMA
should be measured; the volumetric analysis was similar to the properties used today. In addition,
the stability of the designed mixture should be measured. The binder content was adjusted based
on air voids, VMA, and stability.
2.2.2.The Hveem Mix Design Method
Since the late 1920s, Francis Hveem has started to work on developing a new design
method for asphalt mixtures. By 1932, he had developed an analysis method to determine asphalt
content based on the surface area of aggregates. A test using motor oil was developed to estimate
asphalt absorption. Meanwhile, a stability test was developed as well. The test equipment was
then called the Hveem stabilormeter. The test was essentially a pseudo-triaxial test. The
philosophy of the Hveem mix design was that sufficient asphalt binder was needed to satisfy
absorption into the aggregates and to have a minimum film thickness on the surface of the
aggregates. The film thickness and the mechanical properties were most important in the design
7 using this method did not have great rutting problems since the binder content in the mixture was
typically lower than the ones designed by other method (the Marshall design method, for
example).
2.2.3.The Marshall Mix Design Method
The Marshall mix design method was first developed by Bruce Marshall of the
Mississippi Department of Highways in the late 1930s – early 1940s. The method was adopted
by the Corps of Engineers during the World War II (WWII). The state highway agencies started
to accept it after the WWII. The design method was essentially an outgrowth of the Hubbard
Field mix design. Instead of using head rammers with different sizes operated by hands, the
Marshall design standardized the compaction energy by using a drop hammer. The stability of
the design mixture was measured by a new device. VMA and air void were used to determine the
binder content. The philosophy in the design method was kept in the Superpave design method.
(McDaniel et al. 2011)
2.3. The Superpave Mix Design
The Superpave mix design method has been recognized as one of the major success
stories of the Strategic Highway Research Program (SHRP). It has been accepted and used by
most of the states in the U.S. The SHRP was the largest, most highly focused research effort in
the U.S. since the AASHO Road Test of the late 1950s and went far beyond the Road Test in its
breadth and scope. In the late 1970s, it was realized nationally that the lack of research and
investments in the asphalt industry had become an important issue. In 1987, the SHRP was
officially initiated with the participation of many national organizations, i.e., FHWA, AASHTO,
TRB, NCHRP, etc., as well as local agencies and private participations. Fifty million dollars was
8 program was started 1980, and the results of the pre-study provided the impetus for undertaking
the large-scale SHRP. After 1993, the implementation phase of the SHRP began.
The product of the SHRP included two parts: the binder specifications and the asphalt
mixture design methods and specifications. The performance-based binder specifications were
originally envisioned to be primarily based on chemical composition of asphalt; however, at the
end of the project, the rheology tests and the corresponding parameters were accepted and
implemented. Similarly, on the mixture side, the final product was initially expected to be
performance-based. Because of the different requirements for the mixtures that would be used
under different traffic volumes, three hierarchical levels of design required were planned: • Level 1: for mixes under traffic volume less than 106 ESALs (Equivalent Standard Axial
Loads), only volumetric criteria were required;
• Level 2 and 3: for mixes under traffic volume greater than 106 ESALs, the mixtures should pass the volumetric criteria, performance tests, and the pavement distresses with
time should be estimated. Mixtures designed using the Level 3 method were expected to
carry very heavy traffic loads (more than 107 ESALs). More performance tests at more temperatures should be performance in the Level 3 design.
However, the design method that was proposed at the end of the project contained only
the Level 1 requirements. One major reason was that the performance models available at that
time had limited power and the performance tests were difficult to conduct. The design method
was named as Superpave, short for SUperior PERforming asphalt. The critical control
parameters in the design method include gradation, air voids, VMA, Voids Filled with Asphalt
(VFA), etc.; they were determined using the Delphi Method during several research meetings
9 002B, 002C, 003A, 003B, 004, 005, 006) were awarded. The sub-contracts covered the topics
including asphalt binder properties, performance-based testing and measuring, pavement
performance models, performance-based specifications, and coordination, respectively.
Important decisions, such as the compaction method and equipment, the usage of performance
models, were made through the sub-contracts.
After 1993, the end of the research period, the SHRP was not terminated. Instead, great
effort was made to have the findings implemented. Several national organizations, such as
FHWA and TRB/NCHRP took the lead and played important roles in this task. Funding and
training were provided to the industry to allow the new developed analysis method, testing
methods, and specifications to be understood and implemented. The experiences that were
gained from the successes in the research phase and the implementation phase were valuable for
future research and studies.
Superpave mixtures, as one of the final products in the SHRP, have been shown to
perform better, in general, than previous mixes (McDaniel et al. 2011). A benefit-cost study
conducted in 1996-1997 by the University of Nevada – Reno (UNR) quantitively showed that
improved pavement performance and the increased pavement service life introduced by the new
binder specification and the Superpave design method could save $637 million per year. In
addition, the fewer maintenance related delays in user costs and less vehicle maintenance could
save motorists $1.7 billion per year over 20 years if the binder specifications would be
implemented within five years.
On the other hand, according to the study of NCHRP 9-33 (AAT 2011), as the Superpave
was implemented, some engineers started to criticize the Superpave system for its lack of a
10 tests. In addition, the experience of some engineers suggested that Superpave mixtures were
difficult to compact and exhibited only fair to poor durability. For example, the Virginia
Transportation Research Council in Report VTRC 03-R15 concluded that Superpave mixes often
lack sufficient binder content for adequate durability. After the 2003 paving season, New Jersey
formed a task force on Superpave durability because of concern about raveling, segregation, and
the generally dry appearance of Superpave mixes. Many states have tried to modify the criteria in
the Superpave design based on their experiences and the characteristics of their local materials.
Another criticism on the Superpave design method is that the measurements of the volumetric
parameters are highly dependent on the accuracy of the measurement of aggregate bulk specific
gravity (Gsb). When the absorption is high, the repeatability of the tests will become an issue.
It should be noticed that the asphalt paving field had recognized the value of the
pavement performance in mix design since the 1980s. Due to the limitations in the performance
prediction models and the test methods available in the 1990s, the performance tests could not be
included in the Superpave design. As the modeling technologies evolves, there is potential to have the performance criteria included in the ‘next generation’ mixture design method. Some
researchers also believe that refineries and chemical manufacturers are constantly developing
new types of binder modification, and the performance of modified binders is not completely
reflected in the current performance grading system (AAT 2011). Including performance tests
can be a solution in this situation.
2.4. Volumetric Parameters and other typical parameters
Control parameters are playing very important roles in mix designs. In ideal
performance-based mix designs, the primary control parameters should be the predicted
11 other parameters such as volumetric parameters are the keys to indirectly ensure the performance
mixtures. Many different control parameters have been used in the design methods that are
introduced above. Understanding the meaning of these parameters, the effects of their changes,
and the rationales of adopting these parameters is meaningful in order to understand and modify
the design methods.
The control parameters that have been widely accepted and used include the volumetric
parameters (such as VMA, VFA, air voids, etc.) and other typical parameters (such as
dust-to-binder ratio, gradation, film thickness). In addition, parameters such as the compaction level,
number of design gyrations or Ndes, also have great impact on the properties of the designed
mixtures. The value of these parameters has been determined carefully in previous research. This
section summarizes the highlighted findings and discussions about the control parameters from
the previous studies.
2.4.1.Volumetric Parameters
As mentioned above, since the 1920s, the volumetric parameters have been used as the
control parameters in mix designs. The frequently used volumetric parameters include but not
limited to voids in mineral aggregates (VMA), voids filled with asphalt (VFA), design air voids
(Va), and volume of effect binder (VBE). Figure 2.1 schematically shows the volumetric
parameters in a diagram.
The value of each volumetric parameter is dominated by different factors. For example,
the aggregate gradation has a great impact on the value of VMA of an asphalt mixture. In turn,
controlling the values of these parameters can effectively lead to the target design. However,
these parameters cannot be specified individually without considering their interactions. For
12 consequently according to the relationship among the three parameters. Therefore, numerous
studies about what parameters should be adopted for control and how the corresponding limits
should be specified have been conducted.
Figure 2.1 Volumetric diagram for asphalt mixtures.
2.4.1.1.VMA
VMA is one of the most important volumetric parameters for asphalt. It is used as one of
the primary control parameters in the Marshall mix design and the Superpave system. The
parameter is determined by the aggregate gradation, binder content, and the compaction level.
Pavement engineers have formed a consensus that the VMA should be specified so that there can
be sufficient space for the effective binder and air voids. Thus, the minimum of the VMA is
specified in the design and quality assurance (QA) specifications in most of the state agencies.
Based on the research findings and experience, some agencies have started to modify the
requirements for VMA. Several states have slightly increased minimum VMA values, providing
for somewhat richer mixtures than produced by the current version of Superpave. Some states
have proposed to establish the maximum VMA values 1.5% to 2.0% above the minimum values
and remove the limits of VFA to simplify the design procedure. [Christensen, Jr. and Bonaquist
2006]
Vba
air
asphalt
aggregates
VFA Va
VMA
13 It is worthy to mention that the adjustments in such volumetric parameters should be
evaluated carefully since the interactions among the volumetric properties cannot be ignored. For
instance, aiming to increase the effective binder content by increasing the VMA include an
assumption that the VFA or the design air void should not be changed dramatically. Thus, other
parameters should be controlled or adjusted simultaneously as such adjustments in VMA are
made. Moreover, as the design parameters change in the laboratory, there are other effects on the
mixture when mixtures are laid in the field. One significant effect is the compatibility of the
mixture. As gradation and binder content change, the compatibility will be different. Thus, if the
same amount of compaction energy is applied in the field, the in-place air void will be changed.
Therefore, when the design parameters are adjusted in the lab, the consequent changes in the
in-place mix properties should also be considered by pavement engineers. It can be seen from the
discussion above that the interactions among the volumetric parameters and interactions between
the mixtures compacted in the lab and in the field are important. Pavement engineers should
thoroughly evaluate the augments when decisions are made. These interrelated changes among
the design parameters will be emphasized repeatedly in this document.
It has been well known that the value of VMA changes as the binder content varies. As
the binder content increases from a low value in the design specimen, the typical trend of the
changes in VMA is decreasing first and then increasing. According to the (Asphalt Institute
2015), the asphalt contents on the ‘wet’ or right-hand increasing side of the VMA curve should
be avoided even if the minimum air void and VMA criteria are satisfied. Otherwise, bleeding or
plastic flow would have a higher chance to occur in the field. Additionally, when the bottom of
the U-shaped VMA curve falls below the minimum criteria level required for the nominal
14 necessary. Specifically, the aggregate grading should be modified to provide additional VMA.
The design asphalt content should not be selected at the extremes of the acceptable range even
though the minimum criteria are met. On the left-hand side, the mix would be too dry, prone to
segregation, and would probably be too high in air voids. On the right-hand side, the mix would
be expected to rut (Asphalt Institute 2015).
2.4.1.2.Design Air Voids
The design air void is another topic that have raised many questions and discussions. In
the Marshall mix design, the range of the design air void is 3% - 5%. In the Superpave design
system, the air void is fixed at 4%. Recently, many state agencies have conducted research to
find the optimum design air void. For example, a study carried out by the Indiana Department of
Transportation (INDOT) and the Purdue University in 2018 showed that increasing the design air
void to 5% can effectively increase the average mixture density compacted in the field from
93.3% to 95.3%. The potential benefits of this modification were validated by the field
performance (Montoya et al. 2018). Broadening the design air void content from a fixed value of
4.0% to a range of 3.0% to 5.0% is one of the most common adjustments among state agencies
[Christensen, Jr. and Bonaquist 2006].
Similar to VMA, the design air void is a result of many other factors, i.e., the gradation,
binder content, and the compaction energy. In turn, changing the design air void will have
different effects at different situations. For instance, if the VMA and the compaction energy (or
Ndes) are fixed, decreasing the design air void means increasing the binder content and the
compactibility of the mixture. If the design air void is increased, lower binder content will be
15 target in-place density in the field. Thus, the additional compaction effort and stability are the
major benefits of increasing the design air voids in most of cases.
The design air void was originally determined based on the mixture in-place density. The
in-place air void content of HMA pavement is often assumed to be about 7%. Research (as
reported in NCHRP Report 573) suggests that immediately after construction the air void content
of HMA pavements typically ranges from about 6 to 11%, with a median value between 8 and
9%. Cores taken from a newly constructed pavement will generally have air void contents in this
range. However, once the pavement is opened to traffic, the repeated loading as trucks pass over
the pavement will tend to further compact the material in the wheel paths of the pavement. Many
engineers assume that the air void content in the wheel paths of an asphalt concrete pavement
should, within a few years, reach about the same value as was used in the laboratory mix design.
(AAT 2011). After the thorough evaluation conducted under the NCHRP 9-33 project, using 4.0
± 0.5% as the range of design air void is suggested as a result of the balance between the
required compaction effort and the mixture’s rutting resistance.
The NCHRP 9-33 study also pointed out that the expected additional fatigue and rutting
resistance from increasing the design air void is obtained from the additional compaction effort
in the field when the required in-place air void remains the same. In fact, the magnitude of the
effect of changes in design air void content and in-place air void content on mixture performance
appear to be nearly identical. In other words, if in-place air void content is allowed to vary with
design air voids (for example, in-place air voids of 8% for 5% design air voids, in-place air voids
of 6% for design air voids of 3%), the factors nearly offset each other and there is little net
change in rut resistance (AAT 2011). The research under NCHRP 9-33 suggested that engineers
16 will increase more or less with the design air void and the permeability of the asphalt mixture is
highly affected by the in-place air void.
Some practitioners believe that it would be beneficial if the in-place air void is also
included in the mix design. However, the researchers in the NCHRP 9-33 project indicated that
although there appears to be some advantage to linking design and in-place air voids, such an
approach would be impractical since in most paving projects the in-place air voids cannot be
predicted with any certainty. Paving engineer and technicians should nevertheless understand the
relationship among design air voids, in-place air voids, and performance (AAT 2011).
2.4.1.3.VFA and Vbe
In the current Superpave design method, the VFA is an important control factor. The
factor mainly controls the amount of the effective binder in an asphalt mixture. The parameter,
Vbe, essentially has the same function in mix design. There is a mathematical relationship
between VMA, VFA, and Vbe. The value of Vbe is mathematically equal to the ``product of
VMA and VFA. Some studies have suggested controlling the Vbe directly to make the design
procedure more straightforward (AAT 2011).
The effective binder content, which is predominately controlled by VFA or Vbe, is one of
the most important design factors for an asphalt mixture. The amount of effective binder affects
the critical mixture properties, i.e., the fatigue resistance, rutting resistance, compatibility,
durability, and so forth.
Additionally, the researcher in the NCHRP 9-33 project propose an alternative way to
determine the optimum binder content. The new definition defines the optimum binder content as
17 2.4.1.4.Summary
The volumetric parameters are the major control parameters in the Marshall design and
the Superpave mix design. The gradation and binder content of the design mixture are
determined by these parameters. As the Superpave design method has been widely used in the
paving industry, some researchers and engineers have proposed and tried some directions to
reform the design procedure and criteria. It should be highlighted that when such modifications
are made, the interactions among these parameters should be evaluated carefully. For example,
when changing the design air void, not only the effective binder content but also the VMA,
compatibility, in-place air void, and permeability of the mixture will be varying as a result.
Moreover, when such modifications are implemented in the design specification, the agencies
intent to implicitly improve some mix properties to the expected level. However, in fact, with the
economic incentives, producers or contractors may easily find other ways to adjust the mix to
satisfy the new volumetric criteria without changing the mix properties that the agencies
expected to improve originally. For example, some agencies tried to reduce the Ndes or increase
the minimum VMA to obtain ‘richer’ asphalt mixtures, but producers may simply adjust their
aggregate properties while maintaining the binder content at the lowest possible level (AAT
2011).
2.4.2.Film thickness
The film thickness has been considered as a candidate control parameter in mix designs.
Some researchers believed that it is the binder film thickness that affects the mixture
performance and the binder content should be determined based on the target film thickness
(Christensen, Jr. and Bonaquist 2006). In the study of NCHRP 9-25 Project, the fineness
18 aggregates. It was believed that the effective surface area can be used to calculate the film
thickness and further to determine the binder content.
While some researchers believe the film thickness plays an important role in the structure
of asphalt mixtures, some others think that the film thickness do not even physically exist. The
concept remains controversial (AAT 2011). Those who are opposed to adopting the film
thickness in mix designs believe that at the microstructural level, the asphalt binder exists as a
single homogenous phase binding the aggregate particles together. Critics of film thickness point
out that there is no way to physically separate an aggregate particle with an intact asphalt binder
film from a compacted asphalt concrete mixture. However, this criticism does not address the
issue of whether or not calculated film thickness values are correlated to pavement performance.
The researchers in the NCHRP 9-33 study suggested using the terminology ‘apparent film thickness’ rather than ‘film thickness’ given the debate in the asphalt paving field. They
believe that although physically distinct films of asphalt binder cannot be separated from a
compacted specimen of asphalt concrete, such films do have physical meaning in loose
uncompacted HMA. During construction, if the apparent film thickness is too low, segregation
and low-quality compaction may occur. The researchers also pointed out that there is no enough
research indicating there is strong relationship between the apparent binder film thickness and
the workability and performance of asphalt mixtures. Given the fact that there is no sufficient
research to support the application of the apparent film thickness, the implementation of this
parameter should be based on engineers’ own judgement. It was suggested that if the concept is
adopted, the range of the thickness is recommended to be between 7 to 9 microns to provide the
19
2.4.3.Ndes and Compaction Effort
The Ndes is an important factor in mix design as well. In the current Superpave design
method, it is determined by the anticipated traffic level. Since the diameter and the compaction
pressure is fixed in the Superpave system, the Ndes estimates the compaction energy that will be
applied during construction and the early stage of the service life. The Ndes is a constant for each
traffic level, the compaction energy applied on the design specimens is fixed.
In addition to Ndes, the concepts of Nini and Nmax were also originally included in the
Superpave design method. Within the original Superpave system, a maximum value of density at
Nini was specified in order to help ensure proper aggregate structure since it was believed that
mixtures that compacted too quickly had poor aggregate structures. A maximum density at Nmax
was specified in the original Superpave system in order to ensure that the mix would remain
stable at the expected maximum traffic level (AAT 2011).
Some studies have suggested that increasing the Ndes by one level to improve the mixture
performance (Christensen and Banaquist 2006). Meanwhile, some other researchers also propose
to decrease the Ndes to improve the mixture performance (AAT 2011). The effect of adjusting the
Ndes is equivalent to that of changing the required design air voids. By increasing the Ndes while
other parameters including the design air void remain the same, the required compaction effort in
the field will be increased; the same result can also be achieved by increasing the design air void
while the Ndes and other parameters remain the constant. On the flip side, the engineers who
suggest decreasing the Ndes aim to increase the binder content in the mix. The effects of adjusting
the design air void have been discussed in previous sections. Again, the modification should be
applied carefully by evaluating the consequent changes in other design volumetric parameters,
20
2.4.4.Dust-to-binder Ratio and Permeability
The dust-to-binder ratio or the dust ratio is specified with a limit of 0.8 – 1.6 in the
current Superpave design method. This parameter is related to the specific aggregate surface. A
survey conducted by the New Jersey Department of Transportation shows that most of the states
have adjusted the limit in their design specification (NJDOT 2011). The study under the NCHRP
9-25 Project mentioned that some adjustment in the dust-to-binder should be able to reduce the
mixture permeability.
In terms of the permeability of an asphalt mixture, other parameters, i.e., the in-place air void and the percent finer than 75 μm or FM300 can also be used to estimate the permeability. It
has been found that the permeability of HMA specimens prepared in the laboratory tends to be
significantly lower than permeability values measured on field cores of comparable mixtures.
For this reason and because of the highly variable nature of permeability measurements,
laboratory measurements of mixture permeability are not recommended for use in routine
mixture design. Considering the permeability during the mix design shall be recommended
(Christensen, Jr. and Bonaquist 2006).
2.4.5.Gradation
The gradation of the mixture is one of the key products of the mix designs. In the
Superpave mix design method, the gradation is controlled by the limits of percentage passing on
the control sieves as well as the by the volumetric parameters. HMA gradations are usually
classified as coarse, fine, or dense, depending on where they pass relative to the maximum
density gradation. Those falling below the maximum density gradation are called coarse
gradations, those passing above are called fine gradations, and those passing near the maximum
21 these gradations are used in producing dense-graded HMA—therefore, a more accurate
classification of these gradations would be dense/coarse, dense/fine, and dense/dense accurately
reflecting that all three gradations are close to dense gradations, but some are slightly coarser and
some slightly finer than the maximum density gradation (AAT 2011). The Superpave mix design
recommends coarse gradations (West and Marasteana 2013). However, an NCAT study shows
that on WesTrack study, some coarse-graded Superpave mixtures can exhibit very poor rut
resistance (Christensen, Jr. and Bonaquist 2006).
2.5. Balanced Mix Design
Since the beginning of the SHRP program, the asphalt paving field has been seeking
ways to implement performance test in the pavement design. Due to the limitations in the
modeling and testing technologies in 1990s, the final Superpave design procedure only adopted
the volumetric tests. As the new materials and technologies (i.e., the recycled materials, binder
modifiers, warm mix asphalt, etc.) have been used in the paving industry, the conventional
volumetric tests started to show their limitations. In addition, the distresses that constantly
present on pavements has given the motivations to state agencies to add simple
performance-related tests in mix designs and quality assurances (QAs) (West et al. 2018). Later, after years of
practice, discussion, and argument, the asphalt paving field started to reach a consensus for the
future of mix designs, and the modified mix design methods have been evolved and named as ‘balanced mix design.’
2.5.1.Definition of BMD
In September 2015, the Federal Highway Administration (FHWA) Expert Task Group
(ETD) on Mixtures and Construction founded a Balanced Mix Design (BMD) Task Force. The
22 appropriately conditioned specimens that address multiple modes of distress taking into
consideration mix aging, traffic climate and location within the pavement structure.” (West et al.
2018) BMD, in general, is integrated with two a more performance-related tests such as a rutting
test and a cracking test to balance the binder content and other design parameters between the
two traditionally conflicting performance. BMD is established to obtain the optimum design
parameter with the incorporation of the selected performance-related tests rather than only based
on the conventional volumetric tests.
2.5.1.1.Design Approaches
Three potential approaches to the use of BMD have been defined by the BMD Task
Force. The three approaches were extracted and summarized from the current practices among
state highway agencies (SHAs) and combined with future vision of the BMD from the Task
Force. The word “approaches” were used in the definition as opposed to “levels” as in the
proposed hierarchical definition of Superpave. The flowcharts illustrate the design process of the
three approaches are presented in Figure 2.2. The definition of the three approaches are
presented in the following:
• Approach 1: Volumetric Design with Performance Verification
Mix design starts with the current the volumetric mix design. The selected
performance-related rutting and cracking tests are used to prove the design. If the designed mix cannot satisfy
the performance criteria, the mix design will be repeated using different materials or mix
proportions until passing the performance requirements. Moisture damage test is used to control
the moisture susceptibility. This approach is the most common design method among the states
that have adopted BMD.