Electronic Theses and Dissertations Theses, Dissertations, and Major Papers
9-26-2018
Improving Quality of the Solution for the Team Formation Problem
Improving Quality of the Solution for the Team Formation Problem
in Social Networks Using SCAN Variant and Evolutionary
in Social Networks Using SCAN Variant and Evolutionary
Computation
Computation
Amangel Bhullar University of Windsor
Follow this and additional works at: https://scholar.uwindsor.ca/etd
Recommended Citation Recommended Citation
Bhullar, Amangel, "Improving Quality of the Solution for the Team Formation Problem in Social Networks Using SCAN Variant and Evolutionary Computation" (2018). Electronic Theses and Dissertations. 7497. https://scholar.uwindsor.ca/etd/7497
This online database contains the full-text of PhD dissertations and Masters’ theses of University of Windsor students from 1954 forward. These documents are made available for personal study and research purposes only, in accordance with the Canadian Copyright Act and the Creative Commons license—CC BY-NC-ND (Attribution, Non-Commercial, No Derivative Works). Under this license, works must always be attributed to the copyright holder (original author), cannot be used for any commercial purposes, and may not be altered. Any other use would require the permission of the copyright holder. Students may inquire about withdrawing their dissertation and/or thesis from this database. For additional inquiries, please contact the repository administrator via email
by
Amangel Bhullar
A Thesis
Submitted to the Faculty of Graduate Studies
through the School of Computer Science
in Partial Fulfillment of the Requirements for
the Degree of Master of Science at the
University of Windsor
Windsor, Ontario, Canada
2018
by
Amangel Bhullar
APPROVED BY:
R. J. Urbanic,
Department of Mechanical, Automotive and Materials Engineering
M. Kargar,
School of Computer Science
Z. Kobti, Advisor
School of Computer Science
P. Moradian Zadeh, Co-Advisor
School of Computer Science
Declaration of Co-Authorship/Previous
Publication
1. Co-Authorship
I hereby declare that this thesis incorporates material that is the result of
re-search conducted under the supervision of Dr. Ziad Kobti (Advisor) and Dr.
Pooya Moradia Zadeh (Co-Advisor). In all cases, the key ideas, primary
contri-butions, experimental designs, data analysis and interpretation, were performed
by the author, and the contribution of co-authors was primarily through the
proofreading of the published manuscripts. Dr. Mehdi Kargar and Kalyani
Selvarajah contributed in collecting data and explaining the materials.
I am aware of the University of Windsor Senate Policy on Authorship and I
certify that I have properly acknowledged the contribution of other researchers
to my thesis and have obtained written permission from each of the co-author(s)
to include the above material(s) in my thesis.
I certify that, with the above qualification, this thesis, and the research to which
it refers, is product of my own work.
2. Previous Publication
This thesis includes two original papers that has been previously submitted in
Section Full Citation Publication status
3.3, 3.3.1
and 3.3.3
Kalyani Selvarajah, Amangel
Bhullar, Dr. Ziad Kobti and Dr.
Mehdi Kargar .”Weighted-SCAN
Clustering Algorithm For
Find-ing; a Team of Experts in Social
Networks”. 31st International
FLAIRS (The Florida
Associ-ation for Artificial Intelligence
Research Society) Conference /
Association of Advanced
Arti-ficial Intelligence (AAAI) 2018
(pp. 209-212).
Accepted
Section Full Citation Publication status
3.6, 3.6.1
and 3.6.2
Amangel Bhullar, Kalyani
Sel-varajah, Dr. Ziad Kobti and Dr.
Mehdi Kargar. ”Hybrid Genetic
Algorithm based Approach For
Finding; the Team of Experts in
a Social Networks”. 17th IEEE
International Conference On
Ma-chine Learning And Applications
/ IEEE ICMLA 2018 .
Submitted
3. General
anyone’s copyright nor violate any proprietary rights and that any ideas,
tech-niques, quotations, or any other material from the work of other people included
in my thesis, published or otherwise, are fully acknowledged in accordance with
the standard referencing practices.
I declare that this is a true copy of my thesis, including any final revisions, as
approved by my thesis committee and the Graduate Studies office and that this
thesis has not been submitted for a higher degree to any other University or
Abstract
Social Network Analysis helps to visualize and understand the roles and
rela-tionships that ease or impede the collaboration and sharing of the information and
knowledge in an organization. In this research work, we will focus on the Team
Formation Problem (TFP) which is an open problem where we need to identify an
ideal team, with members of complementary talent or skills, to solve any given task.
Current research suggests that TFP solutions have been attempted with
evolution-ary computation approach using Cultural Algorithms (CA) and Genetic Algorithms
(GA). However, SCAN (Structural Clustering Algorithm for Networks) variants such
as WSCAN (Weighted Structural Clustering Algorithm for Networks) demonstrate a
high capability to find solutions for another type of network problems. In this thesis,
we first propose to use WSCAN-TFP algorithm to deal with the problem of team
formation in social networks, and we our findings indicate that WSCAN-TFP
algo-rithm worked faster than the evolutionary algoalgo-rithms counterparts but was of lower
performance compared to CAs and GAs. Next, we propose two hybrid solutions by
combining GA and CA with a modified WSCAN-TFP algorithm. To test the
per-formance of our proposed approaches, we define multiple quality criteria based on
communication cost (CC), average fitness score (AFS) and average processing time.
We used big datasets from DBLP nodes network with sizes 50K and 100K. The results
show that our proposed methods HGA and HCA can find the near-optimal solutions
faster with minimum communication cost with the improvement of≈66% and≈57%
Dedication
I would like to dedicate this thesis to my family.
Father: Babu Singh Bhullar
Mother: Manjit Kaur Bhullar
Acknowledgements
There are many people to whom I would like to acknowledge for their help and
support for my journey of the master thesis.
First and foremost I would pay my gratitude to my supervisor Dr. Ziad Kobti.
Under his guidance, I had enjoyed a lot working on my research work. It was a great
pleasure to work and discuss with him. Without his support, this won’t have been
possible. I would also like to appreciate the amount of time he invested in me, the
funding he provided and also the knowledge he shared with me.
In addition to this, many thanks to my committee members Dr. Pooya Moradian
Zadeh, Dr. Jill Urbanic and Dr. Mehdi Kargar for their valuable time and their
support. I would like to express my appreciation to Ms. Gloria Mensah, Ms. Karen
Bourdeau, and Ms. Margaret Garabon who always supported me when I needed
assistance in various academic issues.
I would like to thank my parents for their counsel and the sympathetic ear. They
are always there for me and support me in all possible ways. Next, I would like to
thank my sister who helped me a lot during my study with her wise counsel and her
knowledge.
I am also very thankful to my friends for their moral support and listening to my
problems for long hours.
Finally, I would like to thank God for unconditional love.
Contents
Declaration of Co-Authorship / Previous Publication iii
Abstract vi
Dedication vii
Acknowledgements viii
List of Tables xv
List of Figures xvi
1 Introduction 1
1.1 Problem Definition . . . 1
1.2 Thesis Motivation . . . 2
1.3 Thesis Statement . . . 5
1.4 Thesis Contribution . . . 5
1.5 Thesis Organization . . . 7
2 Related Work and Literature Review 9 2.1 Social Networks . . . 9
2.2 Social Network Analysis . . . 11
2.2.1 Application of SNA . . . 12
2.2.2 Various SNA Problems . . . 12
2.4 Graph Clustering . . . 25
2.4.1 Density Based clustering . . . 26
2.5 Unweighted graph clustering with SCAN . . . 26
2.6 Weighted graph clustering with WSCAN . . . 29
2.7 Evolutionary Computation . . . 30
2.7.1 Evolutionary Algorithms . . . 30
2.7.2 Genetic Algorithm . . . 31
2.7.3 Schema Theorem . . . 35
2.7.4 Cultural Algorithm . . . 36
3 Proposed Approach 41 3.1 Proposed Strategies to solve TFP . . . 41
3.2 Team Formation Problem (TFP): Definition . . . 42
3.3 Communication Cost . . . 42
3.3.1 Sum of distance function . . . 43
3.3.2 Diameter function . . . 44
3.4 Strategy 1 (S1) - WSCAN-TFP Weighted Structural Clustering Algo-rithm . . . 44
3.4.1 Definitions related to Strategy 1 (S1) . . . 47
3.4.2 WSCAN Definitions . . . 49
3.4.3 Proposed Solution/algorithm with Strategy 1 (S1) . . . 56
3.5 Strategy 2 (S2) - Genetic Algorithm (GA) . . . 57
3.6 Strategy 3 (S3) - Cultural Algorithm (CA) . . . 60
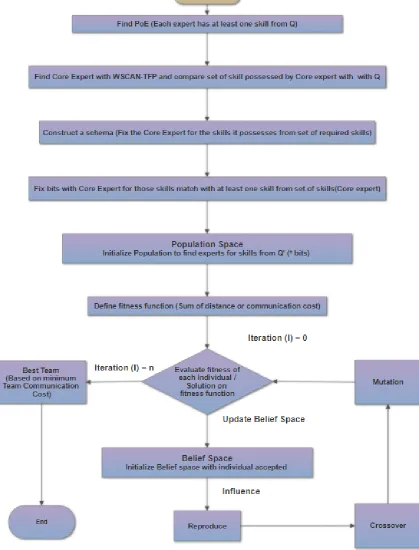
3.7 Strategy 4 (S4) - Hybrid Genetic Algorithm (HGA) using Schema . . 62
3.7.1 Definitions related to Strategy 4 (S4) . . . 62
3.7.2 Proposed Algorithm for Strategy 4 (S4) . . . 67
3.7.3 Schema Theorem - Definitions . . . 73
4 Experiments 80
4.1 Experimental Setup . . . 80
4.2 Methods to generate edge weight . . . 81
4.3 Non-knowledge based Approach . . . 82
4.4 Strategy 1 (S1) on 50K and 100K nodes network . . . 83
4.4.1 Experimental results for combination 1 (C1) with S1 . . . 83
4.4.2 Experimental results for combination 2 (C2) with S1 . . . 84
4.4.3 Experimental results for combination 3 (C3) with S1 . . . 85
4.4.4 Experimental results for combination 4 (C4) with S1 . . . 86
4.4.5 Experimental results for combination 5 (C5) with S1 . . . 87
4.4.6 Experimental results for combination 6 (C6) with S1 . . . 88
4.5 Knowledge based Approach . . . 89
4.6 Strategy 2 (S2) on 50K and 100K nodes network . . . 89
4.6.1 Experimental results for combination 1 (C1) with S2 . . . 89
4.6.2 Experimental results for combination 2 (C2) with S2 . . . 90
4.6.3 Experimental results for combination 3 (C3) with S2 . . . 91
4.6.4 Experimental results for combination 4 (C4) with S2 . . . 92
4.6.5 Experimental results for combination 5 (C5) with S2 . . . 93
4.6.6 Experimental results for combination 6 (C6) with S2 . . . 94
4.7 Strategy 3 (S3) on 50K and 100K nodes network . . . 95
4.7.1 Experimental results for combination 1 (C1) with S3 . . . 95
4.7.2 Experimental results for combination 2 (C2) with S3 . . . 96
4.7.3 Experimental results for combination 3 (C3) with S3 . . . 97
4.7.4 Experimental results for combination 4 (C4) with S3 . . . 98
4.7.5 Experimental results for combination 5 (C5) with S3 . . . 99
4.7.6 Experimental results for combination 6 (C6) with S3 . . . 100
4.8.1 Experimental results for combination 1 (C1) with S4 . . . 101
4.8.2 Experimental results for combination 2 (C2) with S4 . . . 102
4.8.3 Experimental results for combination 3 (C3) with S4 . . . 103
4.8.4 Experimental results for combination 4 (C4) with S4 . . . 104
4.8.5 Experimental results for combination 5 (C5) with S4 . . . 105
4.8.6 Experimental results for combination 6 (C6) with S4 . . . 106
4.9 Strategy 5 (S5) on 50K and 100K nodes network . . . 106
4.9.1 Experimental results for combination 1 (C1) with S5 . . . 106
4.9.2 Experimental results for combination 2 (C2) with S5 . . . 107
4.9.3 Experimental results for combination 3 (C3) with S5 . . . 108
4.9.4 Experimental results for combination 4 (C4) with S5 . . . 109
4.9.5 Experimental results for combination 5 (C5) with S5 . . . 110
4.9.6 Experimental results for combination 6 (C6) with S5 . . . 111
5 Discussions, Comparisons and Analysis 113 5.1 Comparison and Analysis . . . 113
5.2 Performance measurement with Communication Cost . . . 114
5.2.1 Communication cost with sum of distance function . . . 114
5.2.2 Comparison of C1 with S1, S2, S3, S4 and S5 . . . 114
5.2.3 Comparison of C2 with S1, S2, S3, S4 and S5 . . . 115
5.2.4 Comparison of C3 with S1, S2, S3, S4 and S5 . . . 116
5.2.5 Comparison of C4 with S1, S2, S3, S4 and S5 . . . 117
5.2.6 Comparison of C5 with S1, S2, S3, S4 and S5 . . . 118
5.2.7 Comparison of C6 with S1, S2, S3, S4 and S5 . . . 119
5.2.8 Communication cost with diameter function . . . 120
5.2.9 Effect of pool of experts (PoE) on results . . . 121
5.3.1 Empirical analysis-Average Fitness Score (AFS)- S2 (GA) and
S3 (CA) . . . 122
5.3.2 Average Fitness Score (AFS)- S4 (HGA) and S5 (HCA) . . . . 123
5.3.3 Empirical analysis-Average Fitness Score (AFS)- S2 (GA) and S4 (HGA) . . . 123
5.3.4 Empirical analysis-Average Fitness Score (AFS)- S3 (CA) and S5 (HCA) . . . 124
5.3.5 Empirical analysis-Average Fitness Score (AFS)- S1 and S5 . . 124
5.3.6 Percentage difference- S1, S2, S3, S4 and S5 . . . 124
5.3.7 Statistical analysis-AFS Comparison GA(S2)-HGA(S4) . . . . 126
5.3.8 Statistical analysis-AFS Comparison CA(S3)-HCA(S5) . . . . 128
5.4 Performance measurement with average processing time- S1, S2, S3, S4, and S5 . . . 129
5.5 Regression Analysis . . . 131
5.5.1 Exponential function . . . 131
5.5.2 Power function . . . 132
5.6 Limitations and Assumptions . . . 134
5.6.1 Schema template construction . . . 134
5.6.2 Parameter used for generating nodes network . . . 135
5.6.3 Evolutionary methods . . . 135
6 Conclusion and Future Work 136 6.1 Non-knowledge-based approach . . . 136
6.2 Knowledge-based Approach . . . 137
6.3 Future Work . . . 138
Bibliography 140
List of Tables
Table 2.1 Genetic Algorithm and Simulated Annealing with various
param-eters used to solve TFP . . . 33
Table 2.2 Cultural Algorithm used to solve TFP . . . 37
Table 3.1 Notations used for S1 . . . 45
Table 3.2 WSCAN notations used for S1 . . . 49
Table 3.3 Notations used for S4 and S5 . . . 63
Table 4.1 Different datasets from DBLP network . . . 81
Table 5.1 Average Fitness Score comparison for S1, S2, S3, S4, and S5 using semantically weighted graph with 100K nodes network . . . 122
Table 5.2 Showing data related to S2 and S4 for t-Test . . . 126
Table 5.3 Showing data related to S3 and S5 for t-Test . . . 128
List of Figures
Figure 2.1 Working of SCAN . . . 27
Figure 2.2 Processing of Genetic Algorithm . . . 32
Figure 2.3 Crossover operation in Genetic Algorithm . . . 32
Figure 2.4 Mutation operation in Genetic Algorithm . . . 33
Figure 2.5 Processing of Cultural Algorithm . . . 37
Figure 2.6 The effect of the threshold for wSCAN [41] . . . 38
Figure 2.7 Comparison of various algorithms for TFP with WSCAN for the project require five skills . . . 38
Figure 2.8 Comparison of the communication cost of a team of experts for various number of skills with different algorithms [41] . . . 39
Figure 3.1 Team formation problem with the example . . . 42
Figure 3.2 Direct and indirect connections in expert’s network . . . 43
Figure 3.3 Team (example) . . . 43
Figure 3.4 Communication cost based on the sum of distance function (example) . . . 44
Figure 3.5 Communication cost based on diameter function (example) . . 44
Figure 3.6 WSCAN-TFP (example) . . . 52
Figure 3.7 WSCAN-TFP (flowchart) . . . 56
Figure 3.8 Flowchart showing Genetic Algorithm (GA) for Team Forma-tion Problem . . . 59
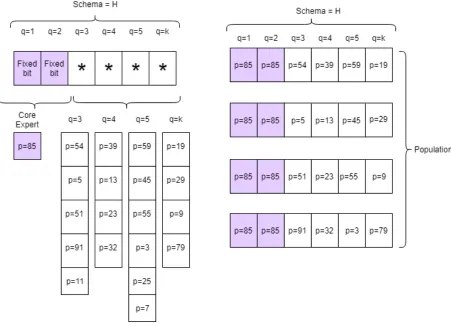
Figure 3.10 Example of Set of Required skills . . . 64
Figure 3.11 Expert with Set of skills . . . 65
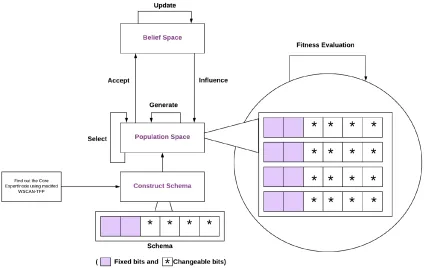
Figure 3.12 Framework of Hybrid Genetic Algorithm with Schema. . . 71
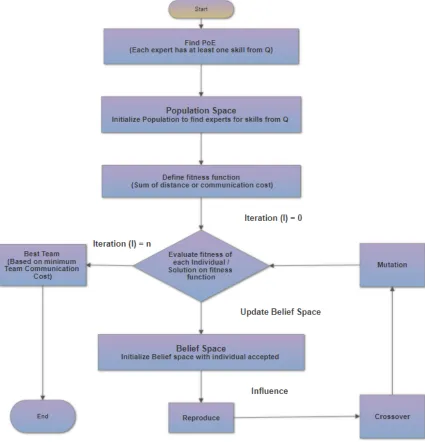
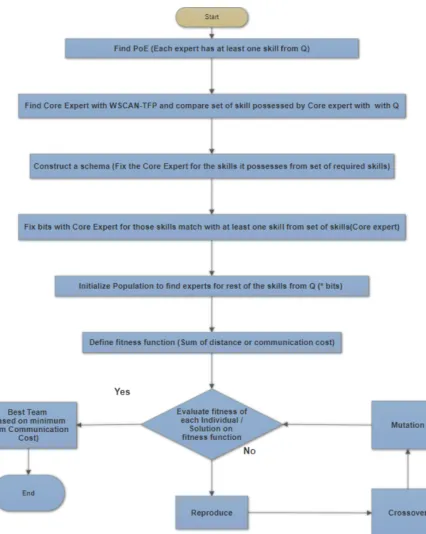
Figure 3.13 Flowchart of Hybrid Genetic Algorithm with Schema for TFP. . . 72
Figure 3.14 Working of schema template based approach with hybrid heuris-tic approach . . . 73
Figure 3.15 Hybrid Cultural Algorithm with Schema . . . 76
Figure 3.16Flowchart of Hybrid Cultural Algorithm. . . 77
Figure 4.1 S1 on combination 1 (C1) . . . 84
Figure 4.2 S1 on combination 2 (C2) . . . 85
Figure 4.3 S1 on combination 3 (C3) . . . 86
Figure 4.4 S1 on combination 4 (C4) . . . 87
Figure 4.5 S1 on combination 5 (C5) . . . 88
Figure 4.6 S1 on combination 6 (C6) . . . 89
Figure 4.7 S2 on combination 1 (C1) . . . 90
Figure 4.8 S2 on combination 2 (C2) . . . 91
Figure 4.9 S2 on combination 3 (C3) . . . 92
Figure 4.10 S2 on combination 4 (C4) . . . 93
Figure 4.11 S2 on combination 5 (C5) . . . 94
Figure 4.12 S2 on combination 6 (C6) . . . 95
Figure 4.13 S3 on combination 1 (C1) . . . 96
Figure 4.14 S3 on combination 2 (C2) . . . 97
Figure 4.15 S3 on combination 3 (C3) . . . 98
Figure 4.16 S3 on combination 4 (C4) . . . 99
Figure 4.17 S3 on combination 5 (C5) . . . 100
Figure 4.19 S4 on combination 1 (C1) . . . 102
Figure 4.20 S4 on combination 2 (C2) . . . 103
Figure 4.21 S4 on combination 3 (C3) . . . 104
Figure 4.22 S4 on combination 4 (C4) . . . 105
Figure 4.23 S4 on combination 5 (C5) . . . 105
Figure 4.24 S4 on combination 6 (C6) . . . 106
Figure 4.25 S5 on combination 1 (C1) . . . 107
Figure 4.26 S5 on combination 2 (C2) . . . 108
Figure 4.27 S5 on combination 3 (C3) . . . 109
Figure 4.28 S5 on combination 4 (C4) . . . 110
Figure 4.29 S5 on combination 5 (C5) . . . 111
Figure 4.30 S5 on combination 6 (C6) . . . 112
Figure 5.1 communication cost comparison for C1 with S1, S2, S3, S4 and S5 . . . 115
Figure 5.2 communication cost comparison for C2 with S1, S2, S3, S4 and S5 . . . 116
Figure 5.3 communication cost comparison for C3 with S1, S2, S3, S4 and S5 . . . 117
Figure 5.4 communication cost comparison for C4 with S1, S2, S3, S4 and S5 . . . 118
Figure 5.5 communication cost comparison for C5 with S1, S2, S3, S4 and S5 . . . 119
Figure 5.6 communication cost comparison for C6 with S1, S2, S3, S4 and S5 . . . 120
Figure 5.7 communication cost with diameter comparison for S1, S2, S3, S4 and S5 . . . 121
Figure 5.9 Average time-taken comparison for S1, S2, S3, S4, and S5 for
different set of required skills . . . 130
Figure 5.10 Regression analysis with exponential function . . . 132
Figure 5.11 Regression analysis for S5 . . . 133
Introduction
1.1
Problem Definition
Social Network Analysis (SNA) has many open problems to solve such as Team
Forma-tion Problem (TFP), Link PredicForma-tion, Leadership DetecForma-tion, Community DetecForma-tion,
Migration between communities, Influence Analysis, Sentimental Analysis,
Collabo-rative Recommendation, and Fraud Detection.
TFP involves finding an optimal solution to assemble a team to complete a task
(T), which has a set of k required skills denoted by some criteria. The team (X0) is selected based on the required skills from a set of experts denoted by (X) which have a set of skills [31]. The solution for TFP requires that members of (X0) not only meet the skill requirements of the task but can also work effectively together as a team. To
measure the effectiveness of the team, communication cost incurred by the subgraph
in G that only involves (X0) is used. Whereas, a set of required skills is a subset of a set of the total number of skills. Link prediction predicts missing links in current
net-works and new or dissolution links in future netnet-works [47]. Community detection can
prefer-ences to get associated in a social network leading to the formation of virtual clusters
or communities [10]. Communities undergo a transition that can be traced as
mi-gration between communities. Collaborative recommendation identifies users whose
tastes are similar to those of the given user and recommends items they have liked [8].
The scope of this thesis is focused on TFP because finding a team with the set of
required skills within minimum cost in a social network is a challenging task in SNA.
Finding teams in real life out of billions of people is very costly.
Previous studies about TFP aimed at finding a team and measure its performance
based on the communication cost with sum of distance, communication cost with
di-ameter, steiner tree method and minimum spanning tree method. They used one or
more than one parameters for nodes network graph such as communication cost,
per-sonnel cost, load balancing and expertise level with non-knowledge based approaches
in [5], [26], [27], [31], [34] and [37]. However, Genetic Algorithms are used recently
in [7], [6], [23] and [30]. Further, knowledge-based approaches such as Cultural
Al-gorithm and Genetic AlAl-gorithm are used to solve the problem in the most recent
research papers such as [41] and [42].
Some practical applications of TFP in SNA are Yahoo! Answers [1], LinkedIn,
Slashdot [18], GitHub [23], BitBucket[23], Kaggle and DBLP [41] [42].
1.2
Thesis Motivation
TFP in social networks is gaining importance in the fields of data mining and social
TFP is NP-Hard problem and as per best of our knowledge, it means no optimal
solution has been discovered to solve problem team formation in social networks. By
solving the problem of team formation, we can reduce computational cost as well as
a economic cost for finding a team from a huge and complex social network.
The motivation for this research is to find the better solution with evolutionary
computation approach to finding the best team with minimum cost based on sum
of distance function. There are so many approaches to test and compare the results
for TFP such as Random methods and Exact algorithm. Random methods always
select the team of experts randomly from the set of the experts which experts has the
lowest communication cost or edge weight between them. On the other hand,
Ex-act algorithm calculates the communication cost using exhaustive search [41]. ExEx-act
algorithm search is exponential and can take months for the bigger set of required
skills. Hence, it is not a feasible solution in reality. But, evolutionary computation is
a more suitable approach for finding near-optimal solutions by harnessing the
knowl-edge within the network. In addition to this, research also used greedy algorithms
to solve the problem. Greedy algorithm methods can find the solution, but their
performance is lower than GA and CA [41]. Moreover, greedy algorithms produce
locally optimal solutions rather than the globally optimal solution.
WSCAN-TFP algorithm worked faster than the evolutionary algorithms
coun-terparts, but it is of lower performance compared to CAs and GAs [41]. So, the
motivation for this thesis work is to develop the new hybrid approach with the help
of combining modified WSCAN-TFP for social networks, which has less processing
time (faster) and evolutionary computation algorithms (uses knowledge of network to
based on criteria explained above.
For the quality of the individual solution with proposed heuristics, we define
mul-tiple quality criteria based on communication cost (CC), average fitness score (top
n-teams) and average processing time. We utilize the advantage of the genetic
algo-rithm, cultural algoalgo-rithm, modified WSCAN-TFP algorithm and schema theorem to
find a method to solve the problem with the expectation of better quality individual
solution.
The reason behind using WSCAN-TFP is that clustering algorithms are proved
to be successful in another type of networking problems. Moreover, TFP in the social
network is similar to the network problems. We can take advantage of a
WSCAN-TFP algorithm based on structural similarity that it shows promising results on social
network graph for TFP.
Optimization is finding the best result by maximizing the desired factors and
min-imizing the undesired ones. Optimization problems are the problems to find the best
solution out of all the feasible solutions [12]. The optimization problem is applied to a
wide range of areas like energy utilization, supply chain management, job scheduling,
solving mathematical problems and much more [36]. Team Formation Problem is one
of the optimization problems. Evolutionary Computation (EC) algorithms proved to
be successful in optimization problems. EA optimizes the problem efficiently as it
contains the search space and searches for the best possible solution in it [45]. The
solutions can be either near optimal or optimal [36].
In addition to this, various non-knowledge based approaches have been proposed
solution hasn’t been achieved yet and more research is needed to utilize the benefits
of EC.
1.3
Thesis Statement
The objective of this thesis/research is to find out a group/a team of experts in a
network that covers all skills from a set required skills necessary to complete a project
and also minimizes the communication cost between team members. According to
previous authors team with less communication cost (sum of distance) is believed to
perform in an effective manner [31]. We are trying to find or form a better quality
team (term ”Team” is used for in TFP as an output (solution). However term
”in-dividual” is used in Evolutionary Algorithms as an output (solution)) with the help
of Evolutionary Computation concepts such as Schema theorem explained in detail
later on in chapter 2 and chapter 3.
We measure the quality of individual solution with the fitness function. The
fitness function, we defined it later on in definition 24 and equation 3.10 as a sum of
distance or communication cost and based on this fitness function F(x) we calculate communication cost (CC) with a sum of distance function and Average Fitness Score
(AFS) for ntop-teams. We expect to see low fitness score (fitter solution) and better speed with our proposed strategies.
1.4
Thesis Contribution
This thesis contributes two novel knowledge-based approaches to solve the TFP. The
first one is named as Hybrid Genetic Algorithm (HGA) and the second one is called
In addition to this contribution, it also includes a non-knowledge based approach
(a clustering method based on structural similarity) WSCAN-TFP to solve the team
formation problem. Moreover, the clustering method based on structural similarity
is first time used on social network and TFP in paper [41].
Moreover, to measure the quality of the individual solution, we defined quality
cri-teria with a couple of performance measurements. We consider various performance
measurements and these are communication cost(CC) with a sum of distance function,
average fitness score(AFS) for to n teams and average processing time of the novel approach Hybrid Cultural Algorithm (HCA) and Hybrid Genetic Algorithm (HGA)
mentioned above. We also implemented the Cultural Algorithm (CA) and Genetic
Algorithm (GA). However, the DBLP dataset with 50K and 100K nodes network are
used as a case study to measure the performance of all five different strategies. Later,
we compare the results of all five strategies by calculating percentage difference
(im-provement) in the fitness of the solution. We also conducted regression analyses for
HCA by increasing the size of the set of required skills to more than 1000 skills and
2000 skills.
These five strategies are as follow:
• WSCAN-TFP- strategy 1 (S1)
• Genetic Algorithm (GA)- strategy 2 (S2)
• Cultural Algorithm (CA)- strategy 3 (S3)
• Hybrid Genetic Algorithm (HGA)- strategy 4 (S4)
Moreover, HGA and HCA are able finds multiple teams/solutions. To calculate
the average fitness of multiple teams, we are using average fitness score based on
fitness function. But, fitness decreases as Fitness Score increases. However, we used
Average Fitness Score to calculate fitness based on fitness score of multiple teams
(top n-teams) found as a potential solution to the problem. We can choose a team with minimum fitness score, but if that team is not able to work in the future for
some unknown reasons. We can choose the second-best team to replace it.
1.5
Thesis Organization
The rest of the thesis/research work is organized in the following manner.
In chapter II, we discuss related work/literature review in the field of team
forma-tion problem (TFP) in a social network, SCAN, WSCAN, Evoluforma-tionary Computaforma-tion
(EC).
In chapter III, we introduce our proposed approach which makes it possible to
utilize clustering based on structural similarity to reduce the search space and utilize
the advantage of evolutionary methods.
Chapter IV, we explain our experimental setup. This chapter also presents the
experimental results and provides their analysis. We discuss the technical aspects of
our experimental setup.
In Chapter V, we are discussing the proposed approach and provides the
Chapter VI, concludes the research, explains insights received during the work
Chapter 2
Related Work and Literature
Review
This chapter consists of all the related work used for the building of the fundamental
concepts, developing the framework and architecture of our thesis. In this chapter, we
explain the literature related to Team Formation Problem(TFP), SCAN and its
vari-ants, Evolutionary Algorithms such as Cultural Algorithm and Genetic Algorithm,
and Schema Theorem by John Holland.
2.1
Social Networks
Social networks are the popular way to model the interactions among the people in
a group or community as per described by the John Scott in [40] book. They can be
visualized as graphs, where a vertex corresponds to a person or an expert in some
group, and an edge represents some form of association/relationship between the
cor-responding persons [40]. The associations are usually driven by mutual interests that
are intrinsic to any group or a community. John Scott in [40] describes a Social
and these social networks follow a complex pattern and form a complex system of
vertices and connections (edges) between them. A social network can be represented
by a weighted or unweighted graph [40]. Where, G=V, E represents an unweighted graph where V is the set of vertices (actors) andE is the set of edges (relations) [40] .
Moreover, the author writes that the social networks are ubiquitous and can be
created from various disciplines such as Sociology, Twitter friendship, LinkedIn
pro-file, protein network, etc. in [40]. Social networks are different from simple graphs.
However, these networks look the same as graphs, but it satisfies some characteristic
properties such as path distance (six degrees of separation), degree distribution and
clustered coefficient [40]. Development social network thinking can be traced back
to relational and structural approached to social analysis that developed in classical
sociology. However, some approaches to sociology and anthropology used the idea
of culture and cultural formation to demonstrate and explain social feelings, social
patterns, social behavior, and other social causes stressed the physical environment.
Furthermore, an important strand of social through only focuses on actual
pat-terns of interaction and interconnection through which individuals and social groups
are related to each other. In some cases, it is described as a social organism or social
system. In other cases, greater attention was given to face-to-face encounters through
which individuals relate to each other and constantly refigure through the actions of
these individuals. Frigyes Karinthy was the very first person who introduces the
con-cept of six degrees of separations in 1929, two randomly selected people in the world
are six steps away from each other. Stanley Milgram in 1960 experimented to find
the average path length and found it as 5.9. Moreover, degree distribution is another
the number of connection of a node with other nodes over the complete network. In
1965, Derek de Solla Price found that complex network had a heavy-tailed
distribu-tion following a power law distribudistribu-tion. But in 1999, Albert-Lszl Barabsi et al. said
that some nodes had many more connections than others, called the hub and they
used the term ”scale-free network” [9].
In addition to it, social networks as a complex network have another property
called as clustering coefficient[40]. Clustering coefficient is the tendency of nodes
clustering together and highlight the significance of the number of the triangles of the
network. By calculating local and global clustering coefficient, we can have an idea
of a node how likely to tie together with others and how tightly overall network be
together respectively [40].
2.2
Social Network Analysis
Social Networks Analysis (SNA) can be simply defined as the in-depth analysis of
social network structure, the tendency toward the time, the pattern of relationship
with social actors and the available data along with them [40]. Since social networks
are formed mostly with our environmental structure, researching on its primary
mea-sures such as closeness centrality, betweenness centrality, degree centrality, diameter,
etc. [40] will provide more powerful results which would be an innovative change in
the world [40]. To analyze a social network, we need to convert it into the graph with
nodes and edges, where nodes are social actors (can be a person, organization or any
other) and edges are the relationship between them [40]. The graph can either be
weighted or unweighted (Weight mostly decided based on the similarity of two nodes,
be either directed or undirected to [40]. Therefore, social network analysis uses the
graph theory concepts.
Another essential characteristic of the social network is that it shows dynamic
be-havior. The complex networks are said to be dynamic networks when their topology
changes over times. Real-world social networks, however, are not always static. In
fact, most popular social sites in reality (such as Facebook, Twitter, and LinkedIn)
evolve heavily and witness a rapid expansion regarding size and space over time. The
rapid and unpredictable changes of topological structure of the complex networks
make extremely complicated and yet challenging problems. For example, it helps
to analyze the spread of diseases [19], to detect terrorist activities [46], to observe
dynamic co-authorship networks [29] and many more researches applications in the
real-world.
2.2.1
Application of SNA
In recent years, SNA has been used in various disciplines in business, academics,
pol-itics, health care and daily life activities [40]. It is most commonly applied to help to
improve the effectiveness and efficiency of decision-making processes [40].Applications
of SNA are used in field such as Business, Law enforcement agencies (and the army),
Social Network Sites, Civil society organizations, Politics, Spread of Diseases, Health
care.
2.2.2
Various SNA Problems
Author of [40] writes that Social Network Analysis (SNA) deal with different issues.
Team Formation Problem, Link Prediction, Leadership Detection, Community
De-tection, Migration Between Communities, Sentimental Analysis, Collaborative
Rec-ommendation, Influence Analysis, Fraud Detection.
TFP is finding an optimal solution to find a team to complete a projectP, which has a set of k required skills denoted by as criteria. The team is selected based on the
required skills from a set of experts denoted by which have a set of skills denoted by
[31]. Whereas, a set of required skills is a subset of a set of the total number of skills.
Link prediction predicts missing links in current networks and new or dissolution links
in future networks[47]. Community detection can be defined as a finding people with
the tendency of similar tastes, choices, and preferences to get associated in a social
network leads to the formation of virtual clusters or communities [10]. Communities
transit and this transition can be traced as migration between communities.
Collabo-rative Recommendation identifies users whose tastes are similar to those of the given
user and recommends items they have liked [8].
However, this thesis is focused on TFP, because finding a team with the set of
required skills within minimum cost in a social network is a challenging task in SNA.
Finding teams in real life out of a billions of people is very costly and not feasible.
2.3
Team Formation Problem (TFP)
Lappas et al. (2009) in his work [31] proposed two communication cost functions
and used Rarest first and Enhanced Steiner algorithm to discover the team of experts
from a social network. Later, the problem was approached with generalized enhanced
Another method was proposed by Kargar and An (2011) who introduced a team with
the leader that minimize leader distance function and produce the top-k team in their
work [26]. Moreover, Gajewar and Sharma (2012) presented another cost function
based on density in the research paper [21]. Anagnostopoulos et al. (2010) ignored
the communication cost among experts while dealing with multiple projects to
mini-mize the maximum load of experts in his work [4]. Then again, Anagnostopoulos et
al. (2012) experimented in [5] by minimizing both load balance and communication
cost.
Kargar et al. (2012) assumed in [27] that every expert is associated with a cost to
perform an assumed task in a given project. By using the trade-off parameter in [27],
they combined two objective functions into one. Moreover, Kargar et al. (2013) found
the best team in [28] by minimizing the communication cost under given personal cost
budget. To solve this problem Kargar et al. (2013) found the set of Pareto teams in
[28]. Li et al. (2015) solved the problem of a team member becomes unavailable by
finding a replacement in [32]. Awal et al. (2014) proposed to find a team of experts
in the social network in his research [7] using collective intelligence index. They used
a random expert in [7] to optimize communication cost and expert level with
imple-mentation of the general genetic algorithm (GA).
Wi et al. (2009) evaluated two different selection methods in [50] to choose team
members and project managers in their work. They studied team formation in an
organization by using GA and the knowledge-based competence score of candidates
for a certain project in [50]. Reynolds in 1994 introduced cultural algorithms in his
work [38] . However, it was never used for team formation problem before. But
Recently, the authors applied cultural algorithms to find the better optimal solution
in [42] by extracting knowledge from the initial population and update to the next
population. It was a little better result compare to Genetic and Greedy Algorithms.
and compared its results with other algorithms. Genetic algorithm, Cultural
algo-rithm, Random algoalgo-rithm, Greedy algorithm and Exact algorithm results were used
as a baseline for comparison in [41].
Now, we will discuss some of the research paper mentioned above in detail.
Lappas et al. (2009) tried to solve the problem of team formation with a social
network. They described team formation problem [31] as Given a task T, a pool of individualsX with different skills, and a social networkGthat captures the compati-bility among these individuals, we study the problem of findingX0, a subset ofX, to perform the task. Following are definition from paper [31] Finding a team of experts
in social networks by Lappas et al. (2009).
Definition 1. (Problem definition: ) Given the set of n individuals X =
f(1...n), a graphG= (X, E), and taskT, and X0 ⊆X , so that C(X0;T) =T, and the communication cost Cc(X0) is minimized ([31]).
In [31] paper, author focused on two instantiations of communication cost.
How-ever, communication cost definition is not elaborated in the problem definition above
to make the definition more generalized.
First instantiation: Lappas et al. (2009) used diameter communication cost of
X0; denoted by Cc−R(X0) in this paper.
Diameter of a graph: In general definition, the diameter of a graph can be
described as a largest shortest path in between any two nodes. However, the authors
Diameter (R): Given graph G = (X, E), and a set of individuals X0 ⊆ X, di-ameter communication cost of X0, to be the diameter of the subgraph G[X0] [31].
Second instantiation: Lappas et al. (2009) used minimum spanning tree
com-munication cost ofX0; denoted byCc−M ST(X0) in [31] paper.
Cost of spanning tree: In general definition, cost of spanning tree can be
de-scribed as the cost of a spanning tree is simply the sum of the weights of its edges [31].
Minimum spanning tree (MST): Given graph G = (X, E), and a set of
in-dividuals X0 ⊆ X, minimum spanning tree communication cost of X0, to be the minimum spanning tree communication cost of the subgraph G[X0] [31].
Authors in paper [31] called Team formation problem with two communication
cost functions as mentioned above.
communicationf unction P roblemT F(T eamF ormation)
Cc−R Diameter−T F;Cc−R(X0)
Cc−M ST M ST −T F;Cc−M ST(X0)
Authors observed that RarestFirst, GreedyDiameter, EnhancedSteiner, and GreedyMST
produce approximately the same number of disconnected teams in the paper [31].
The author of [31] claimed to address the problem of forming a team of skilled
individuals to perform a given task while minimizing the communication cost among
the members of the team. The author in [31] claimed that teams formed by their
Greedy-Cover often fail to and a connected team, even in cases where such a team actually
exists. The results in [31] indicate that, although GreedyCover produces teams of
small size, the members of this team cannot communicate efficiently.
Anagnostopoulos et al. (2010) in [4] paper presented a general framework for task
assignment problems. Further, he provided a formal treatment on how to represent
teams and tasks. However, he proposed alternative functions for measuring the fitness
of a team performing a task and discussed desirable properties of those functions in
[4] and he also provided algorithms with provable approximation guarantees, as well
as lower bounds in [4].
In [4] paper, Anagnostopoulos et al. (2010) proposed the algorithmic tool to help
people collaborate efficiently. The author defines this problem in [4] as to assign tasks
Jj from a set J to teamsQj, which are subsets of people P so that teams are fit for
their tasks and the assignment is fair to people.
Symbol Def inition T asks(J) J =Jj;j = 1,2, ..., k
Skills Jj ∈S.
P eople(Pj) P =Pj;j = 1,2, ..., n
T eams(Q(j)) Qj ⊆P
Scoringf unction(s) s(q, J), s(,)∈[0,1]
LoadL(p) L(P) = |J;P ∈Qj|
In the table above author used the set of tasks (or jobs) J, which arrived off-line or on-line scenario and needed to be assigned to a team of experts in [4]. Each task
requires a set of skills. Skill space (S) that is the possible way of combining skills to
down as P = Pj;j = 1,2, ..., n [4].People possess a set of skills and their profile is
represented by a point in the skill space: Pj ∈ S and tasks for individual Pj
i.
Mea-surement the performance of the team for the task using a scoring functions(q, J) [4]. It measures complete failure as a 0 and complete success as 1. s(,)∈[0,1]. Moreover, It is needed to assign a task to a team to be completed [4]. Hence Qj ⊆P assigned
to jth task. Moreover, the skills of each team represented by skill space; Qj ∈ S. load L(p) of a person p, which is the number of tasks in which particular individual participates. It is described asL(P) =|J;P ∈Qj[4].
To explain the concept in the real world, let's take an example; We want to assign
team members for an operation. For instance, this operation needs a nurse, a surgeon,
and an anesthetist to complete the operation. However, the operation can not take
place if any of expert with a specific skill is not found. This is the simplest general
example we are taking to make the concept easy to understand.
In paper [4] algorithm picks the team of minimum size among those that have all
of the required skills for specific given task. In paper [4] heuristic tries to minimize
the size of the teams, it does not keep track of the work done so far and can overload
the few experts that possess most of the skills. The author claimed in [4] to have
better results in both theoretical and experimental with the greedy methods for an
on-line scenario. That can be effective in practice, as long as they consider both team
sizes and workload of members.
In [26], the authors focused on the issue of finding a group of specialists from an
informal community. Given a task whose fulfillment requires an arrangement of
ap-titudes, Author located an arrangement of specialists that together have most of the
them in [26]. However, author proposed two correspondence cost capacities intended
for two sorts of correspondence structures. They demonstrated in [26] that the issue
of finding the group of specialists that limits one of the proposed cost capacities is
NP-hard. In this way, an estimation calculation with an estimation proportion of
two is planned by authors in [26]. They presented the issue of finding a group of
specialists with a pioneer/leader in [26]. The leader considered in [26] as in charge
of checking and organizing the venture, and in this way, an alternate correspondence
cost work is utilized as a part of this issue.
Shortcomings of previous work in this area only found one single best answer. The
author presented in his paper [27] that two procedures that enumerate top-k teams of
experts with or without a leader in polynomial delay. Authors of [27] introduced two
new cost functions. They consider two types of communication structures/functions
within a team. They supposed that each required skill corresponds to a task in the
project [27]. However, in the first communication structure, the experts for each
pair/set of required skills need to communicate with each other to complete the
cor-responding tasks in [27]. For such a structure, author in [27] defined a cost function
that they called it Sum of Distances.
Moreover, to calculate the communication cost of a team using the sum of the
short-est distances between the experts for each pair of skills used by the author in [27]. In
the second type of communication structure/function author mentioned in [27] that
a leader needs to communicate with each team member to track and coordinate the
project. For such a structure author defined by [27] gave a cost function and called
it Leader Distance. However, it computed the sum of the shortest distances between
the leader and each skill holder in the team.
leader. The author claimed to propose an effective and scalable method on large real
data. The author claimed in [27] to have the following contribution in this paper.
The author proposed two new functions in [27] for measuring the communication
cost of a team of experts in social networks. 1. Sum of Distances 2. Leader Distance
Author proved in [27] that the problem of finding a team of experts that minimizes
the Sum of Distances function is NP-hard. The author introduced in [27] that the
problem of finding a team of experts with a leader that minimizes the Leader Distance
function. The author in [27], enumerated top-k teams of experts with or without a
leader in polynomial delay.
However, In [28] paper, Author extended their previous a work of previous
pa-per [27] in this papa-per. To enhance, they defined a new combined cost function in
[28] paper, which is based on the linear combination of the objectives 1.
commu-nication and 2. personnel costs. They showed that the problem of minimizing the
combined cost function is an NP-hard problem in team formation problem in [28]
pa-per. Therefore, an approximation algorithm is used in [28] paper to solve the problem.
The author in [28] proposed four algorithms for finding a team of experts in a
social network that minimizes both the communication cost and the personal cost of
the team. The author in [28] used an approximation algorithm with a provable
per-formance bound as a rst algorithm and for the other three algorithms use heuristics
to nd sub-optimal solutions. The author claimed to have better results in [28]. The
author said that proposed methods in [28] are much faster than the Random and
Exact methods and Random method has the highest cost.
multiple skills and a social network G(V, W) reflecting the compatibility among the experts, team formation is the problem of identifying a team C ⊆ V that is both competent in performing the task T and compatible in working together.
In [37] paper, they proposed a new approach based on an older approach called
Densest Subgraph Problem (DSP) with cardinality constraints. However, this is an
NP-hard problem, but it has many applications in real-world social network analysis.
They proposed the new method in [37] that can solve (approximately) the
General-ized Densest Subgraph Problem (GDSP). Experiments conducted by the author in
[37] shows that proposed formulation GDSP is useful in modeling a broader range of
team formation problem and it produced more coherent and compact teams of high
quality.
Author experimented using DBLP data in [37], they choose four fields of computer
science stream.
Fields
• Databases (DB)
• Theory (T)
• Data Mining (DM)
• Artificial Intelligence (AI)
Conferences that author considered in [37] for each field are given as follow:
• DB = SIGMOD, VLDB, ICDE, ICDT, PODS
• T = SODA, FOCS, STOC, STACS, ICALP, ESA
• DM = WWW, KDD, SDM, PKDD, ICDM, WSDM
• AI = IJCAI, NIPS, ICML, COLT, UAI, CVPR
Selected skills
• A = DB, T, DM, AI
Any author who possesses at least three publications in any of the above 23
con-ferences was considered expert for the experiment in [37]. In this experiment using
DBLP co-author data a graph was generated, where, a vertex corresponded to an
expert and an edge between two experts indicate prior collaboration between them.
The weight of the edge is the number of shared publications considered as an edge
weight for the experiment in [37].
The author in [37] claimed to find qualitatively better teams that were more
com-pact and have higher densities than those found by the greedy method. However,
linear programming relaxation not only allowed to check the solution quality but also
provided a good starting point for our non-convex method [37]. The author tested
results in [37] with the greedy algorithm and claimed to get better results. However,
he also mentioned a potential downside of a density-based approach is that does not
guarantee connected components. A further extension of his approach could aim at
incorporating connectedness or a relaxed version of it as an additional constraint [37].
The author claimed to find the optimal solution in [37] with the implementation of
for the above example, but it may not provide an optimal solution for all problems [37].
Authors in [20] presented a mathematical framework for treating the Team
Forma-tion Problem by explicitly incorporating Social Structure (TFP-SS). The formulaForma-tion
of this mathematical framework relied on modern social network analysis theories
and metrics. Moreover, in [20] paper to solve TFP from a given a pool of individuals,
the TFP-SS assigned them to teams to achieve an optimal structure of individual
attributes and social relations within the teams. The author in [20], explored
TFP-SS instances with measures based on such network structures as edges, full dyads,
triplets, k-stars, etc., in undirected and directed networks.
Shortcomings of previous research papers according to the author in [20] were
solving most problems and addressed by observations, experiments, and basic
statis-tical methods. The author in [20] justified the use of mathemastatis-tical programming and
optimization techniques in the area of social science. The author used the various
graph-based diagram (mathematical approach) for social network theories and
pro-posed LK-TFP algorithm in [20] paper. Author used LinKernighan-TFP (LK-TFP)
heuristic in [20] that performs variable-depth neighborhood search. In [20] paper,
the author described LK-TFP as a tree search procedure and made the contribution
as LinKernighan TFP (LK-TFP) algorithm for solving TFP-SS, based on variable
depth-first neighborhood search.LK-TFP traverses the tree to arrive at such a
tran-sitive solution that improves the objective function [20].
Author of [20] paper described tree traversal in detail: the root node represents
one individual with minimum quality to be a team member [20].
The author in [20] paper claimed to Identify good branches of the tree and avoids
visiting too many non-improving solutions by cutting off the search space. The author
claimed to have the high-quality solution with use of mathematical programming and
optimization techniques in the area of social science in [20] paper.
The author in [52] formulated three ranking objectives to optimize
communica-tion cost, skill holder authority, connector authority and combinacommunica-tions of them. The
author in [52] paper proved that optimizing these objectives is an NP-hard problem.
Moreover, the author jointly considered communication cost and expert authority to
find out the pureto optimal teams. The author presented an algorithm in [52] to
optimize communication cost over an expert network G and a transformation that moves authority (node weights) onto the edges of a new graph G0 and proved that their algorithm also optimized the other objectives over G0.
They performed a comprehensive evaluation using the DBLP dataset to confirm the
effectiveness and efficiency of their approach in [52].
The table shows Team Formation Problem (TFP) with the various approach in
Author [year] CC−R CC−Steiner CC−SD CC−LD Algorithm/ Approach
Lappas et al., 2009 [31] Y es − − − RarestF irst
Lappas et al., 2009 [31] − Y es − − EnSteiner
Kargar et al., 2011 [26] − − Y es − M inSD
Kargar et al., 2011 [26] − − − Y es M inLD
Kargar et al., 2012 [27] − − Y es − M CC, ItReplace
Majumder et al., 2012 [34] Y es − − − M inDiaSol
Majumder et al., 2012 [34] − Y es − − M inAggrSol
Anagnostopoulos et al., 2012 [5] Y es − − − LBRadius
Anagnostopoulos et al., 2012 [5] − Y es − − LBSteiner
CC-R (communication cost with diameter function): Author in [31], [34] and [5]
used the diameter of the team (diameter is longest shortest distance) to calculate
communication cost. CC-Steiner (communication cost with Steiner tree): Author
in [31], [34] and [5] used Steiner tree method to calculate communication cost for
different teams. CC-SD (communication cost on the sum of distance function) :
Author in [26] and [27] used sum of distance function to calculate communication
cost for the team. Where sum of distance function is a summation of all edge weights
connecting team member nodes.
2.4
Graph Clustering
Clustering can be defined as grouping together one type of elements into a group.
With clustering, we can produce as many as groups based on characteristics of the
elements under consideration. Moreover, Network clustering (or graph partitioning)
is an important task for the discovery of underlying structures in networks [51].
Methods of Clustering can be divided into following categories:
• Hierarchical based clustering
• Partitioning based clustering
• Grid-based clustering
2.4.1
Density Based clustering
In the density-based clustering method, grouping is done based on highly connected
nodes in a graph. All highly connected vertices are identified and made a cluster.
Example: DBSCAN (Density-Based Spatial Clustering of Applications with Noise),
AHSCAN, DHSCAN, SCAN.
DBSCAN algorithm was proposed for clustering spatial data with noise. Because of
its unique features, this algorithm became rapidly popular in various field and
ap-plication of this algorithm includes in the field of science as grouping spatial civil
infrastructure network, chemistry, spectroscopy, medical diagnosis based on medical
images (brain atrophy, skin lesions) and social science (pheromone data) [44]. It can
also be applied on remote sensing to perform segregation of 3D images.
The disadvantage of DBSCAN algorithm was that it failed to determine when the
border elements of two clustering are relatively too close. Later, Structural
Cluster-ing Algorithm for Networks was proposed by [51]. This algorithm can cluster densely
connected as well as weakly connected nodes with hubs. They describe hubs as those
nodes which are connected to more than one cluster.
2.5
Unweighted graph clustering with SCAN
In the research paper [51], the author proposed a new method to cluster a network
undirected graph based on structural similarity. Hence, author named it as Structural
Clustering Algorithm for Networks(SCAN). It detects clusters, hubs, and outliers by
using the structure and the connectivity of the vertices as clustering criteria [51].
This algorithm finds Core node out of network. The Core node is chosen based on
the number of neighbors in its neighborhood are structurally similar. Later, by
con-sidering this Core node as the seed for the cluster, it builds up cluster around it. This
approach divides the graph into three parts: Clusters, Hubs, and Outliers.
Figure 2.1: Working of SCAN in research paper [51].
Formal definitions used by the author in [51] are described below for
the reference.
Definition 2. (Vertex structure)
Let v ∈V, the structure of v is defined by its neighborhood, denoted by τ(v) [51].
τ(v) =u∈V ∨(u, v)∈V} ∪ {u} (2.1)
Definition 3. ( - Neighborhood )
N ={u∈τ(v)|σ(u, v)≥} (2.2)
Definition 4. (Structural similarity)
Structural similarity of two vertices/ Experts will be large if they share a similar structure of neighbors. A minimum (threshold) value of structural similarity is introduced by this definition[51].
σ(u, v) =p|τ(u)∩τ(v)|
|τ(u||τ(v|) (2.3)
Definition 5. (Core)
A vertex v ∈V is called a core with reference to and µ, if its −neighbourhood
contains at least µvertices [51]. Core vertices are a special class of vertices that have a minimum of µ neighbors with a structural similarity that exceeds the threshold
[51].
Core,µ(v)↔ |N| ≥µ (2.4)
Definition 6. (Direct structure reachability)
Two non-core vertices in the same cluster may not be structure reachable because the core condition may not hold for them [51].
DirREACH,µ ⇐⇒ Core,µ(v)∧u∈N(v) (2.5)
The search begins by first visiting each vertex once to find structure-connected
clusters and then visiting the isolated vertices to identify them as either a hub or
performs one pass of a network and finds all connected clusters for given parameter
settings. In the beginning, all vertices are labeled as unclassified [51]. The SCAN
algorithm classifies each vertex either a member of a cluster or a nonmember. For
each vertex that is not yet classified, SCAN checks whether this vertex is a core
[51]. If the vertex is a core, a new cluster is expanded from this vertex. Otherwise,
the vertex is labeled as a non-member[51]. SCAN begins by inserting all vertices in
−neighborhood of vertex v into a queue [51]. For each vertex in the queue, it com-putes all directly reachable vertices and inserts those vertices into the queue which
are still unclassified [51]. This is repeated until the queue is empty[51].
A network is sets of vertices, representing objects, connected together by edges,
representing the relationship between objects[51]. For example, a social network can
be viewed as a graph where individuals are represented by vertices and the friendship
between individuals are edges [48].
2.6
Weighted graph clustering with WSCAN
Every graph edge may have a positive number associated with it, which is usually
called edge weight or capacity [13]. Algorithm mentioned above have one common
property - it targets unweighted graphs. However, When provided with a weighted
graph, any of the algorithms mentioned above will simply ignore the edge weights
and will perform clustering based on structural properties of the graph. While this
might be acceptable in certain cases, sometimes it is completely inadmissible [14]. To
overcome this problem author of [14] research paper and [13] thesis research work,
proposed a new algorithm called Weighted Structural Clustering Algorithm for
Net-works (WSCAN) as a solution to perform clustering in weighted graphs based on
Definition 7. (Extended Structural similarity)
v, u ∈ V and function below shows structural similarity in a graph with e(u, v)
edge weight between node v and u [14], [13].
σ(u, v) =p|τ(u)∩τ(v)|
|τ(u||τ(v|)e(u, v) (2.6) In equation 2.6 shows that extended structural similarity of two vertices will be
large if they share a similar structure of neighbors. A minimum (threshold) value of
structural similarity is introduced by this definition [14], [13].
2.7
Evolutionary Computation
Evolutionary Computation (EC) is sub-branch of artificial intelligence (AI), which
is used for metaheuristic and stochastic optimization of complex problems. It is the
set of evolutionary algorithms which are inspired by the biological model of
evolu-tion [45]. The algorithms that come under this secevolu-tion adopt Darwin’s principles of
Evolution; hence, they are called Evolutionary Algorithms [45]. Technically
speak-ing these algorithms can be considered as Global optimization problems accordspeak-ing to
Kybernetes (1998) mentioned in research work [45].
2.7.1
Evolutionary Algorithms
Evolutionary algorithms (EA) has been used widely by the researchers to solve the
optimization problems. EA optimizes the problem efficiently as it contains the search
either near optimal or optimal. EA allows the exploration and exploitation of the
search space. Exploration helps to search the whole space and exploitation helps
the solution to mutate and generate offspring [36]. Evolutionary algorithms (EA)
is a subset of EC, and hence they are also considered as optimization algorithms.
The common underlying concept in each evolutionary algorithm is the same. Given
a set of the population under environmental pressure causes natural selection [36].
The function measures the of the candidates, and the better candidates survive for
the next generation, discarding the worst ones [36]. Evolution of every individual is
carried out by applying mutation and recombination operators on it [36].There are
various algorithms which come under EC, such as:
1. Genetic Algorithms
2. Cultural Algorithms
3. Differential Evolution
4. Particle Swarm Optimization
5. Ant Colony Optimization Algorithm
2.7.2
Genetic Algorithm
Genetic Algorithms (GA) are a subset of EA; hence they are population-based
evolu-tionary algorithms. Genetic Algorithms were introduced by Holland [25] but became
popular after the works of Goldberg [11]. Genetic Algorithm is prominently used to
resolve the search related and other optimization problems. They are very helpful
to search solution, even when very less is known about the domain [36]. Genetic
Algorithm is consisting of a group of individuals known as population [36]. However,
space [36]. An initial random population is generated over the search space and
evolu-tionary operators like mutation, recombination and selection are applied to them [36].
Figure 2.2: Processing of Genetic Algorithm [33]
Author [year] Algorithm/Method Approach and Parameters Wi et al., 2012 [50] Genetic Algorithm Fuzzy inference system Dorn et al., 2010 [18] Simulated Annealing Expert level and communication cost
Ani et al., 2010 [6] Genetic Algorithm Balanced programming skills among team members Agustin et al., 2012 [2] Genetic Algorithm Parallel hybrid model
Awal et al., 2014 [7] Genetic Algorithm Collective Intelligence Index, communication cost Han et al., 2017 [23] Genetic Algorithm Communication cost and geographical distance Selvarajah et al., 2017 [42] Genetic Algorithm Communication cost
Selvarajah et al., 2018 [41] Genetic Algorithm Communication cost
Table 2.1: Genetic Algorithm and Simulated Annealing with various parameters used to solve TFP
Figure 2.4: Mutation operation in Genetic Algorithm [33]
In Genetic Algorithms after each generation, the best individuals are selected for
mutation, recombination, selection, and crossover [36]. The individuals also exchange
knowledge among them by using these operators [36]. Genetic Algorithm is
sim-ple to code, and the population is not initialized at one point. Instead, they are
spread across the search space for exploration [36]. Genetic Algorithms use mutation,
crossover, and selection operator to achieve an optimal solution and enhance
explo-ration and exploitation [36].
In [18], the author used two parameters that are Expert level and
communica-tion cost to find a team. The author evaluated team formacommunica-tion mechanism with a
is a well understood and rich data set [22] describing a large user community. The
author describes that users submit information technology related news items which
the editors decide to publish or not. Later, this news falls into multiple categories
(i.e., subdomains) such as Linux, apple, or games [18]. A published piece of news
becomes a story which all users–anonymous or logged–in can comment on [18]. These
comments create a posting hierarchy. Slashdot exhibits the characteristics of a
large-scale expert network [18]. The author discusses in [18] that optimal team composition
that requires a trade-off between skill coverage and expert connectivity. The author
claimed to demonstrate the benefit of our heuristic for finding well-connected experts
that simultaneously yield a high expertise level in a social network in [18] .
The author used two parameters that are geographical distance and
communi-cation cost in [23] to find a team of experts. In [23], the author claimed the first
parameter that the proposed GA based model achieves better performance with the
sum of geographical proximity evaluation metric, whereas the random algorithm gets
the worst. The author mentioned in the research paper that GA based model achieves
better results because the GA-based model considers the sum of geographical
prox-imity during the process of finding an optimal team in [23] paper. For the second
parameter, the proposed GA-based model also achieves better performance on the
sum of the communication cost evaluation metric, whereas the and random
algo-rithm performed worst. This is because the GA-based model has a larger search
space while MCC-Rare algorithm and approximation rare algorithm has a smaller
one [23]. The random algorithm does not consider the sum of communication cost
factor [23].
In [41], the author finds a team of the experts from a social network by taking
![Figure 2.3: Crossover operation in Genetic Algorithm [33]](https://thumb-us.123doks.com/thumbv2/123dok_us/1350232.1167901/52.612.145.497.152.440/figure-crossover-operation-in-genetic-algorithm.webp)
![Figure 2.5: Processing of Cultural Algorithm [39]](https://thumb-us.123doks.com/thumbv2/123dok_us/1350232.1167901/57.612.119.520.201.441/figure-processing-of-cultural-algorithm.webp)
![Figure 2.7: Comparison of various algorithms for TFP with WSCAN for the projectrequire five skills [41]](https://thumb-us.123doks.com/thumbv2/123dok_us/1350232.1167901/58.612.138.503.384.611/figure-comparison-various-algorithms-wscan-projectrequire-ve-skills.webp)