Image Processing Based Approach for
Automated Detection of Chronic Leukemia
Neha Sharma1, Dr Supreet Kaur2
M.Tech Student, Dept. of CSE, Punjabi University Regional Centre for Information Technology and Management,
Mohali, Punjab, India1
Assistant Professor, Dept. of CSE, Punjabi University Regional Centre for Information Technology and Management,
Mohali Punjab, India2
ABSTRACT: One of the very well known types of leukemia is chronic lymphocytic leukemia. In chronic lymphocytic
leukemia the bone marrow produces/makes too many lymphocytes/WBC. The leukemic lymphocytes looks like normal lymphocytes as there is little difference in both. There is very less work done on this type of leukemia. This paper presents an image processing method for automated detection of chronic lymphocytic leukemia. For the segmentation of cells Otsu’s thresholding method is used as it is easy and best method for segmentation. The proposed approach
obtained the accuracy 97.9%. The method is implemented using MATLAB®.
KEYWORDS: Chronic lymphocytic leukemia (CLL), WBC’s, Otsu’s thresholding, Support Vector Machine (SVM),
Artificial Neural Network (ANN).
I. INTRODUCTION
CLL is a bone marrow and blood disease which gets worse slowly over time. CLL is the one of the most common type of cancer in adults [1].Human body makes stem cells (immature cell) that become mature cell over time. A stem cell may become a lymphoid stem cell or myeloid stem cell. In CLL many stem cell become leukemic lymphocytes. They do not become healthy white blood cell. As there is increase in number of abnormal lymphocytes, the normal lymphocytes are not able to fight against infections and other disease. Being a common type of cancer there is very less number of studies done on automated detection of chronic lymphocytic leukemia from blood microscopic images.
Accurate segmentation of lymphocytes from blood microscopic images is required to aid in the early detection and diagnosis of chronic lymphocytic leukemia. Segmentation is the process of accurately labelling the different parts of cell.
Automated detection of leukemia consists of different steps:
1) Acquisition of microscopic blood smear images
2) Preprocessing of the images
3) Segmentation of the images
4) Extraction of the features
5) Classification
In this paper we mainly focus on segmentation, feature extraction and classification using SVM and ANN.
II. RELATED WORK
Emad A Mohammed et al. [2] proposed a method for segmentation of chronic lymphocytic leukemia by using
watershed algorithm and optimal thresholding. They segmented the normal and CLL lymphocytes into two categories i.e. nucleus and cytoplasm. The main motive of this work is to reduce the over and under segmentation error of watershed algorithm. From pixel to pixel subtraction the cytoplasm mask can be accurately driven by subtracting the nucleus mask from the whole cell mask.
In [3] authors focus on color cell segmentation of lymphocytes using Support Vector Machine and K-mean clustering algorithm. The morphology of CLL cells and normal lymphocytes may be similar and require a haematologist examination for diagnosis of CLL. The proposed algorithm overcome the occlusion problem when lymphocytes that are tightly bound to the surrounding RBC’s.
In [4] authors presented a technique for classifying a lymphocytic cell nucleus by using two shape features i.e. Hausdorff dimensions and contour signature. For classification of cells the support vector machine is used. The paper
mainly concentrates on measuring the irregularities of nucleus boundary by using these two methods. In[5] presented a
method to differentiate between the normal lymphocytes and acute lymphoblastic leukemia (ALL).The main focus of this work to find out the useful features that can help in classification and recognition of cells.
R.Hasan et al. [6] proposed a method for classification of blasts in acute leukemia into two major type’s i.e. acute lymphocytic leukemia and acute myelogenous leukemia by using the K-nearest neighbour. Different features like shape, color based and size are extracted from blood images. The K-nearest neighbour produced good performance in classification of acute lymphocytic leukemia and acute myelogenous leukemia and obtains the accuracy up to 86%.
Subrajeet et al. [7] proposed a technique for automated cell nucleus segmentation and detection of acute leukemia in
blood microscopic images. Various features (nucleus shape, texture) are extracted for final classification of acute leukemia. In proposed technique the Hausdroff dimensions and contour signatures are implemented for classifying a lymphocytic cell nucleus. For final classification support vector machine is used.
Fatma et al. [8] proposed a method for quick classification of leukemia images into their respective types. For
classification of cells the different features are extracted from input images and based on these features the dataset is created and this dataset is used as input to the neural network for training. In [9] proposed an image processing method for classification and recognition of leukemia cells. The main steps of proposed method are segmentation of the cell using watershed algorithm, automatic feature generation and final step is recognition and classification of cell. The support vector machine is used as classifier.
In [10] authors presented a method for nucleus segmentation followed by feature extraction such as shape feature of nuclei (area, perimeter).Otsu’s thresholding method produce the good segmentation results. This method is
elements i.e. nucleus and cytoplasm. For segmentation of nucleus and cytoplasm the efficient technique K-mean clustering is proposed. The method is found more suitable for segmentation of complex WBC’s images.
In [12] authors proposed an image processing method for cancer cell prediction in blood microscopic images. The important point of proposed method is segmentation of the image using watershed algorithm, extraction of individual cells, feature generation and application of support vector machine for final classification of cell.
Farnoosh et al. [13] proposed a framework for segmentation of white blood cells in blood microscopic images using
digital image processing. The main aim of this paper is to segment white blood cell into nucleus and cytoplasm. The nucleus segmentation is based on morphological analysis and cytoplasm segmentation is based on pixel-intensity thresholding. The proposed method obtained 92% accuracy for nucleus segmentation and 78 % accuracy for cytoplasm. In [14] authors proposed a framework for automatic extraction of the growth of the disease to provide alternative solution. The results are compared with the manual results. They obtained the accuracy up to 93.63%.
Hossein et al. [15] proposed an approach for recognition and classification of the cancer cells by using digital image
processing and LabVIEW. Proposed technique also counts the total number of the infected cells. The main aim of this study was segregation of the cells. The proposed technique can be used on large scale examinations and it is very helpful for the haematologist. In [16] described the preliminary study for developing a detection of leukemia using microscopic blood images. The main focus of the system was on the white blood cell disease like leukemia. The system uses the features like texture, geometry, color and statistical analysis of the microscopic images .Then these features are used as input to the classifier.
III.PROPOSED ALGORITHM
The main aim of the work we have proposed is to introduce a detection method to detect chronic lymphocytic leukemia as not much work has been done in this field. These are the various steps involved in automated detection of chronic leukemia.
Step 1: Image Acquisition: Chronic Lymphocytic Leukemia Images collected from a Medicos Centre, Chandigarh and
slides of chronic leukemia are collected from PGI Chandigarh.
Step 2: Image Preprocessing: Before the images of these slides can be used for classification of CLL from normal
blood cell, there was a requirement to capture a single cell from the whole slide. It was done in order to train a classifier on various shape parameters of blood cell sample other that the whole slide which required an extra step of ROI detection and segmentation.
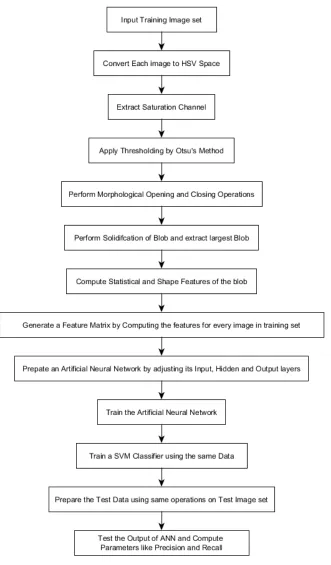
Step 3: Color Space Conversion: After analyzing the slide image of blood cell, it was clear that a color space
conversion is needed in order to extract the blood sample from the rest of the slide. We applied Otsu’s Method after intensity normalization in order to automatically segment the blood cell from the slide. The binary image extracted from this step is processed further to create a mask.
Figure 2 shows the conversion of an RGB image to an HSV image. As seen, the HSV color space provides more distinctive line between the blood cell and background of slide.
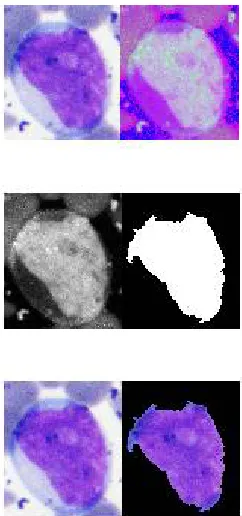
Step 4: Masking and ROI extraction: Once the image mask is extracted from thresholding of Saturation Channel of HSV image, the mask is further processed to remove small pixels like noises and holes are filled for closed contours.
Fig 4: Intermediate step for Mask Extraction
Above figure 4 shows an intermediate step of mask extraction. The saturation channel is gone through histogram equalization. Then, the Otsu’s Method is applied. This method cleanly extracted the ROI
Step 5: Computing Shape and Statistical Features: After the Blood Cell is extracted successfully from the image, the
different shape and statistical features are computed in order to train an Artificial Neural Network and a Support Vector Machine. The shape features are area, perimeter, centroid and statistical feature are weighted centroid and mean intensity.
Step 6: Training of Artificial Neural Network and Support Vector Machine: To train our classifiers, the total dataset
is first divided into sets of training and testing datasets. The step is performed by using cross validation index finding and using “holdout” method with 80% data hold for testing and 20 % training set.
Step 7: Testing of Classifiers and Generating the Results: This is the final step, hold 80% of dataset is used for
testing. The results were taken in form of different parameters i.e. specificity, recall, precision rate.
IV.EXPERIMENTAL RESULTS
The proposed technique has been applied on 60 blood smear images of normal lymphocytes and chronic lymphocytic
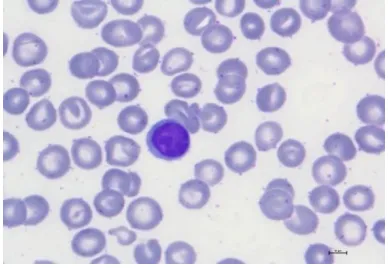
leukemia obtained from the Medicos centre. A microscopic blood image size 2560*768 is considered for estimation. In our experimentation, 60 blood images from chronic lymphocytic leukemia and normal lymphocytes were captured using Nikon Eclipse E200 system. The proposed algorithm processes all the 60 images which are provided to the system. Figure 5 shows the original image of chronic lymphocytic leukemia and normal lymphocytes captured with the Nikon system.
.
The figure 6 shows the manually segmeted cell.Our main work is not segmentaion that is why we have used manually segmentation here to extract the single leukemic cell from the complete image.Then the manully segmented cell is used for feature extraction.The various features like area,perimeter,centroid,mean intensity etc are calculated from the segmented image.
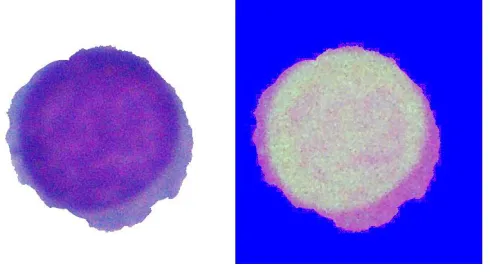
Figure-6: a) CLL b) Normal Lymphocyte
Support vector machine and artificial neural network is used for classification. In order to train our classifier total dataset is divided into training and testing dataset. The step is performed by using cross validation index finding and using “holdout” method with 80% data hold for testing. Thus with 60 rows, the dataset is divided into 20 % training set comprising of a total of 12 rows with equal rows of both classes (Cancer and Normal) and 80 % testing set comprising of a total of 48 rows with equal rows of both classes (Cancer and Normal).
The results were taken in form of different parameters i.e. sensitivity, accuracy, specificity, true positive, false positive, true negative, false negative etc. Both the classifier gives 97.9 % accuracy.
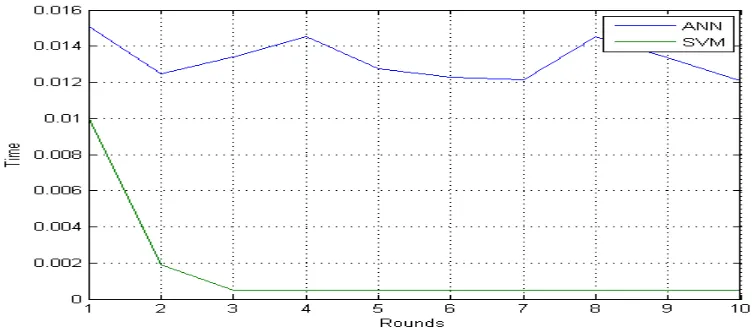
Fig 7: Comparison of Time over ‘10’ experiments
Fig 8: Complete process in Steps
The figure 8 shows the complete steps. The image is first converted to HSV space, and then the saturation channel is extracted and used to generate the mask. The mask is multiplied by original RGB image to get the ROI.
V. CONCLUSION AND FUTURE WORK
InCanada, CLL is the most common type of cancer in adults. There are limited treatment options available.
This paper demonstrates an image processing method for chronic lymphocytic leukemia detection. Haematological tests are costly and take more time, so we cannot use this process frequently. Using the automated approach for detection is less time consuming and it gives more accurate results. We can use automated approach frequently because it gives result fast. The main steps of this method are segmentation, features extraction from segmented image and application of artificial neural network and support vector machine for final classification of cells. Both the classifier gives the overall accuracy of 97.9%.
In future the alternative technique can be investigated for detection of chronic lymphocytic leukemia and multiclass classification can be performed by classifying between normal, chronic lymphocytic leukemia, non-chronic lymphocytic cancer.
REFERENCES
[1] N. C. Institute, "What You Need To Know About Leukemia." [Online]. Available:
http://www.cancer.gov/types/leukemia/patient/cll-treatment-pdq.
[2] E. A. Mohammed, M. M. A. Mohamed, C. Naugler, and B. H. Far, “Chronic lymphocytic leukemia cell segmentation from microscopic
blood images using watershed algorithm and optimal thresholding,” 2013 26th IEEE Can. Conf. Electr. Comput. Eng., pp. 1–5, 2013.
[3] E. A. Mohammed, B. H. Far, M. M. A. Mohamed, and C. Naugler, “Application of Support Vector Machine and k-means Clustering
[4] S. Mohapatra, “Image Analysis of Blood Microscopic Images for Acute Leukemia Detection,” 2010 International Conference on Industrial Electronics, Controls and robotics, pp.215-219, 2010.
[5] H. T. Madhloom and S. A. Kareem, “A Robust Feature Extraction and Selection Method for the Recognition of Lymphocytes versus
Acute Lymphoblastic Leukemia,” 2012 International Conference on Advanced Computer Science Applications and Technologies,
pp.330-335, 2012.
[6] N. Z. S. M. Y. M. N. H. H. F. A, “Classification of Blasts in Acute Leukemia Blood Samples Using K -Nearest Neighbour,” 2012 IEEE 8th
International Colloquium on Signal Processing and its Applications, pp. 461–465, 2012.
[7] S. Mohapatra, “Automated Cell Nucleus Segmentation and Acute Leukemia Detection in Blood Microscopic Images,” Proceedings of
2010 International Conference on Systems in Medicine and Biology16-18 December 2010, IIT Kharagpur, India
,
no. December, pp. 49– 54, 2010.[8] M. Fatma, “Identification and Classifictaion of Acute Leukemia Using Neural Network,” 2014 Int. Conf. on Medical
Imaging, m-Health and Emerging Communication Systems (MedCom), pp. 142–145, 2014.
[9] F. Generation, F. O. R. The, C. Ima, G. E. Recognition, and M. Leukemia, “FEATURE GENERATION FOR THE CELL IMA GE
RECOGNITION OF MYELOGENOUS LEUKEMIA Stanislaw Osowski1,2, Tomasz Markiewicz], Bozena Marianska3, Leszek Moszczynsk/,” pp. 753–756.
[10] C. Raje and J. Rangole, “Detection of Leukemia in microscopic images using image processing,” 2014 Int. Conf. Commun. Signal Process.,
pp. 255–259, 2014.
[11] S. Sivakumar and S. Ramesh, “Automatic White Blood Cell Segmentation Using K Means Clustering,” International Journal of Science
and Engineering Research, vol. 3, no. 4, pp. 1–5, 2015.
[12] S. Jagadeesh, Dr. E. Nagabhooshanam, and Dr. S. Venkatachalam, “IMAGE PROCESSING BASED APPROACH TO CANCER
CELL PREDICTION IN BLOOD SAMPLES,” International Journal of Technology and Engineering Sciences, vol. 1, no. 1, pp. 1–4,
2013.
[13] Farnoosh Sadeghian, Zainina Seman, Abdul Rahman Ramli, Badrul Hisham Abdul Kahar, and M-Iqbal Saripan “A Framework for White
Blood Cell Segmentation in Microscopic Blood Images Using Digital Image Processing,"2009.
[14] S. G. Deore and Prof. Neeta Nemade, “Image Analysis Framework for Automatic Extraction of the Progress of an Infection,” IJARCSSE,
vol. 3, no. 6, pp. 703–707, 2013.
[15] H. G. Zadeh, S. Janianpour, and J. Haddadnia, “Recognition and Classification of the Cancer Cells by Using Image Processing and
LabVIEW,”IJCTE, vol. 5, no. 1, pp. 5–8, 2013.
[16] Fauziah Kasmin,A.S. Prabuwono and Azizi Abdullah , “DETECTION OF LEUKEMIA IN HUMAN BLOOD SAMPLE BASED ON
![Fig 1: Structure of Bone marrow and different type of cells [1]](https://thumb-us.123doks.com/thumbv2/123dok_us/1436473.1176045/1.595.182.432.557.719/fig-structure-bone-marrow-different-type-cells.webp)