Dynamic Characteristics of a SC Building in Kashiwazaki NPP site using Vibration
Test -Part 2: Simulation Analysis
Eiji Miyasaka
1), Kikuo Ishimura
1), Tomohiro Fujita
1), Yuji Miyamoto
2), Atsushi Suzuki
3)1) Nuclear Asset Management Department, Tokyo Electric Power Company, Japan 2) Kobori Research Complex, Kajima Corporation, Japan
3) Nuclear Power Department, Kajima Corporation, Japan
ABSTRACT
A series of forced vibration tests (FVT) were carried out in order to investigate the dynamic characteristics of a solid waste disposal incinerator building in Kashiwazaki-Kariwa NPP site, the first Steel-plate-reinforced-Concrete (SC) building in Japan, in July to August of 2004. The details of FVT and results of the system identification are given in the previous paper (Part 1: Data analysis and system identification). In this paper the simulation analyses of the fundamental dynamic characteristics of soil-structure interaction and those of the fixed-foundation system are discussed. The simulations were performed using 1) a conventional lumped mass model considering soil-structure interaction and 2) an FEM model to investigate the structure in more details. An SC model and an RC model were investigated and results were compared. The results of detailed FEM simulation of the SC model show good consistency with those obtained from the forced vibration test.
INTRODUCTION
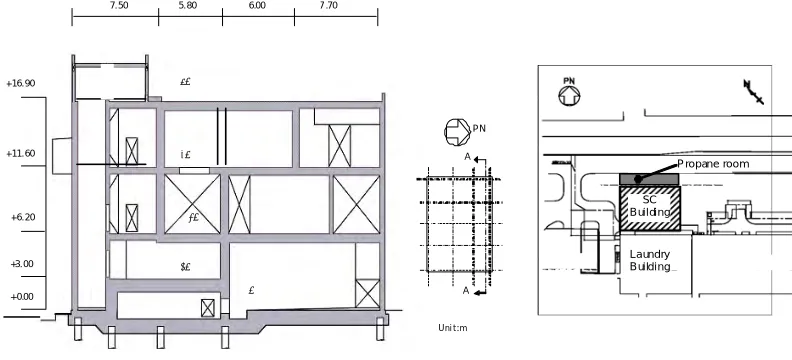
A series of forced vibration tests (FVT) were carried out in order to investigate the dynamic characteristics of a solid waste disposal incinerator building (Figure 1) in Kashiwazaki-Kariwa NPP site, the first Steel-plate-reinforced-Concrete (hereafter SC) building in Japan, in July to August of 2004. The details of FVT and results of the system identification are given in the previous paper (Part 1: Data analysis and system identification). In this paper the results simulation analyses of the fundamental dynamic characteristics of soil-structure interaction and those of the fixed-foundation system are discussed. The simulations were performed using 1) a conventional lumped mass model considering soil-structure interaction and 2) an FEM model to investigate the structure in more details. A detailed understanding of the dynamic behavior of the SC buildings, which presents different physical properties of the building, will be in great concerned of engineers for design. In the following sections, descriptions of the analysis models, followed by a discussion of the dynamics characteristics of the building from the simulation analyses and comparison with the results of the FVT are discussed.
ANALYSIS MODEL
The simulation analysis was carried out using the lumped mass model in order to verify the model which has been used as design model to evaluate seismic response not only for this building but for other NPP buildings. Construction of the model is based on JEAG 4618 “Technical Guidelines for Aseismic Design of Steel Plate Reinforced Concrete Structures: - Buildings and Structures -,” [1] which describes design methods for SC structures; and JEAG 4616 “Technical Guidelines for Design of Foundation Structures for Dry Cask Storage Buildings,” [2] which describes the design methods for pile foundations. A three-dimensional (3D) FEM building model was also made to more accurately analyze the building response characteristics in detail. The outline of the simulation models is summarized as follows:
Lumped Mass Model
The model consists of lumped masses connected by bending-shear beam elements representing the main shear walls and main partition walls. The model is obtained using the physical properties of the building by two times increasing the stiffness of the seismic resistance walls, in order to consider the effects of stiffness of the main partition walls of the building. Figure 2 shows the analysis model for the horizontal excitation. The physical properties of the model are summarized in Table 1. Two different models are investigated, namely the SC and the RC (without considering the outer steel plate of the walls) model. The impedance functions of the pile-foundation are evaluated by optimizing the impedance parameters from a 3D thin layer element method [3], with the results of the resonance curves of the vibration tests of foundation after the completion of the foundation and piles. The cross interaction of the SC building and the adjacent propane cylinder room is taken into account by adding the impedance functions of the propane cylinder room’s foundation to the analysis model. The physical properties of the soil used in the simulation analysis (Table 2) were determined by a PS logging investigation. The impedance function for the analysis is compared with impedance estimated from test results in Figure 3.
FEM Model
In this study, the 3D FEM simulation analysis of the vibration test is also carried out in order to validate the method of evaluation for the pile-foundation and the stiffness of SC members, which must be used during the earthquake response analysis. The seismic resistance walls, partition walls, main roof slab and mid level slab are considered in the FEM modeling. The effect of the steel plate on the dynamic characteristics of the building is also investigated. The FEM modeling consists of:
a) Foundation slab
The foundation slab is modeled by solid elements in order to describe its configuration as precisely as possible. The elements are divided into three parts in the thickness direction. The model is constructed such that the nodes on the plane surface coincide with the pile positions.
b) Upper building frame
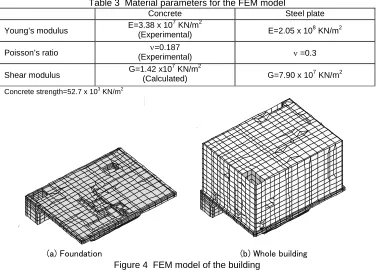
All shear walls and partition walls are modeled by shell elements. In principle, they are modeled at the wall centers, but if the thicknesses of walls in the upper and lower stories are different, the thinner one is used. The floor slabs are also modeled as shell elements. In principle, they are modeled at the upper surface. The FEM model for the building is shown in Figure 4. The numbers of model nodes, shell elements and solid elements are 6148, 3489 and 294, respectively.
The damping ratio of 5% is used for the building, same as for the design conditions. The material parameters used in the FEM analysis are shown in Table3.
When a steel plate is incorporated into the rigidity, e.g. SC structure, the rigidity of the shell elements comprising the building walls and floors are evaluated as the summation of the rigidity of the steel panel and the concrete as follows:
For wall: Ksc = {Ks*t + Kc (T-2t)} /T (1) For floor: Ksc = {Ks*t + Kc (T-t)} /T (2) where
Ksc: axial or shear rigidity of SC member
Ks: Young’s modulus or shear modulus of steel plate Kc: Young’s modulus or shear modulus of concrete T: member thickness
t: steel plate thickness
The weight of the building is calculated based on the density of each element. The density is specified as 24 kN/m3 for both SC and RC model. The load of the floor finishing and equipments are modeled as a mass element on the floor nodes. Two cases are considered for the simulation analysis; 1) the RC model, where steel plates are ignored and the rigidity is evaluated assuming that all member cross-sections are concrete, and 2) the SC model, where the rigidity of the steel plate is taken into account. Analysis was carried out for two different foundation conditions: the flexible foundation (where soil-structure interaction is taken into account), and the fixed-foundation.
RESULTS
Lumped Mass Model
Figure 5 shows the results of the analyses of the soil-structure interaction coupled with the adjacent propane room during RF excitation. It is shown that by considering the cross-interaction and embedment effects, the predominant frequencies of the SC model is 4.3Hz for both NS and EW direction, which are close to the results of FVT. The response amplitude of the simulated model and those of FVT are also in good agreement in both directions. It is shown that the lumped mass model considering soil-structure interaction well simulates the vibration characteristics of the SC building.
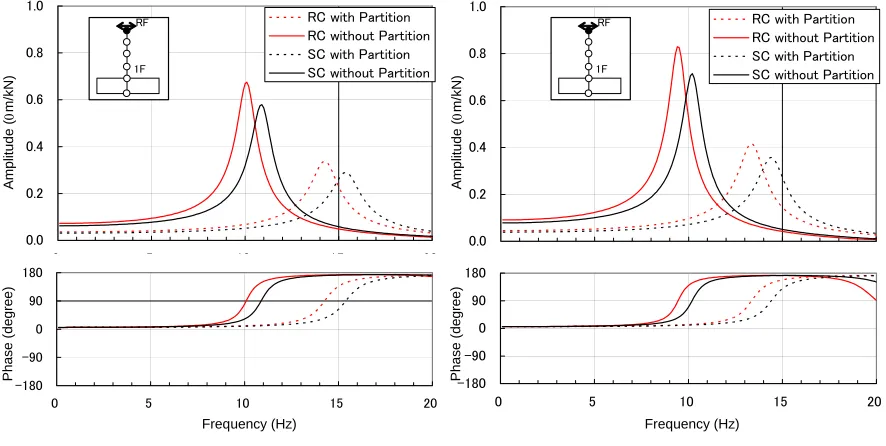
The fixed-foundation resonance curves of the investigated models are shown in Figure 6. It can be seen that the predominant frequencies of the SC building itself increase to 14.45Hz in NS direction and 15.79Hz in EW excitation. It can also be seen that the SC model has larger predominant frequency compared to RC model. And it is also clear that considering the main partition walls in the modeling of the building the predominant frequencies increase by 50%.
FEM Model
Figure 7(a, b) shows the resonance curves of the FEM models with soil-structure interaction and those of the FVT at the RF floor during the RF excitation. The predominant frequencies of soil-structure interaction system were obtained from the analysis as 4.3Hz in both NS and EW directions. These values nearly approximated the experimentally obtained natural frequencies of 4.6Hz (NS) and 4.3Hz (EW). Although the EW response is well simulated, the NS response of the simulation analysis slightly differs from the FVT response. This can be due to the cross-interaction of the adjacent building (laundry building) located in the south of the SC building (same direction of the NS excitation) which is not considered in the modeling. It is also seen that the SC and RC model lead to the same response in both direction. This may be due the fact that
the building deformation is mostly by the rigid body motion (swaying and rocking motion) and the deformation of the building itself has small effect on the total response.
The modal frequencies of the fixed-foundation model of the building are obtained from eigenvalue analyses. The first modal frequency corresponds to the 1st mode in NS direction (13.27Hz for RC model and 13.76Hz for SC model). The second modal frequency corresponds to the 1st mode in EW direction (14.54Hz for RC model and 15.06Hz for SC model). The results also show that the steel plates have small effects on the stiffness of the building. The mode shapes of the first fixed-foundation mode in each direction are shown in Figure 8.
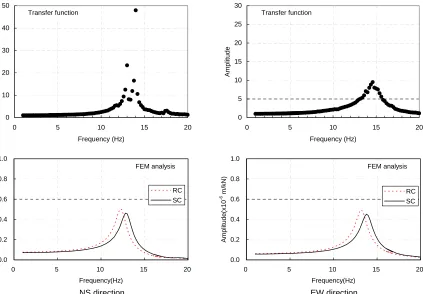
Figure 9 shows the comparison of the resonance curves of the fixed-foundation model for the roof floor (RF) excitation and the fixed-foundation transfer function estimated from FVT. It can be seen that the predominant frequency obtained from the FEM model well explained the FVT results.
Summary of the Analysis Results
<Assessment as soil-structure interaction system>
Simulation analysis was carried out using the lumped mass model for the building-ground coupled system. The building construction was based on JEAG 4618 “Technical Guidelines for Aseismic Design of Steel Plate Reinforced Concrete Structures: - Buildings and Structures -,” which describes design methods for SC structures; and JEAG 4616 “Technical Guidelines for Design of Foundation Structures for Dry Cask Storage Buildings,” which describes design methods for pile foundations. It is shown that the analysis results closely matched the experimental results.
Furthermore, a 3D FEM building model was made to more accurately analyze building response characteristics, and simulation analysis for RF excitation was carried out. The entire building, including partition walls, was precisely modelled and the effects of backfill soil in the foundation vicinity were precisely represented. The predominant frequencies of soil-structure interaction system were obtained from the analysis as 4.3Hz and 4.3Hz in the EW and NS directions, respectively. These values are approximated the experimentally obtained natural frequencies of 4.6Hz and 4.3Hz. Thus, the analyses simulate the experimental results including peak displacement response amplitudes. A study was also carried out for the case where the stiffness of the SC steel plate was not taken into account. Since the supported foundation was flexible compare to the rigidity of the building, the response results were almost the same as those where the stiffness of the steel plate was taken into account.
<Assessment as a fixed-foundation building system >
Since the supported foundation were flexible compared to the upper structure, the most displacement of the soil-structure interaction system is due to the rigid body motion of the building. Thus, the characteristics of the building itself were not directly observed in the measurement. Therefore, experimental results on the fixed-foundation system evaluated in the previous part were simulated. In order to precisely model this building, the response analysis of the fixed-foundation model was carried out using the FEM model for the cases with and without the steel plate considerations. As a result, the vibration characteristics of the building were accurately evaluated.
The summary of the fixed-foundation condition of the building estimated from simulation analyses and the results obtained from vibration test are listed in Table 4. Comparing the results show that the 3D FEM model explained the results of the FVT. The estimation by the lumped mass model with the increase of the stiffness in order to consider the partition walls into the model also shows good agreement with the FVT.
CONCLUDING REMARKS
The simulation analyses were performed in order to investigate the dynamic characteristics of a solid waste disposal incinerator building in Kashiwazaki-Kariwa NPP site, the first SC building in Japan. A lumped mass model and a detailed 3D FEM model have been studied and the results from each model are compared with those from the experimental vibration test. The followings can be noted:
1) The lumped mass model can well evaluate the important dynamic characteristics of the SC building, e.g. amplitudes level and vibration frequencies, needed for structural design. Therefore the conventional lumped mass model can be used as an analysis model for the structural design.
2) The FEM analysis can also evaluate these characteristics, furthermore a detailed model and local effect due to the vibration can be investigated.
3) Modeling the soil-structure interaction by means of soil springs, the vibration characteristics of the building considering the interaction effects can be evaluated using both analysis models.
REFERENCE
[1] Japan Electric Association “Technical Guidelines for Aseismic Design of Steel Plate Reinforced Concrete Structures: - Buildings and Structures –”, JEAG 4618, 2005.
[2] Japan Electric Association “Technical Guidelines for Design of Foundation Structures for Dry Cask Storage Building”, JEAG 4616, 2003.
[3] K. Masuda, K. Miura, E. Kitamura, Y. Miyamoto: “Dynamic Impedance of A Large Scale Pile-Group”, Journal of Structural and Construction Engineering, Transactions of Architectural Institute of Japan, No.447, May 1993.
2F RF
4F
3F
1F
+ 0.00 + 6.20 + 11.60 + 16.90
+3.00
7.50 5.80 6.00 7 .70
PN
A A
Uni t:m
Laundry Building SC Building
Propane room
Figure 1 Investigated building and layout
Table 1 Physical properties of the lumped mass analysis model
SC/RC SC model RC model
Mass moment inertia
Ig(×105kN/m2)
Shear area
As(m2) Moment Inertia I(×103m4) Shear area As(m2) Moment Inertia I(×103m4)
Ma
s
s
No
.
Weigth W(kN)
NS EW
Me
m
ber
No.
NS EW NS EW NS EW NS EW
① 18500 6.51 11.27
(1) 43.0 75.8 4.08 9.50 37.0 65.2 3.46 8.08
② 22000 7.75 13.42
(2) 75.2 73.6 8.40 9.18 64.6 63.2 7.14 7.80
③ 21100 7.43 12.86
(3) 70.4 83.0 8.80 9.78 60.6 71.4 7.48 8.32
④ 12200 4.28 7.42
(4) 66.6 81.0 8.36 8.60 57.2 69.6 7.10 7.32
⑤ 20800 7.33 12.68
(5) 1209.8 1209.8 45.00 83.90 1209.8 1209.8 45.00 83.90
⑥ 14500 5.09 8.82
Total 109100 - - - - -
Young modulus: E=2.27×10⁷KN/m, Poisson ratio ν=0.2, Damping ratio: 5%
Table2 Physical properties of the soil for the analysis
Depth Vs (m/s) Vp (m/s) γ (KN/m3) Damping (%)
0.0~-1.5m 200 446 16.7 2.0
-1.5~-4.1m 250 479 18.0 1.0
-4.1~-8.1m 300 575 18.0 1.0
-8.1~-11.1m 330 700 18.0 1.0
-11.4~-20.1m 330 1200 17.1 1.0
-20.1~24.1m 330 1200 19.0 1.0
-24.1~27.1m 470 1800 19.0 1.0
27.1m~ 470 1800 17.2 1.0
Table 3 Material parameters for the FEM model
Concrete Steel plate
Young’s modulus E=3.38 x 10
7
KN/m2
(Experimental) E=2.05 x 10
8
KN/m2
Poisson’s ratio (Experimental) ν=0.187 ν =0.3
Shear modulus G=1.42 x10
7
KN/m2
(Calculated) G=7.90 x 10
7 KN/m2
Concrete strength=52.7 x 10³ KN/m2
X Y Z
X Y
(a) Foundation (b) Whole building
Figure 4 FEM model of the building
Table 4 Comparison of the fixed-foundation modal frequencies
NS direction EW direction
1F excitation 14.36 15.79
RF excitation 13.42 14.70
Experimental
MT 15.52 16.58
Lumped mass model
SC (Including partitions)
14.45 15.79
SC 13.58 15.06
3D FEM model
RC 13.27 14.54
RF
3F
1F
Figure 2 Lumped mass analysis model
-1.0 0.0 1.0 2.0 3.0 4.0
0 5 10 15 20
Frequency(Hz)
Impe
dan
ce
(X1
0
7 k
N
/m)
Simulation Analysis Test Result
KR
KI
Figure 3 Comparison of impedance functions between for analysis and from test
0 0.2 0.4 0.6 0.8 1
0 5 10 15 20
A m pl itu de( m icr o n /k N ) RF 4F 3F 1F 0 0.2 0.4 0.6 0.8 1
0 5 10 15 20
A m pl it ud e (m icr o n/k N ) RF 4F 3F 1F -180 -90 0 90 180
0 5 10 15 20
Freq.(Hz) P ha seL ag (d eg .) -180 -90 0 90 180
0 5 10 15 20
Freq.(Hz) P h as e L ag (d e g. ) EW direction 0 0.2 0.4 0.6 0.8 1
0 5 10 15 20
A m pl it ud e( m icro n/k N ) RF 4F 3F 1F 0 0.2 0.4 0.6 0.8 1
0 5 10 15 20
A m pl it ud e( m icro n /k N ) RF 4F 3F 1F -180 -90 0 90 180
0 5 10 15 20
Freq.(Hz) P h as eL ag (d e g .) -180 -90 0 90 180
0 5 10 15 20
Freq.(Hz) P h as e L ag (d e g .) NS direction
Figure 5 Response of the SC building on the lumped mass model and corresponding FVT resonance curves during RF excitation
Analysis Test
Analysis Test
0.0 0.2 0.4 0.6 0.8 1.0
0 5 10 15 20
RC with Partition RC without Partition SC with Partition SC without Partition
-180 -90 0 90 180
0 5 10 15 20
0.0 0.2 0.4 0.6 0.8 1.0
0 5 10 15 20
RC with Partition RC without Partition SC with Partition SC without Partition
-180 -90 0 90 180
0 5 10 15 20
RF
1F RF
1F
Frequency (Hz) Frequency (Hz)
Ampl
it
ude (
0
m/
k
N
)
Ampl
it
ude (
0
m/
k
N
)
Phase (
degree)
Phase (
degree)
(a) EW direction (b) NS direction Figure 6 Response of the fixed-foundation lumped mass model at RF during RF excitation
0.0 0.2 0.4 0.6 0.8 1.0
0 5 10 15 20
Frequency(Hz)
A
m
plitud
e(mm/k
N
)
Test FEM(RC) FEM(SC)
Figure 7a Comparison between Test and FEM analyses (RF,NS direction)
0.0 0.2 0.4 0.6 0.8 1.0
0 5 10 15 20
Frequency(Hz)
Amplitud
e(mm
/kN
)
Test
FEM(RC)
FEM(SC)
Figure 7b Comparison between Test and FEM analyses (RF,EW direction)
Figure 8 Mode shapes for first vibration mode in NS and EW direction.
0.0 0.2 0.4 0.6 0.8 1.0
0 5 10 15 20
Frequency(Hz)
Ampl
itud
e(
x10
-6 m/
kN)
RC SC
0.0 0.2 0.4 0.6 0.8 1.0
0 5 10 15 20
Frequency(Hz)
Ampl
itud
e(
x10
-6 m/
kN)
RC SC
0 10 20 30 40 50
0 5 10 15 20
Frequency (Hz)
A
m
pl
it
ude
0 5 10 15 20 25 30
0 5 10 15 20
Frequency (Hz)
A
m
pl
it
ude
Transfer function Transfer function
FEM analysis FEM analysis
NS direction EW direction
Figure 9 Comparison of the fixed-foundation transfer function (FVT) and fixed-foundation response from FEM analysis
X Y Z tput Set: Mode 1 13.75679 Hz X
Y Z
X Y Z
X Y Z ut Set: Mode 2 15.05787 Hz
(a) NS direction
(b) EW direction