University of Windsor University of Windsor
Scholarship at UWindsor
Scholarship at UWindsor
Electronic Theses and Dissertations Theses, Dissertations, and Major Papers
1-1-1968
Kinetic study of the catalytic oxidation of carbon monoxide.
Kinetic study of the catalytic oxidation of carbon monoxide.
Vinod C. Khera
University of Windsor
Follow this and additional works at: https://scholar.uwindsor.ca/etd
Recommended Citation Recommended Citation
Khera, Vinod C., "Kinetic study of the catalytic oxidation of carbon monoxide." (1968). Electronic Theses and Dissertations. 6522.
https://scholar.uwindsor.ca/etd/6522
This online database contains the full-text of PhD dissertations and Masters’ theses of University of Windsor students from 1954 forward. These documents are made available for personal study and research purposes only, in accordance with the Canadian Copyright Act and the Creative Commons license—CC BY-NC-ND (Attribution, Non-Commercial, No Derivative Works). Under this license, works must always be attributed to the copyright holder (original author), cannot be used for any commercial purposes, and may not be altered. Any other use would require the permission of the copyright holder. Students may inquire about withdrawing their dissertation and/or thesis from this database. For additional inquiries, please contact the repository administrator via email
OXIDATION OF CARBON MONOXIDE
A Thesis
Submitted to the Faculty of Graduate Studies through the Department of Chemical Engineering in Partial Fulfilment
of the Requirements for the Degree of Master of Applied Science at the
University of Windsor
by
Vinod C. Khera
UMI N um ber: E C 52704
INFORMATION TO USERS
The quality of this reproduction is dependent upon the quality of the copy
submitted. Broken or indistinct print, colored or poor quality illustrations and
photographs, print bleed-through, substandard margins, and im proper
alignm ent can adversely affect reproduction.
In the unlikely event that the author did not send a com plete m anuscript
and there are missing pages, these will be noted. Also, if unauthorized
copyright material had to be removed, a note will indicate the deletion.
®
UMI
UMI Microform EC52704
Copyright 2008 by ProQuest LLC.
All rights reserved. This m icroform edition is protected against
unauthorized copying under Title 17, United States Code.
ProQuest LLC 789 E. Eisenhower Parkway
PO Box 1346 Ann Arbor, Ml 48106-1346
ABSTRACT
A catalytic reactor was designed and constructed to
study the kinetics of a highly exothermic reaction,' namely'
the oxidation of carbon monoxide, under integral plug flow
conditions. The reactor was found to be an efficient unit
that could be used under isothermal conditions with a
commercial 0.3 % Pd on alumina catalyst in the form of ’
1/8" X 1/8" pellets.
Data were taken at the temperatures of 170°, 180°, and
195°C; and at pressures close to atmospheric. The range of
conversion was from 20 % to 60 %, Mass and heat transfer
effects on kinetics were found to be negligible.
The rate model which was found to fit the data most
satisfactorily is as follows:
(—r c o ) = 7.4 exp(~ 27,900/RT)
This rate equation signifies either the surface reaction
between chemisorbed carbon monoxide and oxygen or the
chemi-sorption of oxygen as the rate controlling step. The data
were found to fit the rate equation within 95 % confidence
limits for all the temperature levels investigated.
iii
The author wishes to take this opportunity to express
his deep admiration and gratitude to Dr. Guru P. Mathur for
his interest and able guid a n c et valuable criticism and
encouragement throughout the course of this investigation.
Dr. Maurice Adelman and Dr. Alex Gnyp also provided useful
suggestions.
The author is also thankful to Mr. Louis F. Cory of the
Electronics shop for assistance in the maintenance of the
Gas Chromatograph and to Mr. Halil Parlar for assisting in
the build up of the experimental set-up.
The financial support for this work was provided by the
C O N TEN TS
Page
ABSTRACT iii
ACKNOWLEDGEMENTS iv
TABLE OF CONTENTS V
LIST' OF FIGURES Vii
LIST OF TABLES viii
I. INTRODUCTION * 1
II. LITERATURE SURVEY 5
III. THEORY
A. Catalytic Kinetics 9
B. Evaluation of Rate Equations 10
C. Effectiveness Factor 12
D. Axial Aspect Ratio 12
IV. EXPERIMENTAL EQUIPMENT
A. Major Equipment 13
B. Process Measurement and Control 16
C. Analytical Equipment 19
V. EXPERIMENTAL PROCEDURE
A. Calibration of Rotameters 22
B. Operation of Gas Chromatograph 22
C. Operational Procedure x 24
VI. RESULTS AND DISCUSSION 27
V
VII. CONCLUSIONS AND RECOMMENDATIONS 38
NOMENCLATURE 40
REFERENCES 43
APPENDIX I Tables I . 1 to 1.6 46
APPENDIX II Calibration Curves, Figures 8 to 14 52
APPENDIX III Summary of Experimental Data, Tables
* III.l to III.3 . 59
APPENDIX IV Mass and Heat Transfer Effects
( Calculations 62
I ' ‘
FIGURES
Figure Page
1. Sectional View of the Reactor 14
2. Schematic Diagram of the Experimental set up 15
3. Arrangement of the Thermal Conductivity Detector 20
4. Model Fitting to Data at 170°C 33
5. Model Fitting to Data at 180°C 34
6. Model Fitting to Data at 195°C 35
7. Arrhenius Plot of Log k vs. 1/T 36
8. G.C. Calibration for Oxygen Gas 52
9. G.C. Calibration for Carbon Monoxide Gas 53
10. G.C. Calibration for Carbon Dioxide Gas 54
11. G.C. Calibration for Nitrogen Gas 55
12. Calibration Curve for Air Rotameter 56
13. Calibration Curve for Carbon Monoxide Rotameter 57
14. Calibration Curve for Nitrogen Rotameter 58
vii
Table Page
6.1, Comparison of the Energies of Activation 37
1 . 1 Constituents of Internal Combustion Engine
Exhaust Gases 46
1.2 Threshold Limits for Continuous 8-Hour Exposure 47
1.3 Effects of Carbon Monoxide Concentration on
Human Body 48
i *■
1.4 Analysis of Commercial Grade Carbon Monoxide 49
• 1.5 Operating Conditions of the Barber-Colman
Selecfca Series 5000 Gas Chromatograph 50
1.6 Catalyst Details 51
111.1 Summary of Experimental Data at 170°C 59
111.2 Summary of Experimenta1 Data at 180°C 60
I. INTRODUCTION
The harmful effects of air pollution are felt not only
in a city like Los Angeles, but also in the smaller ones.
Automotive exhaust is b y far the most significant air
pollutant in the cities. The exhaust gases from the inter
nal combustion engines are complex mixtures consisting
principally of the products of hydrocarbon combustion, and
small amounts of the oxidation products of sulphur and
nitrogen. The major constituents are water, CO2 , N2 , O2 ,
CO, and H2 ; whereas minor constituents are oxides of sulphur
and nitrogen, aldehydes, organic a c i d s , alcohols, hydro
carbons , smoke etc. (11). Table 1.1 in Appendix I gives A
typical composition of exhaust g a s e s .
Carbon monoxide constitutes the largest single compo
nent contributing to air pollution from automotive exhausts.
Carbon monoxide gas is extremely toxic and because of t h i s ,
it is extremely dangerous in enclosed spaces where it may
even cause death, It has also been found to be an
asphyx-inal which combines with the hemoglobin of blood (19).
Tables 1.2 and 1.3 in Appendix I list the effects of carbon
monoxide concentrations on the human body.
The emmission standards for exhaust gases as set b y
the U.S. State Department of Health are not over 1.5 %
1
which reflect approximately an 80 % reduction of hydrocarbon
I
ns emissions and a 60 % reduction of carbon monoxide (12).,
The automobile industry and many research organizations
have been concerned with minimizing the quantity of air
pollutant components from automotive exhausts. The work of
these people has been hampered b y the lack of high
temperat-4'
ure materials of construction and development of catalysts
which would be immune to poisoning. The industry has also
been concerned with evaluating various methods of reducing
air pollution from automotive exhausts including modifica
tions of the design of the engines etc. A number of oper
ational and performance penalties have, however, been
experienced (3). It appears that in order to bring down
the quantity of carbon monoxide and hydrocarbons to an
acceptable level, their oxidation will eventually be nece
ssary.
The problem of catalyst poisoning is an important one
still to be solved. It is hoped that a system can, be
developed which,would remove various catalyst poisons from
the exhaust gases before they are allowed to come in contact
with the catalyst or a catalyst would be prepared which
will not be poisoned by the lead oxide and water vapour
present in the exhaust gases.
Conventional integral plug flow reactors have been
3
problems involved in maintaining isothermal conditions in
\ • - .
such a system as mentioned by Tajbl et. el. (24).
The temperature control problems associated with such
a system and the presence of carbon monoxide as a major
constituent in automotive exhausts suggested a careful and
systematic investigation of the catalytic oxidation of
•carbon monoxide.
The feasibility of using the conventional plug flow
type of integral reactors for okinetic study by means of
slightly modified design and deviation from the usual
operating procedure is studied in this investigation. The
reactor was not heated directly, whereas preheating of the
reactant gases was utilized directly and the heat of rea
ction was utilized indirectly in order to control the
temperature of the integral reactor during the course of
this investigation.
The purpose of the present investigation is two-fold:
1. To study the feasibility of using an integral plug flow
catalytic reactor for a significant level of conversions
for the highly exothermic reactions. The reaction chosen
was the catalytic oxidation of carbon monoxide with air
over 0.3 % palladium catalyst supported on a l u m i n a .
2. T o s t u d y t h e k i n e t i c s o f t h e a b o v e m e n t i o n e d r e a c t i o n
and to establish the rate equation and determine the
reaction velocity constants of the temperature range of
170° to 195°C and also to determine the energy of activation.
The rate equation established in this study may be used
II. LITERATURE SURVEY
An extensive survey on the catalytic oxidation of carb
on monoxide has been prepared by Katz (16). Dixon and
Longfield (10) have also reviewed the literature on carbon
•f
-monoxide oxidation on Ag, Pd and oxide catalysts.
Carbon monoxide oxidation occurs readily at > i temp
eratures as low as room temperature by transition metal oxide
catalysts such as MnC>2 , CuO, NiO and CoO. Multicomponent
catalysts with mixtures of oxides of Mn, Cu, Co and Ag are
particularly active in the oxidation of carbon monoxide and
are known as Hopcolites. Detailed information on important
catalysts can be found elsewhere (1, 2, 13, 20, 23). The
most commonly employed catalysts are weakly basic oxides of
the transition metals (e.g., oxides of Zn, Cu, Pb, T i , Mn,
Fe, Ni, Co and Mo), Pt and Pd in their metallic state, the
oxides of Ag and Hg and the weakly acidic oxides of Cr, Mn,
Fe, and Mo and oxides of rare earths (e.g., cerium and
>thorium).
In the case of chemisorption of carbon monoxide on
oxide catalysts, it has been observed (16) that some gas
is at first adsorbed instantaneously followed by a slow
adsorption which varies approximately as the square
5
pressure. It is interesting to note here.that the mobility
or the translational freedom of the adsorbed molecules can
be determined from a knowledge of the entropy of adsorption.
This has been illustrated by Damkohler and Edse (8).
A recent review b y Dixon and Longfield (9) cites the
work of Schwab and Grossner (21) in which the rate of carbon
monoxide oxidation over palladium wire was described by the
relationship;
- M C O l s k (O2) ...(2.1)
dt (CO)
which is a simplified form of the expression where oxygen
chemisorption is the rate controlling step, i.e.,
-
ai£0) = k-_<£
2
>
--
...(
2
.
2
).
dt 1 + K(CO)
When carbon monoxide adsorption on Pd wire is high , Eqn.
2.2 reduces to Eqn. 2.1. In general, however, Schwab's
work suggests an expression of the form;
- 31S21 = K —
coalLEEi,
...(2.3)
at (1 + K ( C O ) )
in which the surface reaction between carbon monoxide and
oxygen is the rate controlling step. In the case of
on Pd wire also agrees, with the work of Schwab, whereas the
results of Daglish and Eley (7) are in direct conflict with
those of the above investigators. They suggested dissociat
ive chemisorption of oxygen as the rate controlling step.
The work of Daglish and Eley was carried out at lower temp
eratures as compared to others? which could probably explain
the shift in mechanism. For high adsorption of CO on Pd,
this can be written as follows:
(Oo)
(-rc o ) = ^ T T T T 2 ...(2.4)
(CO)
The works mentioned above have been on Pd wire and
films as catalyst surfaces. The only work on the kinetic
investigation of CO oxidation on a Pd catalyst supported on
alumina is that of Tajbl et. al. (24). Their study was
car-ried out on in a continuous stirred tank catalytic reactor
for conversions upto 15 %» This reactor was considered : .
superior to the conventional plug flow reactor mainly b e
cause the plug flow reactors are extremely difficult to
operate under isothermal conditions. The rate model sugges
ted was first order with respect to C>2 concentration and
inversely proportional to the CO concentration.
The investigations mentioned above are based on the
i
assumption that carbon monoxide is very strongly adsorbed
on P d , , This has been confirmed in the work of Stephens(22)
who studied the adsorption of the carbon monoxide-oxygen
system on palladium metal film. It was however not possible
in his work to establish oxygen adsorption rates in the
ted diffculties of reaction between adsorbed carbon monoxide
and oxygen, wheras there is no use of finding the oxygen
adsorption rates in the absence of carbon monoxide because
the palladium surface changes its adsorptive characteristics
b y the presence or absence of carbon monoxide.
The complete rate equations for the various rate
controlling steps, the simplified forms of which have been
mentioned in this chapter will be discussed in detail in
III.. THEORY
A. Catalytic Kinetics
The determination of the kinetics of a chemical reac
tion, in general, and a catalytic reaction, in particular,
involves the understanding o f , the fundamentals of the
process. Unfortunately, very little is known about the
exact role of a catalyst in a catalytic reaction. So far,
insufficient knowledge exists on the total phenomenon.
Under the present circumstances until a more comprehensive
understanding of the catalytic phenomenon is achieved, there
are two approaches open to the present day investigator.
One is based on the Langmuir-Hinshelwood mechanisms as mod
ified and propounded by Hougen and Watson; and the other
approach is through the empirical power law formulation.
Hougen and Watson (15) proposed the following steps b y
which a catalytic reaction proceeds;
1. Mass diffusion of the reactants to the exterior
surface of the catalyst.
2. Diffusion of the reactants into the catalyst pore
structure.
3. Chemisorption of the reactants on the active sites
of the catalyst. •
4. Surface reaction between chemisorbed reactants
9
and/or reactants in the gas phase.
5. Desorption of products.
6. Diffusion of the products out of the pores to the
exterior surface.
7. Mass diffusion of the products away from the surface
of the catalyst.
Steps 1, 2, 6, and 7 are physical in nature whereas
the rest of the steps are chemical ones.
One or more of the seven steps could be rate controlling.
The rate expressions for single rate controlling steps have
been proposed by Yang and Hougen (26). In those cases where
two surface reactions are occuring simultaneously on differe
nt types of active sites, the two reaction: rates are additive
requiring independant rate equations.
B. Evaluation of Rate Equations
When the diameter of the Catalyst particles is small in
comparison with the tube radius, a flat velocity profile is
obtained and this acts as a condition confirming plug flow
behaviour in the reactor (25). For the case when a steady
state flow system exists, if an elemental section of the
reactor is considered with a catalyst mass of dW producing
a c o n v e r s i o n o f dx of t h e r e a c t a n t , t h e n t h e b a s i c c o n v e r s i
on equation can be written as:
where F = lb, moles/hr. of feed,
XA = conversion in lb. moles of A/lb. mole of feed.
-rA = molal rate of disappearance of reactant A based on unit mass of the catalyst.
W = mass of the catalyst, lbs.
This equation can be rewritten in the integrated form as
/ A
H a j ...(3.2)
j
The expression for the reaction rate is substituted in
Eqn. 3.2 in terms of conversions taking into account any
expansion or contraction in volume of the feed stream during
the course of the reaction. The right hand side of Eqn. 3.2
is then integrated and the integrated expression plotted as
abscissa against W /f as ordinate. In case the integrated
right hand side is a complicated expression, then multi
linear regression can be employed and the values of the
constants in the rate expression evaluated.
For rate expressions which are highly complicated, the
integration is best carried out graphically although this
mehl.od is rather inaccurate.
Since an integral reactor was employed in this study,
instantaneous numerical values of reaction rates at various
conversions can be computed b y differentiating the X vs. W/F
curve. This however introduces graphical differentiation
errors and is therefore not generally used. ,
C . • Effectiveness Factor
The effectiveness factor E, is defined as the ratio of
average reaction rate within a pore to the maximum reac
tion rate if the pore is absent* i.e., if all the interior
surface is equally available at the temperature, pressure
and composition prevailing at the exterior surface. A n
effectiveness facor of unity is approached when the size
4'
of the catalyst particles is small, and when the pores a r e . .
large and well interconnected (19). With the small sized
!
and highly porous catalyst used in this study, these cond
itions are conveniently met. Therefore an effectiveness
factor of unity was assumed.
D , Axial Aspect Ratio
Axial aspect ratio has been defined as the ratio of the
length of the catalyst bed to the catalyst particle diameter
(Z/dp). According to Carberry ( 5 ) , axial mixing effects
upon kinetics can be ignored safely and\ plug flow kinetic
behaviour for all kinetic orders will be insured if axial
aspect ratios of at least 30 are used in integral plug flew
reactors.
A sufficiently large axial aspect ratio should, theref
ore be used ( an axial aspect ratio of 60 was chosen based
upon the quantity of the catalyst required for significant
conversipns) so that the axial mixing does not affect the
IV. EXPERIMENTAL EQUIPMENT
The design and construction of the experimental
equipment constitutes an essential part of this project.
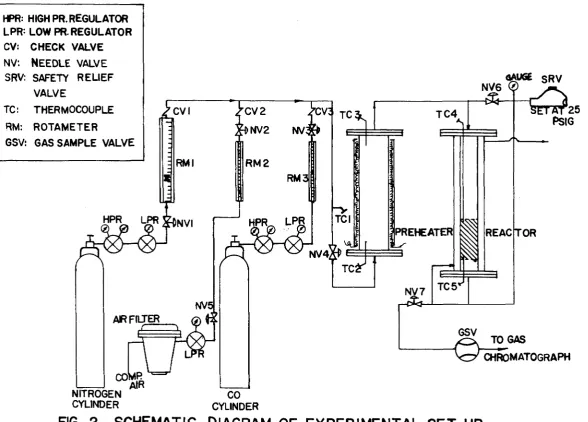
The detailed diagram of the catalytic reactor is shown in
Fig. 1, whereas a schematic diagram of the experimental
set-up is shown in Fig. 2.
A . Ma ior Equipment
1• Reactor
A cylindepical tubular reactor was used in this
experimental investigation. The reactor was made from a
2 f< t long 1— 1/2 in. 16 BWG mild steel tube surrounded by
a concentric 2 in. sch. 40 miId steel pipe. The annulus
was provided in order to (i) utilize the heat of effluent
gases from the reactor in heating the reactor, (ii) to act
as an insulation on the reactor tube because of the very
low thermal conductivity of the g a s e s . Standard 150 lb.
mild steel flanges for 2 in. sch. 40 steel pipe were welded
at the two ends of the reactor. The flange at each end was
fitted with one screwed 1/4 in. Swagelok 316 stainless steel
male connector for flexibility in connection to inlet and
outlet tubing and to facilitate insertion of Berl S addles.
One screwed Omega connection was also provided on each
flange for flexibility in the adjustment of thermocouple
13
REACTOR INLET
m O.D. SWAGE LOK MALE CONNECTOR
m
2" STD. 150 LB. FLANGES
1/4" PIPE CONNECTION FOR ANNUUJS EFFLUENT COPPER
CLAD .J
ASBESTOS GASKET
1/4" O.D. 16 B.W.G. THERMO WELL
1-1/2" O.D. 16 B.W.G. STEEL TUBE
ANNULD INLET
REACTOR BED
2" SCH. 4 0 STEEL PIPE
REACTQ|
OUTLET 1/8" OMEGA TC. FITTING
S E C T IO N AT A A'
A
R e p ro d u c e d w ith p e rm is sio n of the c o p y ri g h t o w n e r. F u rth e r re p ro d u c tio n p ro h ib ite d w it h o u t per m is si o n .
HPR: HIGH PR. REGULATOR LPR= LOW PR. REGULATOR CV: CHECK VALVE
NV: Ne e d l e v a l v e
SRV: SAFETY RELIEF VALVE
TC: THERMOCOUPLE RM: ROTAMETER
GSV: GAS SAMPLE VALVE
I CVI RMI AIR FILTER rzzrzi NITROGEN CYLINDER COMP AIR
Z C V 2
it>NV2
R M 2
V ' T C I NV<
RM3
TCI
VlJ
NV4,
&
T C 4
PREHEATER
TCZ
QAUGE SRV NV6 0
T5T25 PSIG
TC5'
REAC TOR
GSV
TO GAS
c h r o m a t o g r a p h
CO CYLINDER
FIG. 2
SCHEMATIC DIAGRAM OF EXPERIM ENTA L SE T UP
i—*
protection tubes.
The outlet for the reactor effluent gases was connected
to the inlet of the annulus located at the lower end of the
reactor so that these gases pass through the. annulus leaving
it at the outlet which is located at its upper end.
The catalyst bed was held by means of two 1/16 in. thick
stainless steel screens snugly fitting inside the reactor
tube.' The empty space below the catalyst bed was filled
with ceramic berl saddles,to act as a support to the catalyst
bed. The catalyst bed was filled with the catalyst mixed
with the berl saddles. The detaiIs of the catalyst used in
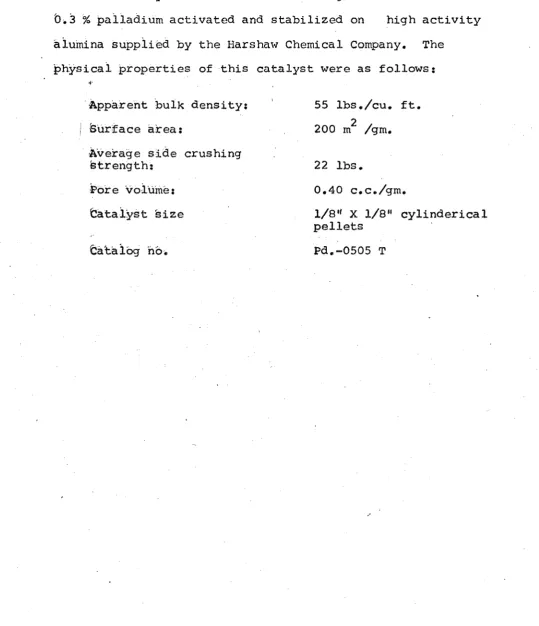
this investigation are given in Table 1.6 in Appendix I .
2. Preheater
The preheater consisted of a 2 in. sch. 40 mild
steel pipe with standard 150 lb. steel flanges welded at
both ends. The fittings on each of the top and bottom flan
ges are identical to those on the reactor flanges.
The heat to the preheater was supplied b y two 18
in. long, model 50241 type 2718-SP semi-cylinderical heating
units each rated at a maximum wattage of 940.
B. Process Measurements and Control
1. Flow Measurement and Control
R o t a m e t e r s w e r e u s e d f o r a l l f l o w m e a s u r e m e n t s .
The nitrogen gas rotameter was fitted with 1/2 in. o . d . , 16
BWG copper tube which was used with all the rotameters except
17
Swagelok reducer was used downstream from the rotameter
before mixing of the nitrogen gas with the rest of the gases
took place.
Brass check valves with neoprene o- rings and sta
inless steel screens were used at the outlet of each rotame
ter to prevent backmixing of the gases.
2. Temperature Measurement and Control
The temperatures of the gases entering and leaving
the preheater were measured by 1/16 in. od. 20 gauge series
1000 chromel alumel thermocouples.supplied by Thermocouple
Products Co. The thermocouples were enclosed in 1/8 in. o.d.
stainless steel protection tubes which were positioned in the
flanges by means of 1/8 in. Omega stainless steel thermocou
ple connectors. Some static electricity was observed to d e
velop. Grounded thermocouples gave an error of the order of
2 to 3 mV. Since accurate temperature measurement for the
preheater inlet was not necessary, a rough measurement was
accepted for the preheater inlet gases. In the case of the
preheater outlet and reactor bed temperatures, .ungrounded
i
thermocouples were used. This type of thermocouples was not
affected by the static electricity developed in the equip
ment. The thermocouples in the catalyst bed were kept at
a d i s t a n c e o f o n e i n c h f r o m t h e t w o e n d s o£ t h e b e d , w h i l e
providing for the necessary flexibility of movement of the
thermocouples for checking temperature variation inside the
A selector switch was used for thermocouple
conn-ections. The positive terminals of all the thermocouples
were combined whereas the negative terminals were indivi
dually connected to various points on the selector switch.
The leads from the selector switch were connected to a
potentiometer through an ice junction.
The temperature of the. gases leaving the preheater
was controlled b y adjusting the voltage of a 20 ampere
model 9-521-10V2 variable transformer supplied by Fischer
Scientific Co, This transformer controlled the heating
from the semi-cylinderical heaters surrounding the preheater.
The heat loss from the gas lines from preheater
outlet to reactor inlet and from reactor outlet to annulus
inlet were controlled b y controlling the voltage supply
to heating cords b y means of two 10 amperes model 9-521-5V2
variable transformers supplied by Fischer Scientific Co,
The temperature of the catalyst bed was controlled
in two w a y s :
a. B y controlling the temperature of the gases
entering the reactor,
b. By controlling the recirculation of hot
g a s e s i n t h e a n n u l u s .
3. Pressure Measurement and Control
The pressures of carbon monoxide and nitrogen gases
19
ure regulator supplied by the Matheson Company.
The pressure for each gas was measured at
rota-meter inlet conditions using pressure gauges of the follo
wing ranges:
Nitrogen gas 0 to 100 psig
Rest of the gases 0 to 10 psig
Higher range of pressure was used for nitrogen
gas because of its high flow rates. The pressure at the
inlet and outlet of reactor was measured by a pressure I
gauge of range 0 to 10 psig b y using two control valves.
A safety relief valve set at 25 psig was install
ed after the reactor pressure gauge as shown in Fig. 2.
C . Analytical Equipment
The reactant and product gases were analysed using
a series 5,000 selecta system gas chromatograph supplied
b y Barber-Colman Co. of Canada Ltd. This included an
injector bath, a column bath followed by a detector bath,
a six port thermal conductivity detector with W2-X fila
ments and power supply module to the filaments. The
arrangement of the thermal conductivity detector is shown
in Fig. 3. The signals from the detector were recorded
on a strip chart recorder. The temperature of the indivi
d u a l u n i t s was c o n t r o l l e d h y the c o n t r o l a r r a n g e m e n t s
provided on the gas chromatograph.
The injected sample gases passed through a silica gel
column in a 1/4 in. o . d . , 1 ft. long copper tubing followed
by a second column of molecular sieves, which was 11 ft*
p ro d u ce d w ith p e rm is sio n of the c o p y ri g h t o w n e r. F u rth e r re p ro d u c tio n p ro h ib ite d w it h o u t per m is si o n .
S SILICA
5 GEL
5 COLUMN
GAS SAMPLE
VALVE
TO I
4 0 /6 0 MESH 5A
MOLECULAR SIEVE
' T f m m w
-SIX PORT
THERMAL
CONDUCTIVITY
DETECTOR
CELL
TO ATMOSPHERE
TO ATMOSPHERE
EMPTY COLUMN (REFERENCE)
2
21
long in a 1/4 in. o.d. copper tubing. The molecular sie
ve was 5 A, mesh size 40/60 supplied by the Chromatographic
Specialities Ltd. The second column acted as a reference
column and was a 1/8 in o.d. empty copper tubing. Standard
0.13 ml gas sampling valve supplied by Barber-Colman Co.' of
Canada Ltd. was used as Hamilton Gas Tight syringes were
found to be completely unsatisfactory for the precision
required.
The silica gel column gave separation of carbon dio- •
Xide gas from the rest of the g a s e s , whereas the molecular
sieves column gave explicit separation of ; .. oxygen, nitro
gen, ,and carbon monoxide in their order of appearance. The
bands of various gases were fairly well resolved because
the lengths of the columns were decided after some trial
and error. The optimum column lengths were used to get
the best possible separation and a distinct distribution of
residence times of the gases in the columns.
Carbon dioxide was irreversibly adsorbed on the mole
cular s i e v e st however, since the quantities of carbon dio
xide injected very small as compared to the amount of
molecular sieves,.the latter was very slowly destroyed.
The experimental procedures consisted of the follow™
ing:
A . Calibration of Rotameters
All the rotameters were calibrated using a Wet Test
Gas Meter supplied b y Precision Scientific Co. Inlet
temperature and pressure conditions were used for this
calibration. All the rotameter needle control valves were
kept at the outlet as suggested by the manufacturer. The
volumetric flow rates at the conditions of calibration
were then converted to standard conditions (14.7 psia, 70°F)
and molar flow rates were calculated. These were then plot
ted vs. rotameter scale reading (error was + 2%.).
B • Operation of Gas Chromatograph
The following sequential operation was carried outs
1. The flow rate of helium through each of the two
columns was adjusted to 40 ml./min. within + 5 % of each
other.
2. The detector heat was switched on and temperature
controlled at the desired level of 100°C by means of
adjustment on the detector heat control module.
23
at 100°C.
4. The column heat was then turned on. Heat transfer
from the detector and injector heat to column bath (thus
raising column bath temperature even when the column heat
setting is at zero) was observed. Therefore column bath
temperature was controlled at 60°C with the dampers open
to maintain a low temperature in the column.
5. The thermal conductivity cell power supply was
switched on and the current through the filaments adjusted
at 170 m Amperes to get optimum sensitivity without damag
ing the cell filaments.
6. The chart recorder was switched on after the
equipment had stabilized.
7. The analysis of gases b y the gas chromatograph
and its calibration were carried out as detailed later.
The conditions of operation of the gas chromatograph
are summarized in Table 1.5 in Appendix I.
After the gas chromatograph components were stabilized,
each of the gases expected to be encountered in the react
ants and products was injected individually using the gas
sampling valve.
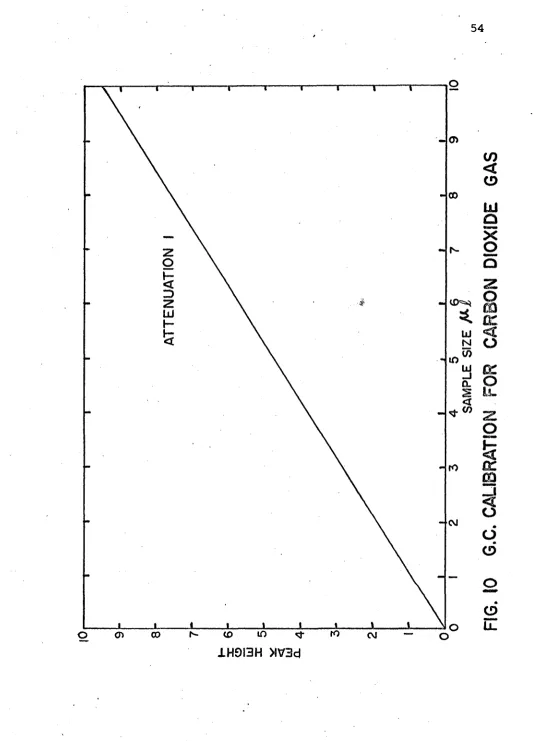
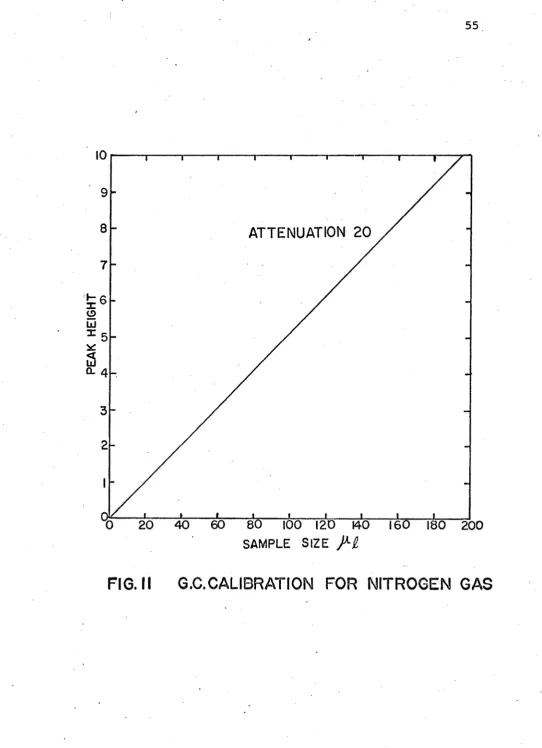
Peak height obtained on the chart recorder for a pure
g a s s a m p l e i n t r o d u c e d w a s c o n s i d e r e d t o g i v e a g o o d
quantitative estimate of the gas and a relationship was
established between the quantity of a particular gas injected
and the peak height. The residence time, which is defined
as the time elapsed between the moment the sample is intro
duced and when the maximum peak height is obtained, was
also noted. This procedure was repeated for each of the
gases.
The conditions of operation of the gas chromatograph
were checked each day a run was made as these were found
to vary slightly at times. The calibration of the chro
matograph was also checked from day to day.
C. Operational Procedure
The reactor was charged with the required amount of
catalyst mixed with the berl saddles. Berl saddles helped
in the maintainance of uniformity in temperature of the
catalyst bed. The thermocouple protection tubes were then
held in place inside the catalyst bed 1 in. from each
end of the bed. This was necessary to know the temperature
distribution inside the catalyst bed.
Air from the compressed air line was allowed to pass
through the system at the desired rate and the preheater
furnace switched on for a few hours to allow the catalyst
to attain constant activity. This was found necessary
because the catalyst activity was found to deteriorate for
the first few hours with air flowing in the system. The
temperature of the preheater outlet gases was c o n t r o l l e d
b y adjusting the power through the heating elements surr
ounding the preheater tube. The temperatures of the heating
25
by separately controlled variable transformers.
The reactor feed gases were then fed to the system at
the desired rate. The temperature at the top and the bottom
of the reactor bed was regularly noted. Both of these
temperatures were observed to rise continuously at a steady
rate. However difference in temperature between the top
and bottom part of the reactor was quite significant with
the "reactor top temperature 20 to 50°C above the reactor
bottom temperature. If this were allowed to exist, the
precision of the temperature at which the data is taken
is completely lost.
To overcome this problem two methods were used in
co-ordination with each other in order to be able to take
the data at a particular temperature. In the first place,
the temperature as indicated by the thermocouple in the top
portion of the reactor was allowed to rise above the temp
erature level at which the data were desired. The reactor
bottom temperature was also allowed to rise to a temperature
level w hi ch-A-s a few degrees below the desired temperature
( the exact levels to which the top and bottom portion of
the reactor should be allowed to rise can be decided only
b y experience). The heat input to the heating elements of
t h e p r e h e a t e r a n d t o t h e h e a t i n g c o r d s o n t h e t u b e c o n n
ecting the preheater to the reactor was then considerably
reduced so that the temperature of the reactor top started
falling after a while whereas reactor bottom temperature
209980
continued to rise slowly till the temperature at which the
VJRtj
data are taken 4~s reached simultaneously in both the react
or top and bottom portion. The product gases continued
to pass through the gas sampling valve and .were injected
into the gas chromatograph at the proper instant. A mini
mum of two samples were analysed in this way for each run
and the reproducibility of the results was carefully
chedked. The error in analysis b y means of the gas
V I . RESULTS AND DISCUSSION
The analysis of integral plug flow reactor data is
much more difficult compared to either the differential
reactor or the continuous stirred tank catalytic reactor.
The use of the latter has very recently been demonstrated
by Tajbl et. al. (24). Also the temperatures in the inte
gral reactors are difficult to maintain especially for i
highly exothermic and highly endothermic reactions. The
study of such reactions for significant conversions h a s ,
therefore, long been avoided under plug flow conditions.
Because of the design of the reactor and operating
procedure developed during the course of this investigation
it was possible to study the kinetics of the highly exo
thermic catalytic oxidation of carbon monoxide in essent
ially a conventional integral plug flow reactor surrounded'
b y an annulus through which the hot product gases pass and
help in the maintenance, of isothermal conditions in the
reactor. This was achieved without any direct external
heating of the reactor. The reactor bed temperatures could
be controlled to a maximum variation of + 2°C (+ 1°Q for
most of the r u n s ) from the desired temperature. For an
integral reactor, temperature control of this order can be
considered as being very precise.
• 27
In order to avoid the effects of axial mixing upon the
kinetics of the chemical reaction, the axial aspect ratio
,60 was used in this investigation in conformity with 30
or more suggested b y Carberry (5,6). It was therefore
ensured that axial mixing does not affect the reaction
kinetics of carbon monoxide oxidation.
Radial heat transfer gradients were also considered
to be important f .v this investigation. The passage of
reactor outlet gases through the annulus surrounding the
catalyst bed was found to be extremely helpful in contro
lling the radial heat transfer gradients at a low level.
This was due to the fact that the gases flowing in the
annulus were approximately at the same temperature as the
reactor bed.
Mass and heat transfer effects were calculated and
found to be negligibly small under the experimental
conditions. The method of calculation is illustrated in
Appendix IV.
Differentiation of the integral reactor data comp
licates the analysis and the data lose some precision.
The equation of the plug flow catalytic reactor i.e.,
can therefore be used in order to evaluate various models
which will now be listed (26).
(Z/dp) was considered carefully. An axial aspect ratio of
29
For the reaction,
or,
aA + bB = rR
kP2 + CO = c o 2
the merAarrrirsti^c rate equations for different rate contro
lling steps can be written as follows:
Controlling step U ’ i:' Rate Equation
Surface reaction between chemisorbed A and B
Adsorption of A without disso ciation of A
Adsorption of A with dissociation of A (all compo nents other than A at equilibrium adsorption without dissociation)
3r
ks (aA aB “ k~) KaKb
ka(aA“
K ( 1‘!'KA aA +KBaB *KR aR )
...(
6
.
2
)
1
(1-f + KRaR +KHaR )
K aB
...(6.3)
K {l+// ,F ^ &+KBaB +KR aR^
K a B
...(6.4)
Desorption of R k ,d (Ka^aB “aR )*
(1+KA aA +KRaR +KKR aA aB)
...(6.5)
The values for chemical equilibrium constant K for
this reaction were calculated and found to be of the order
of 1 0'
therefore be dropped. As mentioned in Chapter II, Stephens
(2 2) has established that carbon monoxide is very highly
.35
The term aR/K in all the above expressions can
adsorbed on palladium surfaces. Assuming that the term KBaB
is very large as compared to the other adsorption terms.
These simplifications lead one to the following equations;
For the case when surface reaction is. rate contro
lling ,
/ ^ aA aBKA KB
B s 1 11 -ir 1 2 ...(6.6 )
(1 + KBaB )
For high values of Kfia B ; (KBafi» 1), this reduces to
the expression; i
(~rB ) = k ...(6.7)
° B
With the adsorption of A without the dissociation of
A as the rate controlling step, equation is simplified
to,
a
(-rB ) = k — ». ...(6.8)
a a (ltKBaB )
This equation for high values of K a can be written
B B
a s :
(-rB ) = k ...(6.9)
which is the same as equation 6.7.
W ith dissociative adsorption of A as the rate contr
olling step, equation 6.4 can be written as;
(-r ) = -- ---— 2 ...(6.10)
For desorption of R as the rate controlling step,
the term Ka^ag is very large compared to the term aR in
the numerator because of the very high value of K and
therefore Eqn. 6.5 can be simplified to the following exp
ression;
(-rB ) = k ...(6 .1 2 )
i.e., the rate of CO oxidation is independant of the conc
entration of the reactant and product species.
The.right hand side of Eqn. 6.1 was then integrated
using the simplified models listed above. The integrated
expressions excluding the yet unknown multiplied term 1/k
were plotted as absissae against W/f as ordinate. Equations
6.8, 6.1 0, and 6 . 1 1 gave non linear plots and were therefore
.rejected as plausible m o d e l s ,whereas Eqn. 6.12 was found to
be inconsistent w i t h the experimental data because the reac
tion rate was not found to be concentration independant and
I .
-was rejected on this basis. A linear relationship is expec
ted if the model being tested is correct. This criterion
gives a sound^method for the acceptance or rejection of
a rate equation. Equations 6.7 a n d 6,9 w h i c h a r e e s s e n t i
ally the same in their simplified forms gave straight lines
o o
on these plots at all the temperature levels (170 C, 180 C,
and. 195°C ) studied thus confirming the validity of the
mode 3.:
• • •(6.7)
With this model, the integrated right hand side of
eqn. 6 . 1 without the unknown factor 1/k can he written as:
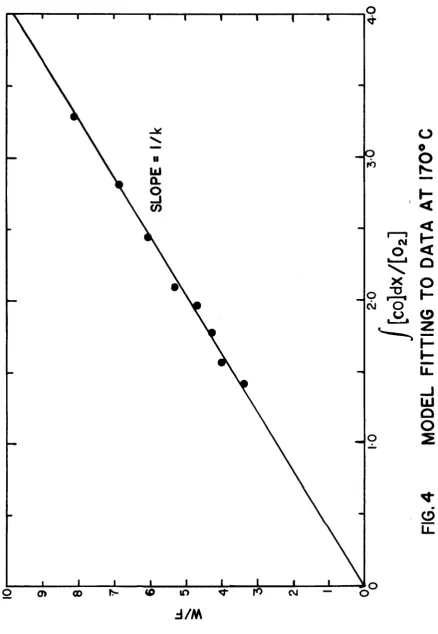
The plots of the right hand side of eqn. 6.13 (without
the unknown multiplied term 1/k) as abscissa against W/F
as ordinate have been presented in Figs. 4, 5, and 6.
These plots were then used to determine the slope which is
equal to 1/k, from where k values at various temperatures
were determined. All these plots gave straight lines
passing through the origin within the limitations of the
experimental errors. Obviously, this is one of the necess
a ry conditions for the reaction rate model to be valid.
The k values determined from the slopes of these plots
were then used to determine the energy of activation
according to Arrhenius’ law. Ln k was plotted as ordinate
against 1/T as abscissa and a straight line relationship
was obtained. The slope of this straight line gave the
value of - E / R > from where the energy of activation was
computed. Statistical analysis showed that the model
33
CO
“O
to
CM00
d / M
Reproduced with permission of the copyright owner. Further reproduction prohibited without permission.
F
IG
.
4
M
O
D
E
L
F
IT
T
IN
G
TO
D
A
T
A
AT
17
0®
W
/F
SLOPE = 1/k
i-o
2-a
yo
4o
I
[c o ]d x /[
02
]
FIG.5
MODEL F IT T IN G TO DATA
5 0
35
Li.
j
[co)dx/[ot]
FI6.6 MODEL FITTING TO DATA AT I95°C
UL
*— 5
:
1
---ggfeg
i
(u
0 6/xo
p
s9i
OLU chKjhX4d° sqiJ
[OD
P s9|Oiu qj
j
<o in (VI CM
F
IG
.7
A
R
R
H
E
N
IU
S
P
L
O
T
O
F
L
O
O
K
v
s
l/
37
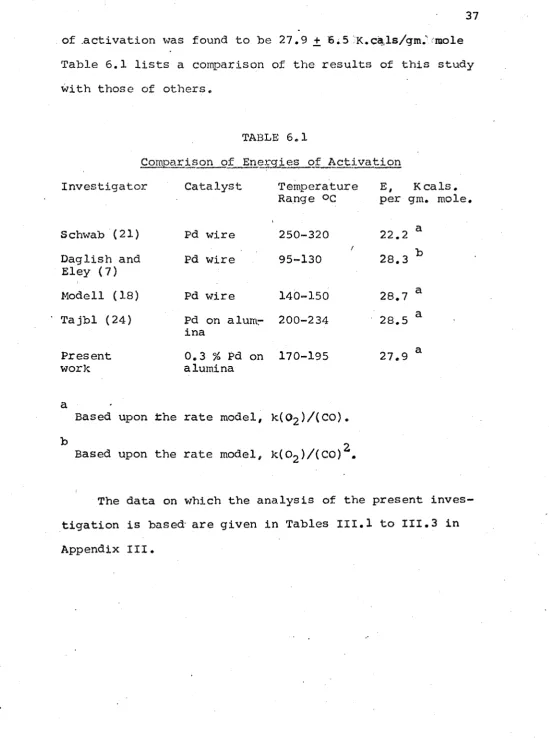
of .activation was found to be 27.9 + 6.5 K.cals/gm.‘ mole
Table 6.1 lists a comparison of the results of this study
with those of others.
TABLE 6.1
Comparison of Energies of Activation
Investigator Catalyst Temperature E, Kcals.
Range °C per gm. mole.
S chwab (21)
Daglish and Eley (7)
Modell (1 8)
Tajbl (24)
Present work
Pd wire
Pd wire
Pd wire
250-320
95-130
140-150
Pd on alum- 200-234 ina
0.3 % Pd on 170-195
alumina
22.2
28.3
28.7
28.5
27.9
Based upon the rate model, k(0 2)/(CO)
Based upon the rate model, k(C>2 )/(C0 )
The data on which the analysis of the present inves
tigation is based- are given in Tables III. 1 to III.3 in
Appendix III.
\
An experimental investigation has been carried out on
the kinetics of the catalytic oxidation of carbon monoxide
on 0.3 % Pd catalyst on alumina in an integral plug flow
reactor with a modified design. The modified design and
the catalyst bed to a minimum. Isothermal conditions in the
ol of temperature at the level at which the data were requi
red. The axial aspect ratio, Z/dp , was kept at a level that
assured plug flow conditions.
The rate model for the system has been established and
is found to conform to some of the earlier investigations
(18, 21, 24) on Pd wire and on Pd on alumina catalyst, but
disagrees with the investigation of Daglish and Eley (7).
u " A
tion amongst rival rate'models. The rate equation th
described the data most satisfactorily is as follows: operating procedure kept the heat transfer gradients in
reactor could thus be achieved. This allowed precise contr
*A
against W/f allowed
discrimina-“r co
7.4 e“2 7 •90°/RT (02 ) (CO)where, -r
CO
reaction rate in Ifr-mp 1.es 0f CO converted
(lb c a t ) (h r )
R = gas constant,= 1.987 cals/(gm mole)(°K)
39
(02)# (CO) = concentration of oxygen and carbon monoxide, respectively,
(lb moles/eu ft)
which is a simplified form of the rate equation with either
the oxygen chemisorption as the rate controlling step or
the surface reaction between chemisorbed CO and O2 as the
rate controlling step. High adsorptivity of carbon monoxide
on palladium has been established in the work of Stephens
(2 2), and has been used in this investigation for'the
simp-lification of the control rate equations.
The validity of this rate model in conformity with the
results of most of the other investigators indicates very
strongly the possibility of use of the conventional plug
<
flow reactors with the modified design in the study of
high-ly exothermic catahigh-lytic reactions even at significant conv
ersion levels.
It is therefore recommended that the feasibility of
using such reactors with modified design be studied-for
other suitable reactions as well and that the integral plug
flow catalytic reactor not be rejected premptorially.
A " component
a s : concentration 'of'reacting species, Ib.moles/cu.ft.
?
a m = area of particle per unit, mass, ft.'/lb.
av ~ area of particle per unit volume of bed, ft?/ft?
B " component
b = number of moles of B
I ,
Cp ~ heat capacity per unit mass at constant pressure
D = diffusion coefficient
Da- B ' DA-R ^ diffusion coefficient in binary systems
D rn„£ diffusion coefficient (mean) of component B in a
multicomponent system
E ~ Effectiveness factor
E = energy of activation ' . ,
F = molal flov/ rate of CO, lb. moles/hr.
F = bulk mass flow rate of gases, lb. mass/hr.
G = mass velocity„of gas based on total cross section of
bed, lbs./(ft.)(hr.)
G m '7 molal mass velocity of gas based on total cross sect.
ion of the bed, lb. moles/(ft.)(hr.)
A.Hg = molal heat of reaction of component B, Btu/lb. moles
jD = mass transfer number
jH « heat transfer number
4 1
» reaction velocity constant
= thermal conductivity
= molecu3.ar weight
= Prandtl number s (Cp/O/k
= partial pressure of component B in ambient fluid, atm.
=5 partial pressure of component B at the catalyst surf
ace, atm.
a pressure factor for component B
K (am ^ ®m^
a Reynolds number■, = G/(av </?/ c)
= number of moles of R - '
=* molal reaction rate of component B, lb. moles of B converted/(h r .)(lb. of catalyst)
= Schmidt number = / V p D
a* temperature, °K
-• time, hrs.
W ■ = mass of the catalyst, lbs.
X conversion, lb. moles of B converted/(lb. of catalyst)
: (hr.)
~ mole fraction of pressure factor
•^fB =. mole fraction of pressure factor for component B
Greek Letters ,
A = difference
A = v i s c o s i t y of f l u i d , Xb.irass/(ft.) (hr.)
tt ' ~ total p r e s s u r e, atm,
3
P s= density of the fluid, lbs./ft.
3
p = bulk density of the catalyst bed, lbs of catalyst bed/ft.
k k M Pr P B PBi
• P fB
R
Re
r
r _
rnB
Sc
T
t
= shape factor
Subscripts
A,B,R = components
D « diffusion
• f ' q; film
H » heat transfer
i i= component
m = mean
m = raolal property
REFERENCES
1. B a k e r , M. McD. and G . I . Jenkins, "Advances in Catalysis.
Vol. VII, p. 1, Academic Press, Inc., New York (1955).
2. deBoer, J.H., Advances in Catalysis, Vol. VIII, p. 18,
-(•Academic Press I n c . , New York (1956).
3. Caplan, John D . , The Automobile Manufacturer 1s Vehicle
! Emissions Research Program, Jl. of Air Polln. Contr.
A s s n . , 13 (3) , 105 - 108 (~1963).
4. Carberry, Jarnes J . , First Order Rate Processes and Axial
Dispersion in Packed Bed R e a c t o r s , Can. Jl. of Chem. ■Eng., 36, 207-209 (1958).
5. Carberry, James J . , and M.M. Wendel, A Computer Model
of the Fixed Bed Catalytic Reactors-The Adiabatic and Quasi-Adiabatic C a s e s . A.I.Ch.E. J l . , 9, (1), 129
(1963).
6. Carberry, James J . , Designing Laboratory Catalytic
Reactors, I.&E.C., 56, (11), 39-46 (1964)
7. Daglish, A.G. and D/.D. Eley, The Carbon Monoxide-Oxygen
Reaction on Palladium Gold A l l o y s . 2nd. International Congress on Catalysis, Vol. I I , pp. 1615-1624 (1961).
8. DamKohler, G. and R. Edse, Z. Physik. Chem. B 5 3 . 117
(1943)
9, Dixon, J.K. and J.E. Longfield, Catalysis, T.t 281 (I960).
10. Dixon, J.K. and J.E. Longfield, Catalysis, Vol. V,
pp. 303-322, Reinhold Publishing Corporation, New York (1960).
43
11. Elliott, M . A . , G.J. Nebel and F.G. R o u n d s , The Compo-sition of -Exhaust Gases from Diesel, Gasoline and
Propane Powered Motor Co a c h e s . Jl. of Air Folln. Contr. A s s n . , 5 ( 2 ) , 103-108 (1955).
12. Faith, W . L . , Automobile Exhaust Control D e v i c e s , Jl, of
Air Polln. Contr. A s s n . , 13 (1), 33-35,39 (1963).
13. Hauffe, K » „ Advances in Catalysis. Vol. VII, p . 213,
Academic P r e s s , I n c . , New York (1955).
14. Hougen, O . A . , Engineering Aspects of Solid Catalysts,
I.&E.C., 5.3, (7), 509-528 (1961).
15. Hougen, O.A. and K.M. Watson, Chemical Process Principl
es . Vol. 3, John Wiley and Sons, Inc., New York (1947).
16. Katz, M . , Advances in Catalysis, Vol. V, p. 177,
Academic Press, I n c . , New York (1953).
17. Lead in Gasoline Controvercy. C h . E . , 74, (3), 51 (1967).
18, Modell, M . , D.Sc. Thesis, Massachusetts Institute of
Technology, (1964).
19. Mulay, Avinash G . , Catalytic Oxidation of Carbon Mono
xide at Low Concentrations„ Ph.D. T h e s i s , University of Wisconsin (1961)•
20. Parravano, G. and M. Bo u d a r t , Advances in Catalysis.
Vol. V I I , p. 50, Academic P r e s s , I n c . , New York (1955).
21. Schwab, G . M . (and K. Gossner, Z. Physik. Chem. Neue Folge,
16, 39 (1958).
22. Stephens S.J., Jl'. Phys. Chem. 63, 188 (1959).
23. Suhrmann R . , Advances in Catalysis, Vol. V I I , p . 303,