Changes of Cine Cerebrospinal Fluid Dynamics in
Patients with Multiple Sclerosis Treated with
Percutaneous Transluminal Angioplasty:
A Case-control Study
Robert Zivadinov, MD, PhD, Christopher Magnano, MS,
Roberto Galeotti, MD, Claudiu Schirda, PhD, Erica Menegatti, PhD,
Bianca Weinstock-Guttman, MD, Karen Marr, RVT, RDMS,
Ilaria Bartolomei, MD, Jesper Hagemeier, MS, Anna Maria Malagoni, MD, PhD,
David Hojnacki, MD, Cheryl Kennedy, LMSW, MPH, Ellen Carl, PhD,
Clive Beggs, PhD, Fabrizio Salvi, MD, and Paolo Zamboni, MD
ABSTRACT
Purpose: To investigate characteristics of cine phase contrast-calculated cerebrospinal fluid (CSF) flow and velocity measures in patients with relapsing-remitting (RR) multiple sclerosis (MS) receiving standard medical treatment who had been diagnosed with chronic cerebrospinal venous insufficiency (CCSVI) and underwent percutaneous transluminal angioplasty (PTA).
Materials and Methods:This case-controlled, magnetic resonance (MR) imaging–blinded study included 15 patients with RR MS who presented with significant stenoses (Z50% lumen reduction on catheter venography) in the azygous or internal jugular veins. Eight patients underwent PTA in addition to medical therapy immediately following baseline assessments (case group) and seven had delayed PTA after 6 months of medical therapy alone (control group). CSF flow and velocity measures were quantified over 32 phases of the cardiac cycle by a semiautomated method. Outcomes were compared between groups at baseline and at 6 and 12 months of the study by mixed-effect model analysis.
Results: At baseline, no significant differences in CSF flow or velocity measures were detected between groups. At month 6, significant improvement in flow (Po.001) and velocity (P ¼.013) outcomes were detected in the immediate versus the delayed group, and persisted to month 12 (P¼.001 andP¼.021, respectively). Within-group flow comparisons from baseline to follow-up showed a significant increase in the immediate group (P¼.033) but a decrease in the delayed group (P¼.024). Altered CSF flow and velocity measures were associated with worsening of clinical and MR outcomes in the delayed group.
Conclusions: PTA in patients with MS with CCSVI increased CSF flow and decreased CSF velocity, which are indicative of improved venous parenchyma drainage.
From the Buffalo Neuroimaging Analysis Center (R.Z., C.M., C.S., K.M., J.H., C.K., E.C.), Jacobs Neurological Institute (R.Z., B.W.-G., D.H.), University at Buffalo, 100 High St., Buffalo, NY 14203; Vascular Disease Centre (R.G., E.M., A.M.M., P.Z.), University of Ferrara, Ferrara; Bellaria Neurosciences (I.B., F.S.), Bologna, Italy; Centre for Infection Control and Biophysics (C.B.), University of Bradford, Bradford, United Kingdom. Received October 31, 2012; final revision received January 15, 2013; accepted January 18, 2013. Address correspondence to R.Z.; E-mail:
This study was funded by the research funds of the Hilarescere Foundation, Buffalo Neuroimaging Analysis Center, and Jacobs Neurological Institute at the University at Buffalo, Buffalo, New York. R.Z. received personal compensation from Teva Pharmaceuticals, Biogen Idec, EMD Serono, Novartis, Genzyme– Sanofi, and Bayer for speaking and consultant fees and financial support for
research activities from Biogen Idec, Teva Pharmaceuticals, Genzyme-Sanofi, Novartis, and EMD Serono. B.W.-G. received personal compensation for consulting, speaking, and serving on a scientific advisory board for Biogen Idec, Teva Neuroscience, and EMD Serono and financial support for research activities from the National Multiple Sclerosis Society, National Institutes of Health, Immune Tolerance Network, Teva Neuroscience, Biogen Idec, EMD Serono, and Aspreva. D.H. received speaker honoraria and consultant fees from Biogen Idec, Teva, EMD Serono, and Pfizer. F.S. and P.Z. received funds for the present study from the Hilarescere Foundation, Bologna, Italy. None of the other authors have identified a conflict of interest.
&SIR, 2013
J Vasc Interv Radiol 2013; 24:829–838
ABBREVIATIONS
CCSVI = chronic cerebrospinal venous insufficiency, CSF = cerebrospinal fluid, DMT = disease-modifying treatment,
EVT-MS = endovascular treatment for multiple sclerosis [study], FA = flip angle, FOV = field of view, IJV = internal jugular vein, MS = multiple sclerosis, PTA = percutaneous transluminal angioplasty, ROI = region of interest, RR = relapsing-remitting, SSS = superior sagittal sinus, TE = echo time, TR = repetition time, WB = whole brain
Chronic cerebrospinal venous insufficiency (CCSVI) has been described as a vascular condition characterized by anomalies of the main extracranial cerebrospinal venous routes that interfere with normal venous outflow in patients with multiple sclerosis (MS) (1–4). Recent studies demon-strated that these venous abnormalities are not exclusive to patients with MS and that patients with other neurologic diseases or even healthy individuals can present with these anomalies (5–8). The clinical and magnetic resonance (MR) imaging correlations of these findings are still unknown, and, at this time, it is not clear whether CCSVI may influence disease progression in MS (9–13) or play a role in CCSVI-induced cerebral fluid-dynamic alterations in MS and in healthy individuals (14).
Percutaneous transluminal angioplasty (PTA) for CCSVI-related abnormalities was introduced in an open-label study (1,15) that evaluated its safety and efficacy on clinical and MR imaging outcomes in 65 patients with MS over 18 months (1) and 24 months of follow-up (15). Additional open-label studies (16–19) confirmed that the PTA procedures are relatively safe. However, these studies were not blinded, controlled, or randomized, and patients were not stratified with respect to their standard disease-modifying treatment (DMT) during the follow-up. Only one controlled pilot study (20) investigated the safety and efficacy of PTA for CCSVI-related abnormalities in patients with relapsing-remitting (RR) MS. Although this small pilot study showed that PTA of CCSVI was related to partial improvement in clinical and MR imaging outcome measures of patients with MS, it could not recommend PTA as a treatment for MS and warranted placebo-controlled trials with a larger number of patients and use of more advanced imaging techniques to assess cerebral fluid-dynamic changes after PTA. Therefore, at this time, it is unknown whether PTA for CCSVI can improve CCSVI-induced cerebral fluid-dynamic abnormalities in patients with MS or with other neurologic diseases, or in healthy individuals.
Given that CCSVI is characterized by stenosis of the cerebral venous drainage system, there is reason to believe that the condition might induce subtle venous hypertension in the superior sagittal sinus (SSS), which in turn would tend to reduce the bulk flow of cerebrospinal fluid (CSF) into the sinus from the subarachnoid space—a finding that was shown in a recent pilot study that included a small number of patients with MS in addition to controls (21). This has led us to hypothesize that CCSVI might be having an effect on the CSF fluid dynamics in patients with MS.
To explore this issue, the present study was designed to investigate whether PTA in patients with MS receiving
standard DMT and diagnosed with CCSVI can modify characteristics of CSF flow and velocity outcomes.
MATERIALS AND METHODS
The Endovascular Treatment for MS (EVT-MS) study is a pilot collaborative 12-month study that involved 15 patients with relapsing-remitting (RR) MS who underwent PTA for CCSVI-related venous abnormalities (20). All patients underwent clinical and Doppler sonography evaluations at baseline and at 3, 6, 9, and 12 months, whereas the MR imaging outcomes were collected at baseline and at 6 and 12 months. The primary endpoints of the EVT-MS study were to assess the effect of PTA on safety, patency rate, and accumulation of new brain lesions and lesion volume, as well as relapse rate, over a period 12 months. The secondary endpoints of the study were to assess the efficacy of PTA on clinical outcomes and changes in whole brain (WB) volume. The detailed findings of these analyses were previously reported (20). The tertiary endpoint of the EVT-MS study was to determine the effect of EVT-MS on advanced brain MR imaging measures, possibly related to fluid-dynamic changes after PTA treatment. Hence, in the present study, which is based on the original dataset derived from the EVT-MS study (20), CSF flow and velocity analyses are presented for the 15 patients with RR MS who underwent PTA for CCSVI-related venous abnormalities. The study protocol was approved by local ethical committees.
The original EVT-MS study (20) was designed to have half the cohort treated with PTA at baseline (immediate treatment group) and half the cohort undergo delayed treatment with PTA at 6 months (delayed treatment group). All subjects were followed for 12 months from baseline; hence, the immediate treatment group was evaluated after PTA for 12 months, whereas the delayed treatment group was evaluated before PTA for 6 months and after PTA for 6 months. Therefore, the delayed
treatment group served as a control against the
immediate treatment group during the first 6 months to allow the exploration of clinical and MR imaging differences between those who were treated at baseline and those whose treatment was delayed for 6 months. In addition, this type of design allowed us to determine post-PTA changes on CSF flow and velocity measures between the two treatment arms from months 6 to 12. Patients were selected randomly to undergo PTA immediately after baseline screening, as previously described (20).
The inclusion criteria for the present study were a diagnosis of MS (22), presence of RR MS (23), age of
18–65 years, Expanded Disability Status Scale score of 0–5.5 (24), CCSVI-positive Doppler sonography findings at screening visit (2), significant stenoses considered to represent azygous or internal jugular vein (IJV) lumen reduction of at least 50% on catheter venography preceding PTA, treatment with Food and Drug Administration– approved DMT for the whole duration of the study (both treatment arms), and normal kidney function (creatinine clearance459mmol/L). Exclusion criteria were relapse of MS, disease progression and steroid treatment within 30 days before study entry, preexisting medical conditions known to be associated with brain pathologic conditions (eg, neurodegenerative disorder, cerebrovascular disease, positive history of alcohol abuse), pregnancy, or contra-indication to contrast agents.
Doppler Sonography
Extra- and transcranial Doppler sonography was performed on a color-coded Doppler sonography scanner (MyLab 25; Esaote-Biosound, Irvine, California) equipped with a 5.0–10-Mhz transducer to examine venous return in the IJVs and vertebral veins at baseline and 6 and 12 months. The Doppler sonography examination was performed by a trained technologist who was blinded to treatment group status. The following five venous hemodynamic parameters indicative of CCSVI were investigated: (i) reflux/bidirec-tional flow in the IJVs and/or vertebral veins in sitting and supine positions, defined as flow directed toward the brain for a duration of more than 0.88 seconds; (ii) reflux/ bidirectional flow in deep cerebral veins, defined as reverse flow for a duration of 0.5 seconds in one of the intracranial veins; (iii) presence of B-mode intraluminal defects or stenoses in IJVs (IJV stenosis is defined as a cross-sectional area of this veinr0.3 cm2); (iv) flow that is not Doppler-detectable in IJVs and/or vertebral veins despite multiple deep breaths; and (v) reverted postural control of the main cerebral venous outflow pathway by measuring the differ-ence of the cross-sectional area of the IJVs in the supine and upright positions. A subject was considered CCSVI-positive at screening and during the follow-up if at least two venous hemodynamic criteria were fulfilled (2).
Catheter Venography and PTA
All invasive interventions took place at the same location (University of Ferrara, Ferrara, Italy). Patient assignment to the immediate or delayed treatment arm was performed immediately after baseline screening, as previously described (20).
First, catheter venography of the major extracranial and extravertebral segments of the cerebrospinal veins was per-formed under local anesthesia, preceding the PTA treatment, to confirm the sonographic findings. A 9-F sheath was inserted into the common femoral vein. Through this, angiographic catheters were used to catheterize and perform contrast catheter venography of the azygous vein in a right posterior oblique projection (range, 151–251). The azygous system was
opacified to include its cephalic azygous vein and hemi-azygous veins to the ascending lumbar veins. Right and left IJV digital subtraction venography followed. Twelve milli-liters of contrast medium (iodixanol; Visipaque 270 mg/mL; GE Healthcare, Milwaukee, Wisconsin) was hand-injected manually in an anterior–posterior projection. Significant stenoses, defined as lumen reduction of at least 50% on catheter venography, were treated. In addition, a compliant balloon was inflated in the following circumstances: (i) if a pressure gradient of at least 1 cm/H2O was measured across
the stenosis; (ii) at the azygous level, if reflux downward of the left renal vein and/or prolonged stagnation of contrast dye in the extravertebral plexus was detected with low flow injection (2–4 mL/s); and (iii) at the IJV level, if Doppler sonography and/or catheter venography demonstrated an intraluminal abnormality contributing to lumen stenosis.
Balloon angioplasty of stenosed IJVs was repeatedly performed with compliant balloons (10–14-mm diameter, 2–4-cm length; OPTA Pro; Cordis, Roden, The Netherlands) inflated to 8 atm for 30–60 seconds. Azygous vein narrow-ings were dilated with 8–10-mm-diameter balloons 2–6 cm in length. Smaller-caliber balloons were selected in cases of severe atresia or segmental hypoplasia. PTA was repeated with a high-pressure balloon (Atlas [Bard, Murray Hill, New Jersey] or Blue Max [Boston Scientific, Natick, Massachu-setts]) of equal diameter and length as the compliant balloon in the event of inadequate venographic outcomes. The compliant balloons were used for therapeutic dilation and also as a means to assess the resistance of the stenosis and the degree of ‘‘waist’’ seen on the balloon during maximum dilation. A 5-mm cutting balloon (Boston Scientific) was reserved for cases of severe hypoplasia of the left IJV. A 14-mm balloon was used in case of a right IJV septum (despite an otherwise wide cross-sectional vein area).
Five thousand international units of unfractionated heparin were administered during the morning procedures. For patients judged to be at high risk, this was followed by subcutaneous injection of prophylactic doses of low molec-ular weight heparin in the afternoon, which was maintained once daily for 3 weeks as previously reported (1,20).
MR Image Acquisition and Analysis
Image acquisition. All subjects were examined on a 3.0-T Signa EXCITE HD 12.0 Twin Speed eight-channel head-coil scanner (GE Medical Systems, Milwaukee, Wisconsin) at the same location. All MR image analyses were performed in a blinded manner with respect to study group assignment.
MR imaging sequences included (i) two-dimensional multiplanar dual fast spin-echo proton density and T2-weighted imaging, (ii) fluid-attenuated inversion-recovery, (iii) three-dimensional high-resolution T1-weighted imag-ing with a fast spoiled gradient-echo with magnetization-prepared inversion recovery pulse, (iv) spin-echo T1-weighted imaging with and without a single intravenous bolus of 0.1 mMol/kg Gd-diethylenetriaminepentaacetate
5 minutes after injection, and (v) cine phase contrast imaging for CSF flow estimation. All sequences were acquired with a 256256 matrix, one average, and no gap between slices. The relevant parameters were as follows. For dual fast spin-echo proton density/T2-weighted imaging, spin-echo time (TE) and repetition time (TR) were 9/98 ms (TE1/TE2) and 5,300 ms, respectively, with a flip angle (FA) of 901and an echo train length of 14. The fluid-attenuated inversion-recovery sequence had a TE of 120 ms, TR of 8,500 ms, and inversion time of 2,100 ms, with an FA of 901and echo train length of 24. Spin-echo T1-weighted imaging had a TE of 16 ms and TR of 600 ms, with an FA of 901. Three-dimensional high-resolution T1-weighted imaging had a TE of 2.8 ms, inversion time of 900 ms, and TR of 5.9 ms, with an FA of 101.
CSF flow quantification was performed by using a cine phase-contrast velocity-encoded pulse-gated single-slice gradient-echo sequence with a TE of 7.9 ms and TR of 40 ms, a slice thickness of 4 mm, a velocity encoding of 20 cm/s, and 32 phases acquired corresponding to the cardiac cycle (25). Other relevant scan parameters included an FA of 201, field of view (FOV) of 10.0 cm, and phase FOV of 100%. A sagittal T2-weighted fast spin-echo sequence was also acquired as a localizer for the cine phase-contrast prescription (25). All subjects underwent the MR imaging examination during the same time of day (in the afternoon hours) to monitor for circadian variation. The cine phase-contrast sequence was acquired with the aqueduct of Sylvius in the center of the FOV, such that the wraparound artifact was present in the edges of the FOV but did not overlap with the desired region of interest (ROI).
Cine phase-contrast image analysis. Briefly, CSF flow data was processed by using GE ReportCard software (version 3.6; GE Healthcare), and peak positive and negative velocities for each phase were recorded. A semiautomated minimum area contour change program was used to correct the ROIs for each phase (25). Minimum area contour change allows subvoxel accuracy and automatically determines the edges of an ROI by selecting a surrounding isocontour curve that marks the steepest overall gradient of image intensity values. Positive and negative flows were calculated by using only the phases that have positive and negative velocities,
respectively. CSF flow measures are presented in
microliters per beat (mL/beat; 1 mL ¼ 1 mm3), whereas CSF velocity measures are presented in centimeters per second. The maximum positive and most negative velocity values over all 32 phases were defined. CSF flow direction was calculated based on slice prescription such that flow through the aqueduct of Sylvius out of the slice (during diastole, toward the third ventricle) was given as positive, whereas flow into the slice (during systole, toward the fourth ventricle) was negative. The reproducibility of the method was previously reported (25).
Conventional MR imaging analyses. WB volume changes were assessed by using the structural image
evaluation using normalization of atrophy method on the three-dimensional T1 lesion in-painted inversion-recovery fast spoiled gradient-echo scans (26). T2, T1, and contrast-enhancing lesion volumes were calculated by using a semiautomated edge-detection contouring-thresholding technique (27).
Statistical Analysis
Statistical analysis was performed by using SPSS (version 16.0; SPSS, Chicago, Illinois). For comparisons between the groups, the w2 test, Mann–Whitney U rank-sum test, and Studentt test were used as appropriate.
The evolution of CSF flow and velocity characteristics in the immediate and delayed treatment groups over the 12-month follow-up was performed by using a mixed-effect model in which each of the 32 measured phases of the cardiac cycle were equally weighted in the model, rather than net effects. The data was calculated within and between treatment groups at 0, 6, and 12 months of the study. The Spearman rank-correlation coefficient was used to determine the relationship between CSF flow and velocity measures, as well as other clinical and MR imaging outcomes, over 12 months in the immediate and delayed treatment groups.
Given the pilot nature of the study, the significance was set toPo.05. AllPvalues were based on two-tailed tests.
RESULTS
Baseline Demographic, Clinical, Venous,
and MR Imaging Characteristics
There were no significant baseline demographic
(P4.298), clinical (P4.113), or venous abnormality (P4.455) differences between the MS treatment groups (Table 1). All patients were receiving an unchanged DMT regimen for at least 6 months before enrollment, and the type of DMT was well matched between the two treatment groups (P ¼ .324; Table 1). No DMT changes occurred during the study.
The patients fulfilled a median of four venous hemody-namic criteria on Doppler sonography at screening (Table 1), and catheter venography confirmed significant stenoses in azygous veins or IJVs of at least 50% in all cases. Stenoses of at least 50% were detected in 64% of the azygous veins, 43% of the right IJVs, and 50% of the left IJVs. Segmental hypoplasia was found in 22% of the right IJVs and 43% of the left IJVs; 36% of the azygous veins, 35% of the right IJVs, and 7% of the left IJVs showed no stenoses.
No significant differences were found at baseline in lesion (P4.195) or brain volumes (P4.078) or CSF flow (P4.223) or velocity (P4.395) measures between the two treatment groups (Table 2).
Safety and Tolerability
No adverse events or major complications were reported, and patients were discharged the same day, as previously reported (20). No bleeding, vein dissection/rupture, thrombosis, arrhythmia, or allergy or other problems related to contrast media were detected. Transitory and tolerable neck and/or retrosternal pain was reported by
practically the entire cohort at balloon inflation and/or at catheterization of small veins; transitory postprocedural headache was reported by three patients. Patients were discharged the same day. One case of vasovagal syncope was reported 3 hours after the procedure. One patient in the delayed group dropped out of the study at the 3-month follow-up for a family reason unrelated to the study (20).
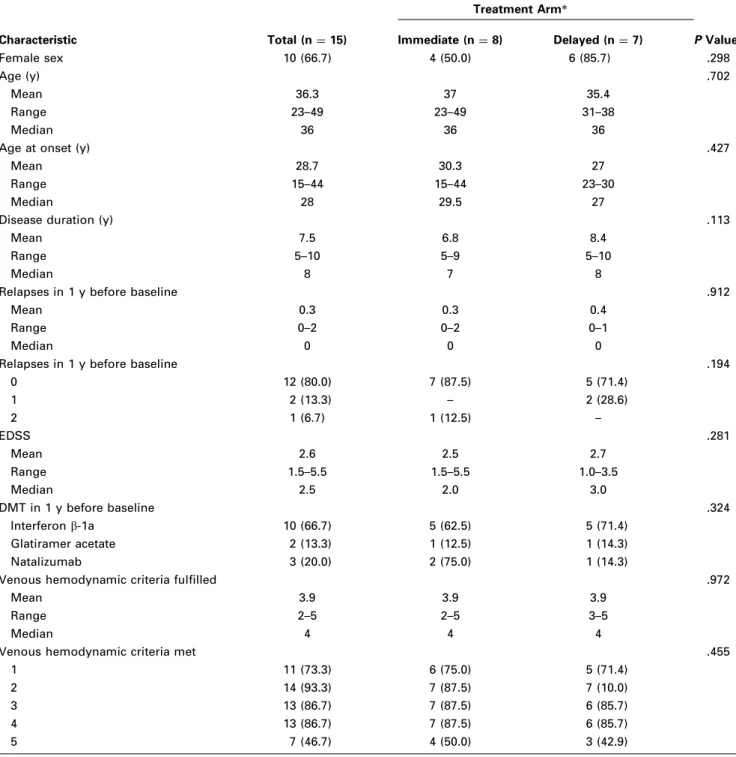
Table 1. Baseline Demographic and Clinical and Venous Abnormality Characteristics in Patients with Multiple Sclerosis
Characteristic Total (n¼15) Treatment Arm* PValue† Immediate (n¼8) Delayed (n¼7) Female sex 10 (66.7) 4 (50.0) 6 (85.7) .298 Age (y) .702 Mean 36.3 37 35.4 Range 23–49 23–49 31–38 Median 36 36 36
Age at onset (y) .427
Mean 28.7 30.3 27
Range 15–44 15–44 23–30
Median 28 29.5 27
Disease duration (y) .113
Mean 7.5 6.8 8.4
Range 5–10 5–9 5–10
Median 8 7 8
Relapses in 1 y before baseline .912
Mean 0.3 0.3 0.4
Range 0–2 0–2 0–1
Median 0 0 0
Relapses in 1 y before baseline .194
0 12 (80.0) 7 (87.5) 5 (71.4) 1 2 (13.3) – 2 (28.6) 2 1 (6.7) 1 (12.5) – EDSS .281 Mean 2.6 2.5 2.7 Range 1.5–5.5 1.5–5.5 1.0–3.5 Median 2.5 2.0 3.0 DMT in 1 y before baseline .324 Interferonb-1a 10 (66.7) 5 (62.5) 5 (71.4) Glatiramer acetate 2 (13.3) 1 (12.5) 1 (14.3) Natalizumab 3 (20.0) 2 (75.0) 1 (14.3)
Venous hemodynamic criteria fulfilled .972
Mean 3.9 3.9 3.9
Range 2–5 2–5 3–5
Median 4 4 4
Venous hemodynamic criteria met .455
1 11 (73.3) 6 (75.0) 5 (71.4)
2 14 (93.3) 7 (87.5) 7 (10.0)
3 13 (86.7) 7 (87.5) 6 (85.7)
4 13 (86.7) 7 (87.5) 6 (85.7)
5 7 (46.7) 4 (50.0) 3 (42.9)
Values in parentheses are percentages.
DMT¼disease-modifying therapy, EDSS¼Expanded Disability Status Scale.
*The immediate treatment arm underwent percutaneous transluminal angioplasty at baseline and was followed for 12 months, whereas the delayed treatment arm underwent percutaneous transluminal angioplasty after 6 months of follow-up and the patients were followed for an additional 6 months.
†
CSF Flow Characteristics at Follow-up
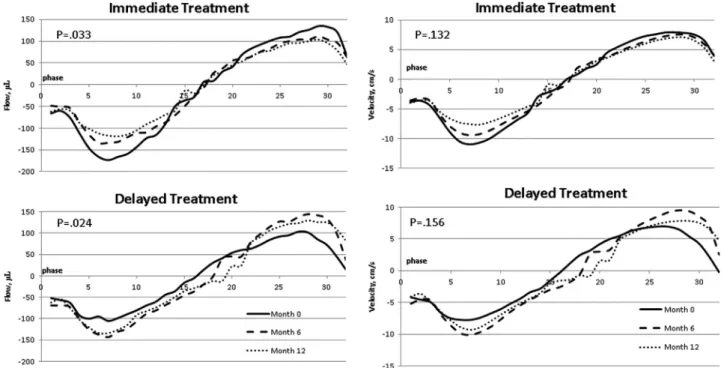
Figures 1 and 2show the results of the mixed-effect model
analyses of CSF flow and velocity characteristics in the immediate and delayed treatment groups over the 12-month follow-up. The data are presented within (Fig 1) and between (Fig 2) treatment groups at 0, 6, and 12 months of the study. There was a significant increase in CSF flow (P¼.033) but not CSF velocity (P¼.132) over the 6- and 12-month follow-up in the immediate treatment arm (Fig 1). There was a significant decrease in CSF flow in the delayed treatment arm in the first 6 months (P ¼ .012) that remained significant at 12 months (P ¼ .024), but none in CSF velocity (P¼.156).
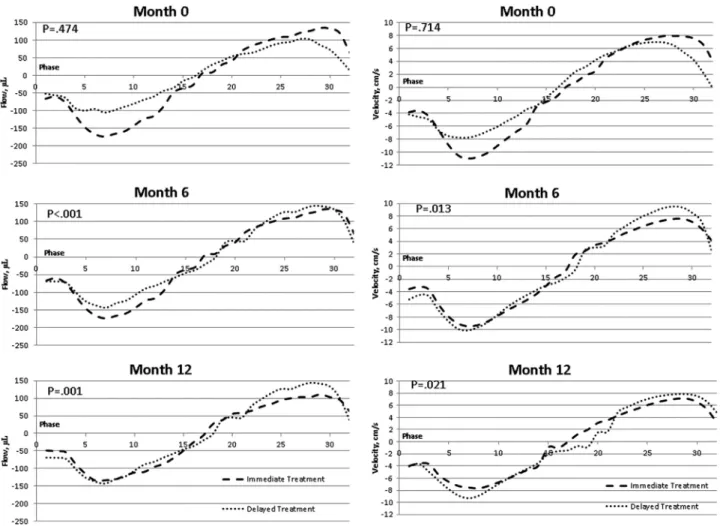
When CSF flow (P ¼ .474) and velocity (P ¼ .714) data between the two treatment arms were compared at baseline, there was no significant difference (Fig 2), confirming the CSF net and peak, positive and negative, or flow and velocity analyses (Table 2). However, at 6
months, the immediate treatment group showed
significant increase in CSF flow (Po.001) and decrease in velocity (P¼.013) measures compared with the delayed treatment arm. This difference was maintained at 12 months, with the immediate treatment group having
significantly increased CSF flow (P ¼ .001) and
decreased velocity (P ¼ .021) measures compared with the delayed arm.
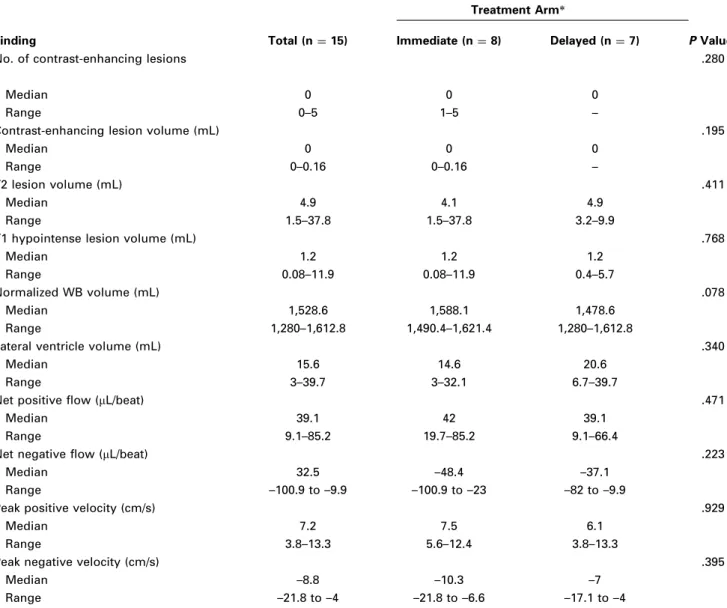
Table 2. Baseline MR Imaging Lesion, Brain Volume, and Cerebrospinal Fluid Characteristics in Patients with Multiple Sclerosis
Finding Total (n¼15)
Treatment Arm*
Immediate (n¼8) Delayed (n¼7) PValue†
No. of contrast-enhancing lesions .280
Median 0 0 0
Range 0–5 1–5 –
Contrast-enhancing lesion volume (mL) .195
Median 0 0 0
Range 0–0.16 0–0.16 –
T2 lesion volume (mL) .411
Median 4.9 4.1 4.9
Range 1.5–37.8 1.5–37.8 3.2–9.9
T1 hypointense lesion volume (mL) .768
Median 1.2 1.2 1.2
Range 0.08–11.9 0.08–11.9 0.4–5.7
Normalized WB volume (mL) .078
Median 1,528.6 1,588.1 1,478.6
Range 1,280–1,612.8 1,490.4–1,621.4 1,280–1,612.8
Lateral ventricle volume (mL) .340
Median 15.6 14.6 20.6
Range 3–39.7 3–32.1 6.7–39.7
Net positive flow (mL/beat) .471
Median 39.1 42 39.1
Range 9.1–85.2 19.7–85.2 9.1–66.4
Net negative flow (mL/beat) .223
Median 32.5 –48.4 –37.1
Range –100.9 to –9.9 –100.9 to –23 –82 to –9.9
Peak positive velocity (cm/s) .929
Median 7.2 7.5 6.1
Range 3.8–13.3 5.6–12.4 3.8–13.3
Peak negative velocity (cm/s) .395
Median –8.8 –10.3 –7
Range –21.8 to –4 –21.8 to –6.6 –17.1 to –4
WB¼whole brain.
*The immediate treatment arm underwent percutaneous transluminal angioplasty at baseline and was followed for 12 months, whereas the delayed treatment arm underwent percutaneous transluminal angioplasty after 6 months of follow-up and the patients were followed for an additional 6 months.
†
Relationship between CSF Flow and
Velocity Measures and Clinical and MR
Imaging Outcomes
Table 3 presents Spearman rank correlation analysis of
CSF flow and velocity measures and clinical and MR imaging outcomes in the immediate and delayed treatment groups over the 12 months of the study. In the delayed but not the immediate treatment arm, decreased CSF net negative flow (P ¼ .04) and increased velocity (P ¼
.039) measures were significantly related with a greater number of relapses during the follow-up. Decreased CSF net flow (P ¼ .005) and increased velocity measures (Po.04) were significantly related to greater changes in T2 lesion volume, whereas decreased CSF net flow (P ¼
.006) and increased velocity measures (Po.007) were also significantly related to change in WB volume in the delayed but not the immediate treatment arm.
DISCUSSION
To our knowledge, this is the first case-control study to investigate the effect of extracranial PTA for CCSVI on CSF flow dynamic changes in the brain. The results of the study showed that treatment with PTA changed CSF flow and velocity measures at 6 months in the immediate versus the delayed treatment MS group, and that treatment effect
persisted between the two treatments arms for the 12 months of the study.
The EVT-MS study (20) and other recent open-label studies confirmed that use of PTA for treatment of extracranial venous abnormalities is relatively safe and well tolerated (16–18,28). In addition, primary and secon-dary endpoints of the EVT-MS study showed that treat-ment of CCSVI was related to partial improvetreat-ment in the clinical and MR imaging outcomes of patients with MS (20). In particular, there were five relapses during the study: one in the immediate group and four in the delayed group. There were no significant changes in Expanded Disability Status Scale score over the period of 12 months between the two treatment groups. Regarding MR outcomes, there was a trend for lower accumulation of T2 lesion volume in the immediate versus the delayed group over 0–6 months. Although no clinical recommen-dations regarding PTA in patients with MS presenting with CCSVI could have been done based on the results of the EVT-MS study (20), the present study provides additional evidence that PTA treatment for CCSVI may play a role in the changing CSF flow dynamics of the brain parenchyma. Intracranial CSF flow dynamics, as measured by cine phase contrast CSF flow imaging, was investigated in recent studies of patients with MS (21,25,29,30). One study showed significantly lower net CSF flow in 16 patients with RR MS compared with eight age- and Figure 1. Data for each of the 32 phases for the entire cardiac cycle between different time points of the study. The figure shows within-group changes in CSF flow and velocity characteristics in the aqueduct of Sylvius in the immediate and delayed treatment arms in patients with MS over a period of 12 months. Systole is represented by the positive portion of the sinusoid, whereas diastole is represented by the negative portion. The integral (area under the curve) of the flow diagram above 0 represents the net positive flow or velocity, and the integral below 0 represents the net negative flow or velocity. The analysis was performed by using a mixed-effect model in which each phase of the cycle at every time point was taken into account. There was a significant increase in CSF flow (top left) but not CSF velocity (top right) over the 6- and 12-month follow-up in the immediate treatment arm. There was a significant decrease in CSF flow in the delayed treatment arm in the first 6 months that remained significant at 12 months (bottom left), but none in CSF velocity (bottom right).
sex-matched healthy control subjects (21), whereas another study (29) found no difference in CSF flow between 21 patients with RR MS and 20 healthy control subjects. Yet another study (30) enrolled 40 patients with MS and 40 healthy control subjects and detected significantly altered CSF flow volume characteristics in patients with MS compared with control subjects. The largest study to date (25) included 67 patients with MS with different disease courses, nine patients with clinically isolated syndrome, and 35 healthy control subjects. The results of that study showed that CSF flow dynamics are altered in patients with MS and that more severe clinical and MR imaging outcomes in RR MS and clinically isolated syndrome relate to altered CSF flow and velocity measures (25).
Numerous studies have shown that increased pressure in the SSS can inhibit the absorption of CSF through the arachnoid villi (31–33), leading to increased intracranial pressure (34,35). A recent study (36) showed no increased
venous pressure in the brain parenchyma in patients with MS. Given that, normally, a pressure gradient of 0–3 mm Hg exists between the SSS and the IJVs (37), any occlusion of the extracranial venous pathways, such as the one reported in subjects with CCSVI (1,2), is likely to induce hypertension in the venous sinuses, especially in the upright posture. There-fore, PTA of the IJVs could decrease the pressure gradient in the SSS and explain the observed changes in the present study in CSF measures in the immediate treatment arm at 6 and 12 months as well as in the delayed treatment arm at 12 months. In addition, it has been shown that stenoses of the venous drainage pathways result in increased resistance to CSF drainage and reduced CSF flow (33), which is consistent with results of previous CSF flow studies in MS (21,25,30). However, the results of the present study extend these findings by showing that reopening of the extracranial venous pathways at the periphery could affect CSF flow dynamics in the brain parenchyma.
Figure 2. Data for each of the 32 phases for the entire cardiac cycle between different time points of the study. The figure shows between-group changes in CSF flow and velocity characteristics in the aqueduct of Sylvius of the immediate and delayed treatment arms in patients with MS over a period of 12 months. Systole is represented by the positive portion of the sinusoid, whereas diastole is represented by the negative portion. The integral (area under the curve) of the flow diagram above 0 represents the net positive flow or velocity, and the integral below 0 represents the net negative flow or velocity. The analysis was performed by using a mixed-effect model in which each phase of the cycle at a given time point was taken into account. At baseline, there was no significant difference between the treatment arms (top left and right); however, at 6 months, the immediate treatment group showed significant increase in CSF flow (middle left) and decrease in velocity (middle right) measures compared with the delayed treatment arm. This difference was maintained at 12 months, with the immediate treatment group having significantly increased CSF flow (bottom left) and decreased velocity (bottom right) measures compared with the delayed treatment arm.
The present CSF flow findings shed new light on understanding of brain volume changes findings in the original EVT-MS study (20), showing that a greater decrease in WB volume over the first 6 months (1.27%) in the immediate compared with the delayed treatment arm (0.57%) was probably related to changes in CSF flow because of improved venous drainage following PTA or reduction of edema. In fact, following PTA, the delayed treatment arm also showed a greater decrease in WB volume in months 6–12 of the study compared with the immediate treatment arm (20).
In patients with MS, cerebral blood flow is reduced and the mean transit time is increased, suggesting significant abnormalities at the microcirculatory level (38). It has been previously shown that there is a relationship between the presence and severity of extracranial hemodynamic abnormalities in MS and perfusion within the brain parenchyma (14,39). This relationship suggests a possible link between extracranial venous outflow obstruction and cerebral microcirculatory changes independent of MS dis-ease status (14). In fact, in a recent study (14), individuals with CCSVI showed decreased cerebral blood flow and cerebral blood volume compared with individuals without CCSVI. Further studies should demonstrate whether these changes have an impact on cerebral perfusion.
The fluid volume in the intracranial space is regulated by a complex windkessel mechanism that couples the cerebral arterial and venous blood flow with the CSF pulse (40). This mechanism is delicately balanced and relies on interactions between compliant vessels. Although this mechanism is not fully understood, it is likely that
hypertension arising from CCSVI might change the compliance of the sinuses and cerebral veins, thereby altering the dynamics of the CSF pulse. How this affects cerebral blood flow is not known, but it may be that altered CSF dynamics arising from CCSVI is capable of inhibiting cerebral blood flow. If this is the case, it would help explain the finding observed by many researchers that individuals with MS tend to exhibit reduced cerebral blood flow (38,41,42).
The present study showed that, in the delayed treatment arm, patients who did not exhibit a change in CSF flow outcomes showed a greater number of relapses and accumulation of T2 lesion and WB volume. This is indeed an interesting finding, as most of the relapses that occurred during the study were in the delayed treatment arm (20). Patients in the delayed treatment arm also showed greater T2 lesion volume increase and WB decrease compared with the immediate arm. It could be hypothesized that delay of treatment for 6 months in the delayed versus the immediate treatment group could have contributed to these findings; however, only head-to-head placebo-controlled studies including patients with different degrees of CCSVI severity will be able to answer this important question.
The EVT-MS study had important design limits that did not allow a firm establishment of the value of PTA for treatment of patients with MS who present with CCSVI (20). The sample size of the EVT-MS study was small, and the study was not double-blinded or placebo-controlled (20). The feasibility of our results requires validation in larger cohort studies and over longer periods of time. However, our results may serve as pilot data in designing
Table 3. Relationship between CSF Flow and Velocity Measures and Clinical and MR Outcomes in Immediate and Delayed Treatment Groups over 12 Months of the Study
Outcome
Net Negative Flow Net Positive Flow Peak Negative Velocity Peak Positive Velocity r PValue r PValue r PValue r PValue
Immediate treatment arm (n¼8)
No. of relapses –0.25 .555 0.25 .555 –0.08 .846 0.28 .621 Percentage change T2 lesion volume –0.20 .704 0.14 .787 –0.03 .957 0.47 .329 T1 lesion volume –0.03 .957 0.04 .945 –0.09 .872 0.03 .966 CE lesion volume –0.13 .805 –0.14 .875 –0.14 .866 0.12 .845 WB –0.05 .911 0.26 .531 –0.05 .911 0.36 .385
Lateral ventricle volume –0.02 .978 0.22 .610 –0.26 .531 0.27 .533 Delayed treatment arm (n¼6)
No. of relapses –0.83 .04* 0.68 .138 –0.84 .039* 0.67 .140 Percentage change T2 lesion volume –0.94 .005* 0.82 .042* –0.92 .005* 0.84 .04* T1 lesion volume –0.32 .544 0.37 .468 –0.31 .535 0.38 .584 CE lesion volume –0.13 .805 –0.14 .875 –0.14 .866 0.12 .845 WB –0.91 .006* 0.92 .005* –0.89 .007* 0.92 .005*
Lateral ventricle volume –0.60 .208 0.37 .468 –0.59 .191 0.33 .511 CSF flow values are in the direction toward the fourth ventricle. Spearman rank correlation was used to determine the relationship between CSF measures and clinical and MR imaging outcomes.
CE¼contrast-enhancing, CSF¼cerebrospinal fluid, WB¼whole brain.
future studies that will investigate the effect of PTA for CCSVI on fluid dynamic changes of the brain parenchyma. In conclusion, PTA in patients with MS with CCSVI increased CSF flow and decreased CSF velocity, which are indicative of improved venous parenchyma drainage. The study sheds new light on CSF flow dynamic changes in the brain parenchyma following PTA for extracranial venous abnormalities related to CCSVI. Future studies should explore the impact of PTA on cerebral fluid dynamics in CCSVI-positive subjects.
REFERENCES
1. Zamboni P, Galeotti R, Menegatti E, et al. A prospective open-label study of endovascular treatment of chronic cerebrospinal venous insuffi-ciency. J Vasc Surg 2009; 50:1348–1358.
2. Zamboni P, Galeotti R, Menegatti E, et al. Chronic cerebrospinal venous insufficiency in patients with multiple sclerosis. J Neurol Neurosurg Psychiatry 2009; 80:392–399.
3. Zivadinov R, Galeotti R, Hojnacki D, et al. Value of MR venography for detection of internal jugular vein anomalies in multiple sclerosis: a pilot longitudinal study. AJNR Am J Neuroradiol 2011; 32:938–946. 4. Simka M, Ludyga T, Latacz P, Kazibudzki M. Diagnostic accuracy of
current sonographic criteria for the detection of outflow abnormalities in the internal jugular veins. Phlebology 2012, 10.1258/phleb.2012.011125. 5. Zivadinov R, Marr K, Cutter G, et al. Prevalence, sensitivity, and specificity of chronic cerebrospinal venous insufficiency in MS. Neurol-ogy 2011; 77:138–144.
6. Dolic K, Marr K, Valnarov V, et al. Intra- and extraluminal structural and functional venous anomalies in multiple sclerosis, as evidenced by 2 noninvasive imaging techniques. AJNR Am J Neuroradiol 2012; 33: 16–23.
7. Wattjes MP, van Oosten BW, de Graaf WL, et al. No association of abnormal cranial venous drainage with multiple sclerosis: a magnetic resonance venography and flow-quantification study. J Neurol Neurosurg Psychiatry 2011; 82:429–435.
8. Centonze D, Floris R, Stefanini M, et al. Proposed chronic cerebrospinal venous insufficiency criteria do not predict multiple sclerosis risk or severity. Ann Neurol 2011; 70:51–58.
9. Zivadinov R, Cutter G, Marr K, et al. No association between conven-tional brain mr imaging and chronic cerebrospinal venous insufficiency in multiple sclerosis. AJNR Am J Neuroradiol 2012; 33:1913–1917. 10. Baracchini C, Perini P, Causin F, Calabrese M, Rinaldi F, Gallo P.
Pro-gressive multiple sclerosis is not associated with chronic cerebrospinal venous insufficiency. Neurology 2011; 77:844–850.
11. Doepp F, Wurfel JT, Pfueller CF, et al. Venous drainage in multiple sclerosis: a combined MRI and ultrasound study. Neurology 2011; 77: 1745–1751.
12. Weinstock-Guttman B, Ramanathan M, Marr K, et al. Clinical correlates of chronic cerebrospinal venous insufficiency in multiple sclerosis. BMC Neurol 2012; 12:26.
13. Bastianello S, Romani A, Viselner G, et al. Chronic cerebrospinal venous insufficiency in multiple sclerosis: clinical correlates from a multicentre study. BMC Neurol 2011; 11:132.
14. Garaci FG, Marziali S, Meschini A, et al. Brain hemodynamic changes associated with chronic cerebrospinal venous insufficiency are not specific to multiple sclerosis and do not increase its severity. Radiology 2012; 265:233–239.
15. Salvi F, Bartolomei I, Buccellato E, Galeotti R, Zamboni P. Venous angioplasty in multiple sclerosis: neurological outcome at two years in a cohort of relapsing-remitting patients. Funct Neurol 2012; 27:55–59. 16. Ludyga T, Kazibudzki M, Simka M, et al. Endovascular treatment for
chronic cerebrospinal venous insufficiency: is the procedure safe? Phlebology 2010; 25:286–295
17. Mandato K, Englander M, Keating L, Vachon J, Siskin GP. Catheter venography and endovascular treatment of chronic cerebrospinal venous insufficiency. Tech Vasc Interv Radiol 2012; 15:121–130.
18. Petrov I, Grozdinski L, Kaninski G, Iliev N, Iloska M, Radev A. Safety profile of endovascular treatment for chronic cerebrospinal venous insufficiency in patients with multiple sclerosis. J Endovasc Ther 2011; 18:314–323.
19. Dake MD, Zivadinov R, Haacke EM. Chronic cerebrospinal venous insufficiency in multiple sclerosis: a historical perspective. Funct Neurol 2011; 26:181–195.
20. Zamboni P, Galeotti R, Weinstock-Guttman B, Kennedy C, Salvi F, Zivadinov R. Venous angioplasty in patients with multiple sclerosis: results of a pilot study. Eur J Vasc Endovasc Surg 2012; 43:116–122. 21. Zamboni P, Menegatti E, Weinstock-Guttman B, et al. The severity of
chronic cerebrospinal venous insufficiency in patients with multiple sclerosis is related to altered cerebrospinal fluid dynamics. Funct Neurol 2009; 24:133–138.
22. Polman CH, Reingold SC, Edan G, et al. Diagnostic criteria for multiple sclerosis: 2005 revisions to the ‘‘McDonald criteria.’’ Ann Neurol 2005; 58:840–846.
23. Lublin FD, Reingold SC. Defining the clinical course of multiple sclerosis: results of an international survey. National Multiple Sclerosis Society (USA) Advisory Committee on Clinical Trials of New Agents in Multiple Sclerosis. Neurology 1996; 46:907–911.
24. Kurtzke JF. Rating neurologic impairment in multiple sclerosis: an Expanded Disability Status Scale (EDSS). Neurology 1983; 33: 1444–1452.
25. Magnano C, Schirda C, Weinstock-Guttman B, et al. Cine cerebrospinal fluid imaging in multiple sclerosis. J Magn Reson Imaging 2012; 36: 825–834.
26. Zivadinov R, Heininen-Brown M, Schirda CV, et al. Abnormal subcort-ical deep-gray matter susceptibility-weighted imaging filtered phase measurements in patients with multiple sclerosis: a case-control study. Neuroimage 2012; 59:331–339.
27. Zivadinov R, Rudick RA, De Masi R, et al. Effects of IV methylpredni-solone on brain atrophy in relapsing-remitting MS. Neurology 2001; 57: 1239–1247.
28. Dake MD. Chronic cerebrospinal venous insufficiency and multiple sclerosis: history and background. Tech Vasc Interv Radiol 2012; 15: 94–100.
29. Sundstrom P, Wahlin A, Ambarki K, Birgander R, Eklund A, Malm J. Venous and cerebrospinal fluid flow in multiple sclerosis: a case-control study. Ann Neurol 2010; 68:255–259.
30. Gorucu Y, Albayram S, Balci B, et al. Cerebrospinal fluid flow dynamics in patients with multiple sclerosis: a phase contrast magnetic resonance study. Funct Neurol 2011; 26:215–222.
31. Cutler R, Page L, Galicich J, Watters G. Formation and absorption of cerebrospinal fluid in man. Brain 1968; 91:707–720.
32. Lorenzo A, Page L, Watters G. Relationship between cerebrospinal fluid formation, absorption and pressure in human hydrocephalus. Brain 1970; 93:679–692.
33. Martins A. Resistance to drainage of cerebrospinal fluid: clinical measurement and significance. J Neurol Neurosurg Psychiatry 1973; 36: 313–318.
34. Raisis J, Kindt G, McGillicuddy J, Giannotta S. The effects of primary elevation of cerebral venous pressure on cerebral hemodynamics and intracranial pressure. J Surg Res 1979; 26:101–107.
35. Turan T, Biousse V, Newman N. Posttraumatic cerebrospinal fluid hypertension and hypotension. Arch Neurol 2004; 61:1124–1125. 36. Meyer-Schwickerath R, Haug C, Hacker A, et al. Intracranial venous
pressure is normal in patients with multiple sclerosis. Mult Scler 2011; 17:637–638.
37. King J, Mitchell P, Thomson K, Tress B. Cerebral venography and manometry in idiopathic intracranial hypertension. Neurology 1995; 45: 2224–2228.
38. Wuerfel J, Paul F, Zipp F. Cerebral blood perfusion changes in multiple sclerosis. J Neurol Sci 2007; 259:16–20.
39. Zamboni P, Menegatti E, Weinstock-Guttman B, et al. Hypoperfusion of brain parenchyma is associated with the severity of chronic cerebro-spinal venous insufficiency in patients with multiple sclerosis: a cross-sectional preliminary report. BMC Med 2011; 9:22.
40. Bateman G, Levi C, Schofield P, Wang Y, Lovett E. The venous manifestations of pulse wave encephalopathy: windkessel dysfunction in normal aging and senile dementia. Neuroradiology 2008; 50:491–497. 41. Law M, Saindane AM, Ge Y, et al. Microvascular abnormality in relapsing-remitting multiple sclerosis: perfusion MR imaging findings in normal-appearing white matter. Radiology 2004; 231:645–652. 42. Varga AW, Johnson G, Babb JS, Herbert J, Grossman RI, Inglese
M. White matter hemodynamic abnormalities precede sub-cortical gray matter changes in multiple sclerosis. J Neurol Sci 2009; 282:28–33.