UNF Digital Commons
UNF Graduate Theses and Dissertations Student Scholarship
2017
Empirical Evaluation of Cloud IAAS Platforms
using System-level Benchmarks
Niharika Deval
This Master's Thesis is brought to you for free and open access by the Student Scholarship at UNF Digital Commons. It has been accepted for
Suggested Citation
Deval, Niharika, "Empirical Evaluation of Cloud IAAS Platforms using System-level Benchmarks" (2017).UNF Graduate Theses and Dissertations. 765.
EMPIRICAL EVALUATION OF CLOUD IAAS PLATFORMS USING SYSTEM-LEVEL BENCHMARKS
by Niharika Deval
A thesis submitted to the School of Computing
in partial fulfillment of the requirements for the degree of
Master of Science in Computer and Information Sciences
UNIVERSITY OF NORTH FLORIDA SCHOOL OF COMPUTING
Copyright 2017 by Niharika Deval
All rights reserved. Reproduction in whole or in part in any form requires the prior written permission of Niharika Deval or designated representative.
The thesis "Empirical Evaluation of Cloud IaaS Platforms using System-Level
Benchmarks" submitted by Niharika Deval in partial fulfillment of the requirements for the degree of Master of Science in Computer and Information Sciences has been
Approved by the thesis committee: Date
____________________________________ ________________________ Dr. Sanjay P. Ahuja
Thesis Advisor and Committee Chairperson
____________________________________ ________________________ Dr. Roger Eggen
____________________________________ ________________________ Dr. Asai Asaithambi
Accepted for the School of Computing:
____________________________________ ________________________ Dr. Sherif Elfayoumy
Director of the School
Accepted for the College of Computing, Engineering and Construction:
____________________________________ ________________________ Dr. Mark A. Tumeo
Dean of the College
Accepted for the University:
____________________________________ ________________________ Dr. John Kantner
ACKNOWLEDGEMENT
I wish to thank my parents, Gopal Rao Deval and Jyothi Deval, and my brother, Navin Kumar Deval, for their unwavering support and concern during the many hours I dedicated to accomplishing this milestone in my life and career. I highly appreciate the understanding and patience of my family while I achieved one of the greatest moments of my life. I also wish to extend my gratitude to my friend Rajendra Prasad Arukala for sharing his knowledge and encouraging me throughout this period.
I thank my thesis advisor Dr. Sanjay P. Ahuja for his expert advice, feedback, and suggestions. I also thank Dr. Roger Eggen and Dr. Asai Asaithambi who agreed to be on my thesis committee and provided great feedback in this research process. Working with these three distinguished UNF faculty members has been an honor and a privilege.
CONTENTS
List of Figures ... viii
List of Tables ... ix
Abstract ... xi
Chapter 1: Introduction ... 1
-1.1 Standardization and Transparency ... 2
-1.2 Performance Evaluation and Benchmarking ... 3
-1.3 Cloud Architectures... 5
-1.3.1 Amazon EC2 ... 5
-1.3.2 Google Compute Engine ... 6
-1.3.3 Microsoft Azure ... 7
-1.3.4 Rackspace Cloud Services ... 9
-1.4 Research Objectives ... 10
Chapter 2: Literature Review ... 12
-2.1 Studies on Performance and Performance Variability ... 12
-2.2 Studies on Pricing... 14
Chapter 3: Research Methodology... 16
-3.1 Server Performance ... 16
-3.2 File I/O Performance ... 17
-3.3 Network Performance ... 18
-3.5 Pricing ... 20
Chapter 4: Metrics and Specifications ... 21
-4.1 Metrics ... 21
-4.2 Hardware and Software Specifications ... 23
-4.2.1 Hardware Specifications ... 23
-4.2.2 Software Specifications ... 24
Chapter 5: Test Methodology ... 25
-5.1 Performance Benchmarking and Performance Variability ... 26
-5.1.1 Server Performance ... 26
-5.1.2 File I/O Performance... 28
-5.1.3 Network Performance ... 30
-5.2 PriceperPerformance Analysis ... 31
-5.2.1 PriceperServer Performance ... 31
-5.2.2 PriceperFile I/O Performance... 32
-5.2.3 PriceperNetwork Performance ... 32
Chapter 6: Results and Analysis ... 33
-6.1 Server Performance ... 34
-6.1.1 General Purpose Instances ... 34
-6.1.2 MemoryIntensive Instances ... 38
-6.1.3 ComputeIntensive Instances ... 42
-6.2 File I/O Performance ... 46
-6.2.1 General Purpose Instances ... 46
-6.2.3 ComputeIntensive Instances ... 55
-6.3 Network Performance ... 59
-6.3.1 General Purpose Instances ... 59
-6.3.2 MemoryIntensive Instances ... 62
-6.3.3 ComputeIntensive Instances ... 65
Chapter 7: Conclusions and Future Work ... 69
-7.1 Further Research ... 70
References ... 72
Appendix A: Unixbench Installation and Execution ... 77
Appendix B: Dbench Installation and Execution... 80
Appendix C: Iperf Installation and Execution ... 83
Appendix D: Statistical Analysis ... 86
-FIGURES
Figure 1: SingleThreaded Scores on General Purpose Instance ... 35
Figure 2: MultiThreaded Scores on General Purpose Instance ... 35
Figure 3: SingleThreaded Scores on MemoryIntensive Instance ... 39
Figure 4: MultiThreaded Scores on MemoryIntensive Instance ... 39
Figure 5: SingleThreaded Scores on ComputeIntensive Instance ... 43
Figure 6: MultiThreaded Scores on ComputeIntensive Instance ... 43
Figure 7: Standard File I/O Throughput on General Purpose Instance ... 47
Figure 8: File I/O Overhead Throughput on General Purpose Instance ... 47
Figure 9: Standard File I/O Throughput on MemoryIntensive Instance ... 51
Figure 10: File I/O Overhead Throughput on MemoryIntensive Instance ... 52
Figure 11: Standard File I/O Throughput on ComputeIntensive Instance ... 56
Figure 12: File I/O Overhead Throughput on ComputeIntensive Instance ... 56
Figure 13: Network Throughput on General Purpose Instance ... 60
Figure 14: Network Throughput on MemoryIntensive Instance ... 63
-TABLES
Table 1: Description of Amazon EC2 Instance Types ... 6
Table 2: Description of Google Compute Engine Machine Types ... 7
Table 3: Description of Microsoft Azure Virtual Machines ... 9
Table 4: Description of Rackspace Cloud Servers ... 10
Table 5: General Purpose Instances across Cloud Providers ... 23
Table 6: MemoryIntensive Instances across Cloud Providers ... 24
Table 7: ComputeIntensive Instances across Cloud Providers ... 24
Table 8: Single and MultiThreaded Scores on General Purpose Instance ... 35
Table 9: SingleThreaded Scores with CoV on General Purpose Instance ... 37
Table 10: MultiThreaded Scores with CoV on General Purpose Instance ... 37
Table 11: PriceperServer Performance on General Purpose Instance... 38
Table 12: Single and MultiThreaded Scores on MemoryIntensive Instance ... 38
Table 13: SingleThreaded Scores with CoV on MemoryIntensive Instance ... 41
Table 14: MultiThreaded Scores with CoV on MemoryIntensive Instance... 41
Table 15: PriceperServer Performance on MemoryIntensive Instance ... 42
Table 16: Single and MultiThreaded Scores on ComputeIntensive Instance ... 42
Table 17: SingleThreaded Scores with CoV on ComputeIntensive Instance ... 45
Table 18: MultiThreaded Scores with CoV on ComputeIntensive Instance ... 45
Table 19: PriceperServer Performance on ComputeIntensive Instance ... 46
Table 21: Standard File I/O Throughput with CoV on General Purpose Instance ... 49
Table 22: File I/O Overhead Throughput with CoV on General Purpose Instance ... 50
Table 23: PriceperFile I/O Performance on General Purpose Instance ... 50
Table 24: File I/O (STD and OHD) Throughput on MemoryIntensive Instance ... 51
Table 25: Standard File I/O Throughput with CoV on MemoryIntensive Instance .... 53
Table 26: File I/O Overhead Throughput with CoV on MemoryIntensive Instance ... 54
Table 27: PriceperFile I/O Performance on MemoryIntensive Instance ... 54
Table 28: File I/O (STD and OHD) Throughput on ComputeIntensive Instance ... 55
Table 29: Standard File I/O Throughput with CoV on ComputeIntensive Instance ... 58
Table 30: File I/O Overhead Throughput with CoV on ComputeIntensive Instance .. 58
Table 31: PriceperFile I/O Performance on ComputeIntensive Instance ... 59
Table 32: Network Throughput on General Purpose Instance ... 59
Table 33: Network Throughput with CoV on General Purpose Instance ... 61
Table 34: PriceperNetwork Performance on General Purpose Instance ... 62
Table 35: Network Throughput on MemoryIntensive Instance ... 62
Table 36: Network Throughput with CoV on MemoryIntensive Instance ... 64
Table 37: PriceperNetwork Performance on MemoryIntensive Instance ... 65
Table 38: Network Throughput on ComputeIntensive Instance ... 65
Table 39: Network Throughput with CoV on ComputeIntensive Instance ... 67
-ABSTRACT
Cloud Computing is an emerging paradigm in the field of computing where scalable IT enabled capabilities are delivered ‘as-a-service’ using Internet technology. The Cloud industry adopted three basic types of computing service models based on software level abstraction: Infrastructure-as-a-Service (IaaS), Platform-as-a-Service (PaaS), and
Software-as-a-Service (SaaS). Infrastructure-as-a-Service allows customers to outsource fundamental computing resources such as servers, networking, storage, as well as services where the provider owns and manages the entire infrastructure. This allows customers to only pay for the resources they consume. In a fast-growing IaaS market with multiple cloud platforms offering IaaS services, the user's decision on the selection of the best IaaS platform is quite challenging. Therefore, it is very important for organizations to evaluate and compare the performance of different IaaS cloud platforms in order to minimize cost and maximize performance.
Using a vendor-neutral approach, this research focused on four of the top IaaS cloud platforms- Amazon EC2, Microsoft Azure, Google Compute Engine, and Rackspace cloud services. This research compared the performance of IaaS cloud platforms using system-level parameters including server, file I/O, and network. System-level
benchmarking provides an objective comparison of the IaaS cloud platforms from
chosen to test the performance of the server, file I/O, and network respectively. In order to capture the performance variability, the benchmark tests were performed at different time periods on weekdays and weekends. Each IaaS platform's performance was also tested using various parameters. The benchmark tests conducted on different virtual machine (VM) configurations should help cloud users select the best IaaS platform for their needs. Also, based on their applications' requirements, cloud users should get a clearer picture of which VM configuration they should choose. In addition to the
performance evaluation, the price-per-performance value of all the IaaS cloud platforms was also examined.
Chapter 1 INTRODUCTION
Cloud computing enables on-demand network access to the collective pool of
configurable physical resources such as servers, storage, and networks. These resources can then be easily managed and accessed at a minimal cost [Mell11]. Moreover, resource availability and the economic advantages of cloud computing have changed the way IT services are implemented and delivered to users and organizations [Rossa14]. Cloud computing is based on a two-tier technology: deployment models and delivery services. The three basic cloud deployment models are private cloud, public cloud, and hybrid cloud. Cloud delivery services are primarily classified as Infrastructure-as-a-Service (IaaS), Platform-as-a-Service (PaaS), and Software-as-a-Service (SaaS) [Shawish14].
IaaS, the lowest tier in the service model stack, provides a standard virtualized operating environment to its users [Tata11]. In the IaaS model, the cloud providers own and manage the physical resources such as servers, storage, networking, and virtualization. The IaaS users rent the computing resources from the cloud providers and are responsible for managing applications, data, run time, middleware, and operating systems on self-service virtual machines. IaaS cloud self-services can be offered as public IaaS cloud, private IaaS cloud, and hybrid IaaS cloud [Tata11]. The public IaaS model has the potential advantages of rapid implementation, massive scalability, and consistent availability of
resources that are billed on a usage basis [Combs12]. Small and medium-size businesses (SMBs) and startup companies benefit from IaaS cloud adoption due to their business agility and low infrastructure costs [Posey15]. This study focuses on system-level evaluation of public IaaS cloud platforms' offerings.
1.1 Standardization and Transparency
Organizations need to comprehensively assess the technical and business requirements of an application before deploying it to the cloud environment [CloudSpectator15]. Once the technical and business requirements are assessed, the next step is to choose the right IaaS platform. [Lavnevich16].
The decision regarding the selection of an IaaS platform is crucial to an organization's success, as the efficiency and productivity of the deployed application depends on the cloud provider's capabilities [CloudSpectator15]. With the substantial increase in the number of public IaaS cloud platforms over the past decade, the selection of an
appropriate IaaS platform could take great deal of time and effort. Moreover, IaaS cloud platforms have diverse service portfolios and pricing structures [Profitbricks13]. In addition, there are no uniform cloud management standards across the different IaaS cloud platforms. The lack of standardization in the IaaS industry results in the
degradation of quality of services, compliance issues, service outages, interoperability issues, hidden costs, and performance bottlenecks [Ortiz11].
In the IaaS market, uncertainty with existing IaaS cloud platforms, as well as the rapid emergence of new IaaS cloud platforms into the market, leads to intense competition [CloudSpectator15]. To withstand the competition and prevent users from migrating to other IaaS cloud platforms, the chosen IaaS platform will often hide certain details from their users [Lavnevich16]. This lack of transparency is another major setback in the IaaS industry [Pwc11]. An unknown underlying infrastructure, different pricing structures, and organizational challenges are factors that make it difficult to select the right IaaS
platform. An inappropriate selection of an IaaS cloud platform could lead to potential application performance issues and unnecessary IT costs [Tata11]. This study follows a data-driven approach from both the performance and price standpoints to achieve a standardized comparison of IaaS services.
1.2 Performance Evaluation and Benchmarking
Most of the cloud deployment decisions are based on factors such as Service Level Agreements (SLAs), datacenter location, and security, which can affect the efficiency of an application [Perry10]. However, performance is another key determinant factor in the cloud deployment decision since it significantly impacts the annual operational costs and quality of services which is sometimes overlooked due to its complexity
[CloudSpectator15]. Therefore, the performance capabilities of IaaS cloud platforms must be evaluated and compared using standard measures in order for them to be useful. This can be achieved by benchmarking the performance characteristics of IaaS cloud
platforms at the system-level to establish baseline performance expectations [CloudHarmony14].
Benchmarking provides an objective comparison of cloud performance across different IaaS cloud platforms [Wise11]. Benchmarking allows users to identify the performance capabilities of each IaaS cloud platform, thereby avoiding any impact on the production environment and eliminating the post-deployment rework and unnecessary costs
[CloudSpectator15]. Benchmarking is an unbiased approach that has the potential of bringing IaaS cloud providers and buyers together [Wise11]. IaaS cloud platforms benefit from this approach by identifying their own underperforming services, allowing them to make targeted improvements [Pwc11].
System-level benchmarking is used to evaluate the performance of system parameters that affect the overall application performance [CloudSpectator15]. In a multi-user cloud environment, the system resources are shared, impacting the performance of an
application [Makroo16]. System-level benchmarks provide a standard method of measuring performance via usage of system-level parameters such as CPU, RAM, storage, and I/O. Standard system-level benchmarks- Unixbench [Github17], Dbench [Dbench17], and Iperf [Iperf17] are used to test the performance of server, file I/O, and network, respectively. These system-level benchmarks allow users to tune various
parameters for testing the respective performance metrics under different scenarios. They also give a clear understanding of how the virtual machines running different applications affect the performance in real time [CloudSpectator15].
1.3 Cloud Architectures
The four leading public IaaS cloud platforms- Amazon EC2, Microsoft Azure services, Google Compute Engine, and Rackspace cloud services have been chosen for
comprehensive performance evaluation. The selection of these IaaS cloud platforms is based on their reliability, flexibility, ease of use, as well as their popularity in the cloud market.
1.3.1 Amazon EC2
Amazon Web Service (AWS) is the pioneer in the IaaS cloud market and is known for its agile IaaS product portfolio. Amazon Elastic Compute (EC2) is one of the services offered by AWS. Amazon EC2 enables customers and organizations of all sizes to utilize the services according to their application needs [Azavea14]. Customers are billed for each hour of resource consumption. Amazon Web Services (AWS) uses Xen
virtualization technology [Posey15].
Amazon EC2 instances differ by the amount of computing resources, including
processing power, memory, storage, and network connectivity. Amazon EC2 supports a wide range of operating systems, including Linux and Windows Server [Posey15]. Amazon EC2 distributes the instance families across six categories based on instance configuration [Azavea14]. Table 1 provides the description of instance types offered by Amazon EC2.
Instance Families Description Use cases General purpose These instances have burstable
performance CPUs. Web applications and development environments Compute-optimized These instances are designed to
deliver highest performing processors.
Web servers, batch processing, and compute-intensive HPC applications Memory-optimized These instances are designed to
deliver high memory. Distributed memory caches and analytics, high performance databases Storage-optimized These instances provide fast
SSD-backed instance storage. Hadoop, data warehousing applications, and NoSQL databases
Graphics Processing
Unit (GPU) These instances are designed for graphic-intensive applications. High performance 3D applications and video editing Table 1: Description of Amazon EC2 Instance Types
1.3.2 Google Compute Engine
Google Compute Engine (GCE) is another top IaaS platform in the IaaS market. GCE is the infrastructure component of the Google cloud platform. GCE resources are hosted in data centers located in three regions across the world: US, Europe, and Asia-Pacific [Lavnevich16]. The hypervisor opted by Google is an open source Linux Kernel-based Virtual Machine (KVM). GCE supports multiple Linux OS versions including Debian, CoreOS, CentOS, OpenSUSE Enterprise, Red Hat Enterprise Linux (RHEL), and Ubuntu, as well as Windows Server [Posey15].
GCE charges customers in minute-level increments for pay-as-you-go usage [GCE17A]. Customers are initially charged for ten minutes of usage, followed by one minute
Virtual Private Network (VPN) [Lavnevich16]. GCE allows its users to integrate their applications with other Google services such as Gmail, Search, and Maps.
In addition to the pre-packaged machine types, GCE also offers custom machine types. Custom machine types enable users to select any number of virtual CPUs (vCPUs) and amount of memory for their workloads [GCE17A]. Customized server configuration helps application developers select and pay for the required amount of compute and memory resources instead of paying for underutilized resources [Profitbricks13]. GCE's pre-packaged machine types are categorized into four types that offer different
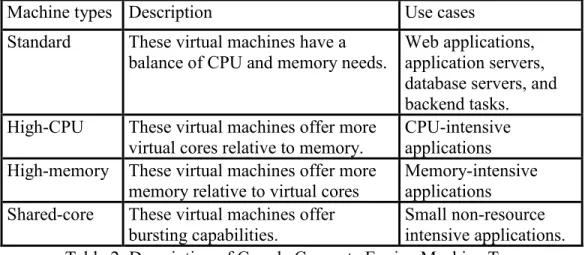
configurations based on compute, memory, and storage [GCE17A]. Table 2 shows the description of pre-packaged machine types offered by Google Compute Engine (GCE).
Machine types Description Use cases
Standard These virtual machines have a
balance of CPU and memory needs. Web applications, application servers, database servers, and backend tasks. High-CPU These virtual machines offer more
virtual cores relative to memory. CPU-intensive applications High-memory These virtual machines offer more
memory relative to virtual cores Memory-intensive applications Shared-core These virtual machines offer
bursting capabilities. Small non-resource intensive applications. Table 2: Description of Google Compute Engine Machine Types 1.3.3 Microsoft Azure
minute of usage basis [Nottingham16]. Microsoft IaaS services are available in multiple datacenters located worldwide including the United States, China, Japan, Singapore, the Netherlands, and Hong Kong [Lavnevich16]. Azure IaaS supports multiple Linux OS versions including Ubuntu Server, CoreOS, OpenSUSE, CentOS, and SLES, Debian, and Red Hat Enterprise Linux, as well as Windows Server [Posey15].
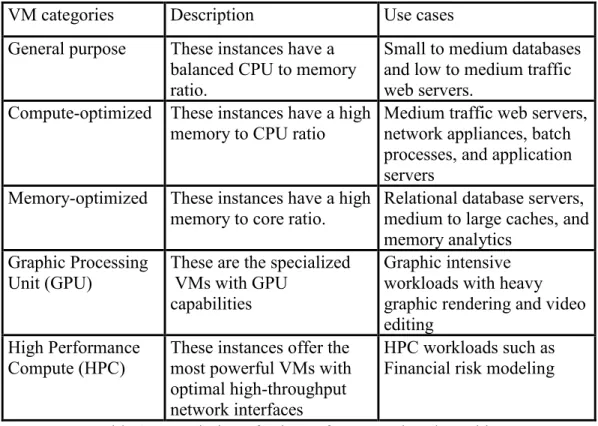
Virtual machines in Azure are categorized into Basic-tier and Standard-tier instances. Basic-tier instances do not require load balancing and auto scaling; however, Standard-tier instances include load balancing and auto scaling at no additional cost [Kwa14]. Standard-tier instances provide an optimal set of compute, memory, and I/O resources [Nottingham16]. Basic-tier is available only for general purpose instances where as Standard-tier is available across memory-intensive, and compute-intensive instances, GPU instances, and HPC instances. Table 3 provides the description of virtual machines offered by Microsoft Azure.
VM categories Description Use cases General purpose These instances have a
balanced CPU to memory ratio.
Small to medium databases and low to medium traffic web servers.
Compute-optimized These instances have a high
memory to CPU ratio Medium traffic web servers, network appliances, batch processes, and application servers
Memory-optimized These instances have a high
memory to core ratio. Relational database servers, medium to large caches, and memory analytics
Graphic Processing
Unit (GPU) These are the specialized VMs with GPU capabilities
Graphic intensive workloads with heavy graphic rendering and video editing
High Performance
Compute (HPC) These instances offer the most powerful VMs with optimal high-throughput network interfaces
HPC workloads such as Financial risk modeling Table 3: Description of Microsoft Azure Virtual Machines
1.3.4 Rackspace Cloud Services
Rackspace OpenStack cloud computing platform is an IaaS platform that has evolved from a managed hosting service and collocation provider [Rackspace16]. The pay-as-you-go pricing model offered by Rackspace services includes a combination of
infrastructure level and service level [Azavea14]. Their IaaS infrastructure is offered with two managed service levels including Managed Infrastructure and Managed Operations. These two service levels help customers easily manage and operate their own
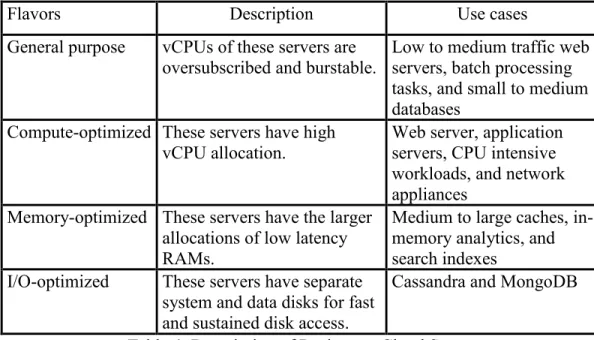
Rackspace has six global data centers located in Chicago, Dallas, Northern Virginia, London, and Hong Kong [Lavnevich16]. Rackspace supports different operating systems which include CentOS, CoreOS, Debian, Fedora, FreeBSD, Gentoo, openSUSE, RHEL, and Ubuntu, as well as Windows Server images - Windows Server 2008 and Windows 2012 [Posey15]. Rackspace servers are categorized as 'Flavors' based on the amount of vCPU, disk I/O, and RAM [Rackspace16]. Table 4 provides the description of flavors offered by Rackspace cloud services.
Flavors Description Use cases
General purpose vCPUs of these servers are
oversubscribed and burstable. Low to medium traffic web servers, batch processing tasks, and small to medium databases
Compute-optimized These servers have high
vCPU allocation. Web server, application servers, CPU intensive workloads, and network appliances
Memory-optimized These servers have the larger allocations of low latency RAMs.
Medium to large caches, in-memory analytics, and search indexes
I/O-optimized These servers have separate system and data disks for fast and sustained disk access.
Cassandra and MongoDB Table 4: Description of Rackspace Cloud Servers
1.4 Research Objectives
This study evaluates and compares the performance and price of the services provided by the four leading IaaS cloud platforms. The metrics used to analyze the performance of IaaS cloud platforms are server performance, file I/O throughput, and network
throughput. System-level benchmarks used are Unixbench, Dbench, and Iperf. The series of benchmark tests are run on three virtual instances categorized as general purpose instance, compute-intensive instance, and memory-intensive instance. The benchmark tests on these three virtual instance categories can help cloud users identify which IaaS cloud platform is the best fit for their application requirements [CloudSpectator15]. The variability in performance of all the IaaS cloud platforms is determined by running the three benchmark tests at peak and non-peak hours on different days. In addition to the performance assessment, the price-per-performance analysis is calculated to determine which IaaS cloud platform delivers the best performance at minimum cost.
Chapter 2
LITERATURE REVIEW
2.1 Studies on Performance and Performance Variability
Leitner and Cito conducted a constructive analysis of performance variability in the services offered by public IaaS cloud platforms [Leitner16]. The detailed hypotheses were formulated on the performance variation and predictability in cloud platforms offering IaaS services. The formulated hypotheses were validated and analyzed by executing the micro and application-level benchmarks on four IaaS cloud platforms: Amazon EC2, Google Compute Engine, Microsoft Azure, and IBM Softlayer. Three micro benchmarks were used to test CPU speed, disk I/O, and memory performance and two application-level benchmarks were run to test OLTP and Java compilation. The benchmark tests were performed on three different VM configurations (micro, small, and medium instance types) launched in different geographical regions. The series of
benchmark tests were executed six times a day over a period of one month to test performance variability.
The results indicated that hardware heterogeneity and multi-tenancy have an impact on performance and performance variability on few IaaS cloud platforms [Leitner16]. The series of benchmark tests indicated that the performance of CPU-bound applications
varies primarily due to hardware heterogeneity whereas the performance of I/O bound applications varies due to noisy neighbor effect. The performance and predictability of a cloud instance depends significantly on time of the day and day of the week as well as selected geographical region.
Schad et al. carried out a study on performance variability of two IaaS cloud platforms- Amazon EC2 and Rackspace cloud services [Schad10]. Ubench benchmark was used to measure CPU and memory speed. Bonnie and Iperf benchmarks were used to test performance of disk I/O and network respectively. Along with these benchmarks,
MapReduce applications were run on the IaaS cloud platforms' infrastructure to test their application performance. Performance variability was analyzed by running benchmark tests on small and large instances over a period of one month, in different availability zones.
The authors concluded from the results that geographical location has an impact on performance variability [Schad10]. The results indicated that CPU, I/O, and network performance of small and large instances were very unpredictable. The reason for such variability was observed due to different system types used by virtual modes i.e. the performance of Xeon-based systems was better when compared to that of Opteron-based systems.
Lenk et al. proposed a new benchmarking method that determines the actual performance of the virtual machines running a specific IaaS service [Lenk11]. The proposed
benchmarking method was tested on different virtual instances of three IaaS cloud platforms: Amazon EC2, Flexiscale, and Rackspace cloud. Benchmarks from the Phoronix test suite were used to build their customized benchmark suite [Lenk11]. The paper concluded that the performance specifications provided by the IaaS cloud platforms were inadequate to predict the actual performance of the deployment. The benchmark suite did not test the network performance. Also, the paper did not consider a
performance-cost analysis when comparing the IaaS cloud platforms.
Major findings of the benchmark results indicated that there is a strong relation between the performance of a VM and its underlying CPU architecture [Lenk11]. The results obtained from benchmark suite showed that data center location, benchmark start and execution times have no strong impact on the performance. Furthermore, the results indicated that time related dimensions do not have major impact on the performance of a VM.
2.2 Studies on Pricing
Kihal et al. address the lack of transparency in the pricing structure of IaaS cloud platforms [Kihal12]. Their research aimed to analyze the pricing structure of IaaS cloud platforms by employing two different price comparison methods. The pricing study evaluated five IaaS cloud platforms - Amazon EC2, IBM Cloud, Microsoft Azure, Terremark IaaS platform, and Google Compute Engine. The first method was "hedonic pricing" which decomposes IaaS prices into characteristics of the goods being sold and
external factors affecting pricing. Another method was "PriCo" which considers the prices of competitive platforms. The two pricing comparison methods could help
customers identify the least expensive provider for their applications and help IaaS cloud platforms self-assess their pricing position in the market.
Hedonic pricing method indicated that Amazon EC2 and Microsoft Azure are more suitable for high computing requirements, whereas Google, IBM, and Terremark are more suitable for lower computing requirements. Prico method indicated that Google is the most suitable platform for applications with low-CPU and high-memory requirements and Terremark is the most favorable provider for applications with high-CPU and low-memory requirements. Both pricing comparison methods indicated that Google is the least expensive provider for most of the computing requirements [Kihal12].
Although numerous studies exist in the literature, none provided a comprehensive evaluation of IaaS cloud platforms from both performance and price standpoints under different scenarios. The existing research provides only low-level performance evaluation of IaaS cloud platforms. Currently, there are no research methodologies available that can provide a clear analysis to identify the best IaaS cloud platform for specific application requirements. In this study, the performance capabilities of IaaS cloud platform were extensively evaluated by performing stress testing on the server, file system, and network to assess how the IaaS cloud platforms perform under unexpected, extreme loads.
Chapter 3
RESEARCH METHODOLOGY
This chapter establishes benchmarking criteria of the server performance, file I/O performance, network performance, and the price-per-performance analysis.
3.1 Server Performance
In cloud environments, every cloud provider has their own way of virtualizing the CPU cores [CloudSpectator15]. The virtual machines (VMs) do not run in isolation
[Azavea14]. Rather, they run on a physical host along with a variety of other virtual machines provisioned to other users. The overall load on the host will affect the performance of any individual VM configured on that host [Azavea14]. The virtual machine that affects the performance of other virtual machines of the same physical host is called a noisy neighbor tenant [Makroo16]. The noisy neighbor tenant monopolizes the host resources, including CPU cores, resulting in performance fluctuations across all the instances of the host [Kajeepeta10].
The performance of a virtual machine depends on many factors such as CPU speed, operating system, processor type, internal memory, and underlying virtualization technology [CloudHarmony14]. There are other factors that affect performance that are
out of user's control, such as state of services, noisy neighbors, and hardware
heterogeneity [Makroo16]. A generalized system benchmarking tool can be leveraged to compare the system performance of identically configured VMs of different vendors. As mentioned earlier, the overall performance of a virtual machine depends on the number of virtual CPU cores, thus it will be useful to accumulate metrics on a per-core basis. That is, the benchmarking tool has to be executed in both single-core and multi-core modes. These tests are useful in determining whether multiple cores are fully utilized while performing certain tasks [Github17].
In multi-tenant environments with sophisticated virtualization techniques for sharing the resources among users, the performance of the server may vary based on availability of CPU resources due to varying loads on the host in a given day [Persico10]. Therefore, the benchmarking exercise needs to be performed at peak hours and non-peak hours of weekdays and weekends.
3.2 File I/O Performance
Cloud platforms offer different cloud storage technologies ranging from traditional hard drives (HDD) to Solid State Drives (SSD), with or without RAID support [Wells15]. Each storage option delivers different levels of performance, redundancy, and availability [Profitbricks13]. The storage performance also depends on whether the storage is
temporary or persistent. As a result, the efficiency or the speed at which the data is transferred internally is a key factor that varies among the platforms [Keating16]. Storage
performance is evaluated by generating customized I/O server workloads to test its efficiency when handling the workload [Dbench17]. The server can be stressed by emulating multiple client processes to determine how well it can handle file requests from concurrent clients. The file I/O capabilities can be further tested by carrying out the tests under systematically defined load conditions to determine how the server performs.
Performance variability also needs to be evaluated since performance may vary at different times due to multi-tenancy [CloudSpectator15]. One or more VMs on the same physical host running heavy application workloads such as I/O-intensive applications may consume most of the disk I/O [Makroo16]. As a result, other VMs residing on the same physical host may suffer from resource contention.
3.3 Network Performance
Networking is a key factor in cloud computing since the LAN capability in the cloud is virtualized. In a cloud environment, the data stored and processed in virtual environments are distributed across multiple physical servers [Moghul12]. The networking capabilities, such as network infrastructure, load balancing technology, as well as network resource allocation strategies, are different among the platforms due to technological differences [Persico15]. Furthermore, many IaaS cloud platforms use 10 Gbps interconnect with maximum throughput limited up to 1 Gbps, based on the size of VM [Liu16]. Also, the IaaS cloud platforms advertise maximum allocated bandwidth for different VM
platform actually delivers the network throughput in comparison with its theoretical/advertised bandwidth.
The network can be stressed by allowing parallel data streams from client to server. Stressing the network allows the user to fully test the network capacity of the provider [Iperf17]. Sometimes, heavy network traffic consumes more CPU time, affecting the network throughput and latency [Mytton14].
The variability in network performance occurs when the majority of available network bandwidth is utilized by other hosts on the same physical infrastructure [Azavea14]. The time of day and day of the week also contribute to the variability in network performance. It is assumed that the network delivers lower throughput during the peak hours, or when backups are running [Cook08]. The variation in network performance causes difficulties for the applications that are performing latency-sensitive tasks [Posey15]. The
applications running on other VMs of the same physical host may cause variation in network performance of a particular VM [Persico15]. Therefore, it is necessary to test the network performance during peak hours and non-peak hours of weekdays and weekends.
3.4 Performance Variability
In a public cloud environment, the performance of an application is not always consistent [Persico15]. A series of factors including workload variability, virtualization overhead, and resource-time sharing can contribute to performance variability [Jackson11].
The variability in performance needs to be determined using the benchmark results of different IaaS cloud platforms obtained across different test sessions. There are certain techniques or measures to emphasize the performance variability of cloud platforms for all the three system-level tests. The common statistical functions that measure the variability in performance are variance, mean, and standard deviation [Schad10]. These statistical functions are used to derive the Coefficient of Variation (CoV). The
Coefficient of Variation can also be used as a simple measure of relative variability of performance [Schad10].
3.5 Pricing
Pricing is an important factor that needs to be considered for IaaS platform selection by business organizations. The value of a IaaS offering is vital for the organizations of any scale when determining the amount of resources needed to deploy an application into a provider's environment [Profitbrick13]. Organizations can achieve better business outcome when an application deployed on the cloud generates higher performance in a cost-effective manner [Perry10]. The combination of price and performance can be used to identify the platform that offers best IaaS services at minimal cost [Profitbricks13].
Chapter 4
METRICS AND SPECIFICATIONS
4.1 Metrics
The following metrics are examined when comparing the IaaS cloud platforms:
1. Unixbench Score: The scores of individual tests - Dhrystone, Whetstone, Execl throughput, File Copy, Pipe throughput, Pipe-based Context Switching, Process Creation, Shell Scripts, System call Overhead, Graphical tests are aggregated to an overall index score for the system [Github17]. A higher score represents better server performance. The following is the brief description of individual tests:
• Dhrystone: Dhrystone test is used to measure the efficiency of string handling functions.
• Whetstone: Whetstone is used to measure the speed and efficiency of integer and floating-point arithmetic operations.
• Execl Throughput: This test is used to measure the number of execl calls that can be performed per second.
• File Copy: File Copy test is used to measure the rate at which the data can be transferred from one file to another, using various buffer sizes.
can write 512 bytes to a pipe and read them back (communication between processes).
• Pipe-based Context Switching: This test is used to measure the rate at which two processes can exchange an increasing integer through a pipe.
• Process Creation: This benchmark test is used to measure the number of times a process can fork another process.
• Shell scripts: This benchmark test is used to measure the rate at which a process can start and reap a set of one, four, and eight concurrent copies of shell scripts.
• System call Overhead: This test is used to measure estimated cost of entering and exiting the operating system kernel.
• Graphical tests: Graphical tests are used to measure the system's 2D and 3D graphics performance.
2. File I/O throughput:This throughput is defined as the rate at which the data is moved to or from storage. File I/O throughput is expressed in Megabytes per second [Dbench17].
3. Internal network throughput: This throughput is the rate at which data are transmitted over the network between the test VMs. Network throughput is measured in bits per second [Iperf17].
4. Price-per-performance value: Price-per-performance is the ratio of the
benchmark's performance to the hourly VM charges of the provider [Profitbricks13].
4.2 Hardware and Software Specifications
4.2.1 Hardware Specifications
Unixbench, Dbench, and Iperf benchmark tools are installed, configured, and executed on Linux VMs connected using SSH Client. The pre-configured virtual machines offered by Amazon EC2, Microsoft Azure, and Rackspace cloud services make it difficult to match the exact target server configurations [CloudSpectator15]. To ensure meaningful
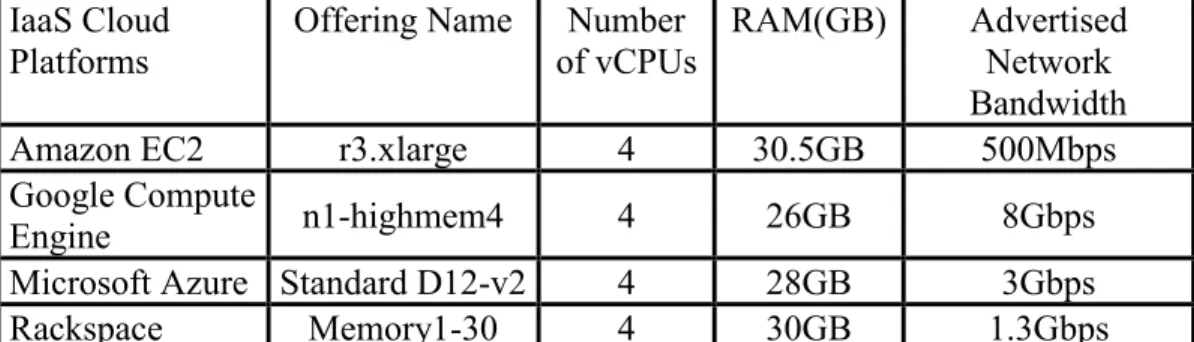
comparisons, the number of vCPUs and RAM are matched across the IaaS cloud platforms. Instances or virtual machines are divided into different types for comparable use cases: general purpose instances, compute-intensive instances, and memory-intensive instances. Tables 5, 6, and 7 display the VM parameters of four IaaS cloud platforms under the three categories of instance types.
IaaS Cloud
Platforms Offering name Number of vCPUs RAM(GB) Advertised Network Bandwidth
Amazon EC2 t2.micro 1 1GB Less than 500Mbps
Google Compute
Engine Customized 1 1GB 2Gbps
Microsoft Azure Standard-A1 1 1.75GB 500Mbps
Rackspace General1-1 1 1GB 200Mbps
IaaS Cloud
Platforms Offering Name Number of vCPUs RAM(GB) Advertised Network Bandwidth
Amazon EC2 r3.xlarge 4 30.5GB 500Mbps
Google Compute
Engine n1-highmem4 4 26GB 8Gbps
Microsoft Azure Standard D12-v2 4 28GB 3Gbps
Rackspace Memory1-30 4 30GB 1.3Gbps
Table 6: Memory-Intensive Instances across Cloud Providers
IaaS Cloud
Platforms Offering Name Number of vCPUs RAM(GB) Advertised Network Bandwidth
Amazon EC2 c4.2xlarge 8 15GB 1000Mbps
Google Compute
Engine Customized 8 15GB 16Gbps
Microsoft Azure Standard F8 8 16GB 5Gbps
Rackspace Compute1-15 8 15GB 1.3Gbps
Table 7: Compute-Intensive Instances across Cloud Providers
4.2.2 Software Specifications
Unixbench 5.1.3, Dbench, and Iperf 3.0 benchmark tools are installed and configured on all the three instances. Additional packages, such as make, GCC, automake, libpopt-dev, and g++ were installed to compile the benchmarks.
All the instances across the four IaaS cloud platforms were instantiated on the 64-bit Red Hat Enterprise Linux operating system. The SSH client, PuTTY, was used to connect to the Linux VMs on which the benchmark tools were installed and executed. PuTTygen was employed to convert the private key into .ppk format. WinSCP was used to transfer files between the virtual machine and local machine where benchmarks were executed.
Chapter 5
TEST METHODOLOGY
UnixBench, Dbench, and Iperf benchmarks are used to evaluate the server performance, file I/O performance, and internal network performance, respectively. This section describes how the benchmark tests were executed.
There are certain key conditions that need to be considered before conducting benchmark tests. While running any benchmark on a specific instance, it is important to make sure that no other applications are running on that instance, as other applications would consume system resources resulting in inaccurate results. Every test session was
performed on a newly instantiated VM allowing for the possibility of switching physical server throughout the test period, which would enable accurate identification of
performance variability. All the instances tested across the IaaS cloud platforms were launched in US data centers to ensure uniform comparisons. To test the internal network performance using Iperf benchmark, two virtual instances of the same VM configuration were instantiated where one instance acts as server and the other as client.
• Performance benchmarking and performance variability
IaaS cloud platforms were tested and evaluated by conducting the benchmarks to evaluate server performance, file I/O performance, and network performance.
over the time [Schad10]. The benchmark tests were run at peak hours and non-peak hours, on business days and on the weekend for a total of four sessions, with each session representing the test occurrences for the week.
• Price-per-performance analysis
Price-per-performance analysis is determined to identify the best-valued IaaS platform. It is calculated by dividing the IaaS cloud platforms' benchmark result by hourly VM charges.
5.1 Performance Benchmarking and Performance Variability
5.1.1 Server Performance
UnixBench is the system benchmark suite used to provide a basic indicator of the system performance of a Unix-like system [Github17]. UnixBench consists of number of
individual tests - Dhrystone, Whetstone, Execl throughput, File Copy, Pipe throughput, Pipe-based Context Switching, Process Creation, Shell Scripts, System call overhead, and Graphical tests. Each of these tests evaluates various aspects of the system's performance. A single run of the benchmark generates individual index values of all the tests and produces an overall index of the system [Github17]. The testing methodology is as follows:
1. Create and launch a general purpose instance on all four IaaS cloud platforms.
2. Install and configure Unixbench on each general purpose instance of all four IaaS cloud platforms (See Appendix A for details on Unixbench installation and setup).
3. Run the benchmark for Single-threaded tests and Multi-threaded tests by specifying the number of CPU cores to use and number of parallel tests. Single-threaded tests use one CPU core and run a single copy of test program at a time, whereas Multi-threaded tests utilize multiple CPU cores and run multiple copies of the same tests.
4. Run each test twice per session and then calculate the average score for each test.
5. Calculate the median for the set of respective average scores captured from different sessions for both Single-threaded and Multi-threaded tests.
6. Compare the median scores across the IaaS cloud platforms.
7. For both Single-threaded and Multi-threaded tests, determine performance variability for the aggregate scores across sessions on all the IaaS cloud platforms.
8. Analyze the performance variability using T-test function and Coefficient of Variation %. Calculate P-values for each pair of providers on the aggregated scores captured from each test session.
9. Follow the steps (1) through (8) on memory-intensive instances across all the IaaS cloud platforms.
10.Follow the steps (1) through (8) on compute-intensive instances across all the IaaS cloud platforms.
5.1.2 File I/O Performance
Dbench benchmark generates I/O workloads to file system [Dbench17]. This benchmark only performs file system calls, but does not perform networking calls. The purpose of Dbench is to predict how the server can handle concurrent client processes performing the workload without any lag in the response time. All the throughput values of
individual client processes are aggregated to the average throughput of the server. Dbench benchmark was executed to perform two different tests- standard file I/O tests and file I/O performance overhead test. Standard file I/O test is performed by executing the benchmark with standard file I/O options by varying the number of client processes. File I/O performance overhead test is performed to by executing the synchronous file operations by varying the number of clients. File I/O performance overhead tests
determine how the server can handle under unexpected load conditions. The synchronous file operations create extra writes to the disk resulting in the performance overhead on the server (See Appendix B for Dbench installation and setup). The testing methodology is as follows:
1. Create and launch a general purpose instance on all four IaaS cloud platforms.
2. Install and configure Dbench on each general purpose instance of four IaaS cloud platforms (See Appendix B for details on Dbench installation and setup).
3. On each test session, run the benchmark to test standard file I/O throughput and file I/O overhead throughput, for each of the four IaaS cloud platforms.
4. Configure the benchmark parameters by varying the number of client
processes (1, 2, 25, 50,100,200, and 300) and capture the throughput results. 5. For each IaaS platform, calculate the median for the set of throughput values
captured from all the test sessions.
6. For file I/O performance overhead, run the benchmark by tuning the parameters, including number of client processes and file I/O options. 7. For each IaaS platform, calculate the median for the set of throughput values
captured from all the test sessions.
8. Compare the IaaS cloud platforms with respect to standard file I/O throughput and file I/O overhead throughput.
9. For both tests, determine the performance variability by calculating the median for the set of respective throughput results obtained from each test session.
10.Performance variability is analyzed using T-test function and Coefficient of Variation.
11.For standard file I/O test and file I/O performance overhead tests, calculate P-values for each pair of IaaS cloud platforms for the median throughput values with different set of client parameters (50,100, 200, and 300) captured from four test sessions.
12.Repeat steps (1) through (11) for memory-intensive instances across all the IaaS cloud platforms.
13.Repeat steps (1) through (11) for compute-intensive instances across all the IaaS cloud platforms.
5.1.3 Network Performance
The Iperf tool measures the throughput of the network carrying TCP data streams. The purpose of the benchmark is to measure the TCP network throughput between two virtual machines [Iperf17]. The benchmark tests transfer as much data as possible through the internal network for 1800 seconds over default TCP port 5201.The tests are run with increasing the number of parallel clients to measure the QoS functionality [Mytton14]. The maximum number of clients allowed by Iperf is 128. The testing methodology is as follows:
1. Create and launch two general purpose instances on all four IaaS cloud platforms. Name the instances - Client or Server.
2. Install and configure Iperf tool on the two general purpose instances of each cloud platform (See Appendix C for details on Iperf installation and setup). 3. Enable the Server instance to listen to port 5201.
4. Allow Client instance to connect to the Server instance over the default port, using the Server's IP address.
5. Run each test iteration for 1800 seconds by varying the number of simultaneous connections (1, 50, and128) from the Client instance to the Server instance.
6. Calculate the overall median throughput for the set of throughput results captured from four test sessions.
7. Compute the median for the set of throughput values obtained from each test session. This is to determine the performance variability.
8. Performance variability is analyzed using T-test function and Coefficient of Variation.
9. Calculate the P-values for each pair of IaaS cloud platforms for the median throughput values with different set of client parameters (50 and 128) captured from four test sessions.
10.Repeat steps (1) through (9) for memory-intensive instances across all the IaaS cloud platforms.
11.Repeat steps (1) through (9) for compute-intensive instances across all the IaaS cloud platforms.
5.2 Price-per-Performance Analysis
The price-per-performance is calculated on all the IaaS cloud platforms across three different instances with respect to server performance, file I/O performance, and network performance.
5.2.1 Price-per-Server Performance
1. On general purpose instances, price-per-server performance value for each IaaS platform is calculated by dividing Unixbench score by VM charge per hour. 2. Compare the IaaS cloud platforms against price-per-server performance values. 3. Identify the best-valued IaaS platform.
5.2.2 Price-per-File I/O Performance
1. On general purpose instances, price-per-file I/O performance value for each IaaS platform is calculated by dividing provider's throughput by VM charge per hour. 2. Compare the IaaS cloud platforms against price-per-file I/O performance values. 3. Identify the best-valued IaaS platform.
5. Repeat the step (1) and step (3) for compute-intensive instance and memory-intensive instance.
5.2.3 Price-per-Network Performance
1. On general purpose instances, price-per-network performance value for each IaaS platform is calculated by dividing provider's throughput by VM charge per hour. 2. Compare the IaaS cloud platforms against price-per-network performance values. 3. Identify the best-valued IaaS platform.
4. Repeat the step (1) and step (3) for compute-intensive instance and memory-intensive instance.
Chapter 6
RESULTS AND ANALYSIS
This chapter summarizes the analysis of how the four IaaS cloud platforms performed with respect to server performance, file I/O, and network performance on each instance category. The best-valued IaaS platform for each benchmarking test was also determined.
The Microsoft Excel 2007 T-Test function was used to perform statistical analysis on the collected data in order to calculate P-values for the Unixbench score, file I/O throughput, and network throughput. Since the standard deviations for the two datasets may be different, the T-Test function was performed using the two-tailed distribution (tails = 2) and two-sample unequal variance (type = 3) options. The difference in the datasets is said to be statistically significant if obtained P-value is < 0.05. T-test was calculated on the pair-wise comparison of IaaS cloud platforms. All the data points from the four test sessions were used to calculate the T-test.
The Coefficient of Variation (CoV) was used as a measure to determine performance variability [Schad10]. The Coefficient of Variation is derived from variance, standard variance, and mean. It is expressed as percentage and is defined as the ratio of standard deviation and mean. Lower CoV indicates stability in performance throughout the test period. The Coefficient of Variation for each IaaS platform was calculated on the data points of each benchmark test captured across the test sessions.
The price-per-performance value was calculated to determine a provider's ability to deliver the expected performance for the price charged. It was used to identify the best-valued IaaS platform. A higher price-per-performance value indicates better performance at lower costs [Profitbricks13].
6.1 Server Performance
Unixbench benchmark suite was used to test the server performance running Single-threaded and Multi-Single-threaded tasks. As discussed in Chapter 3, server performance depends on many factors such as processor, CPU clock speed, compiler, and operating system [CloudHarmony14]. All the instances across all the IaaS cloud platforms were run on the same OS (i.e. Red Hat Enterprise Linux 7). To maintain uniformity, the same version of gcc compiler was matched on all virtual instances.
6.1.1 General Purpose Instances
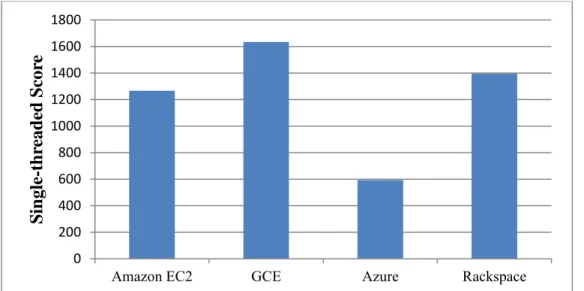
Table 8 shows the comparison of Single-threaded scores and Multi-threaded scores across the IaaS cloud platforms. The scores listed in the table are obtained by calculating the median for individual scores captured across the test sessions. Figure 1 shows the comparison of Single-threaded scores across the IaaS cloud platforms on general purpose instances. Figure 2 shows the comparison of Multi-threaded scores across the IaaS cloud platforms on general purpose instances.
IaaS Cloud Platforms Single-threaded score Multi-threaded score
Amazon EC2 1266.60 213.18
Google Compute Engine 1634.08 1625.20
Microsoft Azure 592.55 919.19
Rackspace 1394.38 1359.73
Table 8: Single- and Multi-Threaded Scores on General Purpose Instance
Figure 1: Single-Threaded Scores on General Purpose Instance
Figure 2: Multi-Threaded Scores on General Purpose Instance 0 200 400 600 800 1000 1200 1400 1600 1800
Amazon EC2 GCE Azure Rackspace
S in gle -thr ead ed S cor e 0 200 400 600 800 1000 1200 1400 1600 1800
Amazon EC2 GCE Azure Rackspace
M u lti -thr ead ed S cor e
GCE achieved the highest scores due to its advanced processor- Intel Xeon with a CPU speed of 2.60GHz [GCE17A].The poorest performance of Azure in the single-threaded test was because of the inadequate physical hardware for the general purpose instance [Nottingham16]. Amazon EC2 delivered the least performance in the Multi-threaded test due to its burstable CPU core [Azavea14]. Figure 1 shows that the performance score of GCE's Single-threaded performance was 2.7 times more than that of Azure. Figure 2 indicates that the performance score of GCE was 7.6 times more than that of Amazon EC2 in the Multi-threaded test.
6.1.1.1Performance Variability
For both Single-threaded and Multi-threaded tests, P-value was calculated for each pair of IaaS cloud platforms on the scores captured from the four test sessions. Table 1 (See Appendix D for Statistical Analysis) shows the P-values for Single-threaded and Multi-threaded tests on General purpose instance. The difference in the Single-Multi-threaded scores between Amazon EC2 and Rackspace were found to be statistically insignificant with a P-value of 0.289. The differences in the Multi-threaded scores between all the pairs of cloud providers were statistically significant due to a P-value < 0.05.
Table 9 shows the Single-threaded scores of each provider throughout the test period with CoV indicating performance variability.Table 10 shows the Multi-threaded scores of each provider throughout the test period with CoV indicating performance variability. In both the tests, GCE was the most consistent IaaS platform with the least CoV. Amazon
EC2 displayed highest variability in performance, possibly due to VM resource contention between users [Makroo16].
Sessions Amazon EC2 (score) Google Compute Engine (score) Microsoft Azure (score) Rackspace (score) Session-1 1155.60 1650.55 567.50 1489.40 Session-2 1376.45 1617.60 617.60 1522.35 Session-3 1446.05 1608.80 618.25 1279.95 Session-4 1156.75 1659.40 517.15 1299.35 Coefficient of Variation % 11.68% 1.51% 8.32% 9.00%
Table 9: Single-Threaded Scores with CoV on General Purpose Instance
Sessions Amazon EC2 (score)
Google Compute
Engine (score) Microsoft Azure (score) Rackspace (score) Session-1 259.25 1639.75 598.50 1458.05 Session-2 204.10 1610.65 652.65 1494.55 Session-3 206.95 1575.45 661.45 1251.35 Session-4 219.40 1649.70 542.75 1261.40 Coefficient of Variation % 11.43% 2.06% 8.95% 9.36%
Table 10: Multi-Threaded Scores with CoV on General Purpose Instance
6.1.1.2Price-per-Server Performance on General Purpose Instance
Price-per-server performance value for each IaaS platform was determined by dividing the respective score by VM charge per hour. Table 11 shows the comparison of
price-per-server performance values across all the platforms. The price-per-price-per-server performance value was higher for GCE. The higher price-per-server performance value indicates that the IaaS platform delivers good performance at low price [Profitbricks13]. Therefore, GCE was the best-valued IaaS platform.
IaaS Cloud Platforms Price-per-server performance value
Amazon EC2 2920.27
Google Compute Engine 56041.38
Microsoft Azure 9675.68
Rackspace 11621.62
Table 11: Price-per-Server Performance on General Purpose Instance
6.1.2 Memory-Intensive Instances
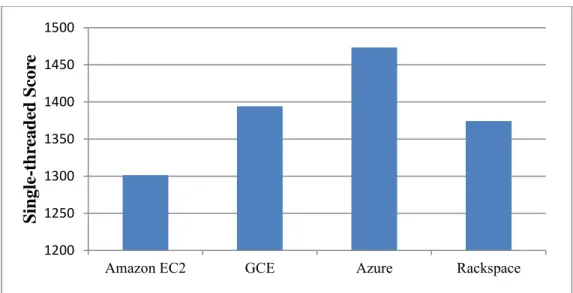
Table 12 shows the comparison of Single-threaded scores and Multi-threaded scores across the IaaS cloud platforms. The scores listed in the table were obtained by
calculating the median for individual scores captured across the test sessions. Figure 3 shows the comparison of Single-threaded scores across the IaaS cloud platforms on memory-intensive instance. Figure 4 shows the comparison of Multi-threaded scores across the IaaS cloud platforms on memory-intensive instance.
IaaS Cloud Platforms Single-threaded score Multi-threaded score
Amazon EC2 1301.53 3183.10
Google Compute Engine 1394.33 3312.48
Microsoft Azure 1473.35 4172.73
Rackspace 1301.53 3183.10
Figure 3: Single-Threaded Scores on Memory-Intensive Instance
Figure 4: Multi-Threaded Scores on Memory-Intensive Instance
Figure 3 and Figure 4 indicate that Azure achieved the highest performance due to its advanced processor with increased CPU frequency of 3.2 GHz with Intel Turbo Boost Technology providing a performance boost [Nottingham16]. The lowest performance of Amazon EC2 was as result of its underlying processor-Intel Xeon with clock speed of 2.5 GHz [AmazonEC217A]. 1200 1250 1300 1350 1400 1450 1500
Amazon EC2 GCE Azure Rackspace
S in gle -thr ead ed S cor e 0 500 1000 1500 2000 2500 3000 3500 4000 4500
Amazon EC2 GCE Azure Rackspace
M u lti -thr ead ed S cor e
6.1.2.1Performance Variability
For both Single-threaded and Multi-threaded tests, P-value was calculated for each pair of IaaS cloud platforms on the scores captured from the four test sessions. Table 2 (See Appendix for Statistical Analysis) shows the P-values for Single-threaded and Multi-threaded tests on Memory-intensive instance. For Single-Multi-threaded and Multi-Multi-threaded tests, GCE and Amazon EC2 were statistically significant with each other with a P-value < 0.05.
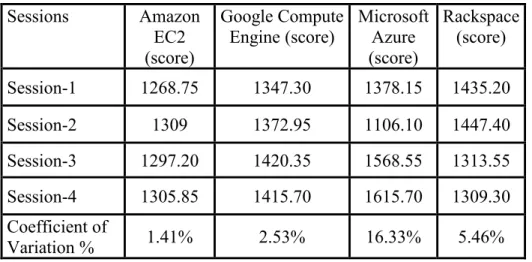
Table 13 shows the Single-threaded scores of each IaaS platform throughout the test period with CoV indicating the variability in performance. Table 14 shows the Multi-threaded scores of each IaaS platform throughout the test period with CoV indicating the variability in performance. In both the tests, Amazon EC2 was the most consistent IaaS platform with the least CoV. Azure displayed the least stability in performance, possibly due to VM resource contention between users [Makroo16].
Sessions Amazon EC2 (score)
Google Compute
Engine (score) Microsoft Azure (score) Rackspace (score) Session-1 1268.75 1347.30 1378.15 1435.20 Session-2 1309 1372.95 1106.10 1447.40 Session-3 1297.20 1420.35 1568.55 1313.55 Session-4 1305.85 1415.70 1615.70 1309.30 Coefficient of Variation % 1.41% 2.53% 16.33% 5.46%
Table 13: Single-Threaded Scores with CoV on Memory-Intensive Instance
Sessions Amazon
EC2 (score)
Google Compute
Engine (score) Microsoft Azure (score) Rackspace (score) Session-1 3109.65 3276.70 4172.20 3343.10 Session-2 3167.35 3261.95 3016.70 3380.80 Session-3 3198.85 3348.25 4173.25 3025.30 Session-4 3209.50 3404.60 4289.75 3040.65 Coefficient of Variation % 1.41% 1.99% 15.34% 5.96%
Table 14: Multi-Threaded Scores with CoV on Memory-Intensive Instance
6.1.2.2Price-per-Server Performance on Memory-Intensive Instance
Price-per-server performance value for each IaaS platform was determined by dividing the respective score by VM charge per hour. Table 15 shows the comparison of price-per-server performance values across all the IaaS cloud platforms. The price-per-price-per-server performance value was higher for GCE. Therefore, GCE was the best-valued IaaS
IaaS Cloud Platforms Price-per-server performance value
Amazon EC2 7073.56
Google Compute Engine 18714.58
Microsoft Azure 9681.51
Rackspace 5811.87
Table 15: Price-per-Server Performance on Memory-Intensive Instance
6.1.3 Compute-Intensive Instances
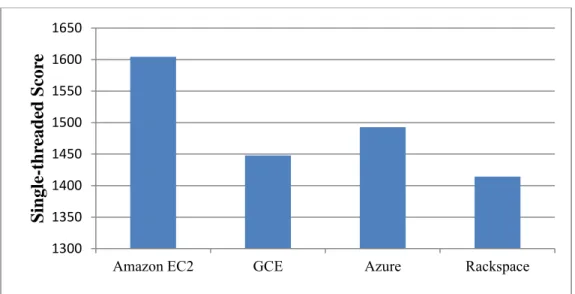
Table 16 shows the comparison of Single-threaded scores and Multi-threaded scores across the IaaS cloud platforms. The scores listed in the table were obtained by
calculating the median for individual scores captured across the test sessions. Figure 5 shows the comparison of Single-threaded scores across the IaaS cloud platforms on compute-intensive instance. Figure 6 shows the comparison of Multi-threaded scores across the IaaS cloud platforms on compute-intensive instance.
IaaS Cloud Platforms Single-threaded score Multi-threaded score
Amazon EC2 1604.43 5819.53
Google Compute Engine 1447.75 5218.90
Microsoft Azure 1492.65 6331.30
Rackspace 1414.28 4423.18
Figure 5: Single-Threaded Scores on Compute-Intensive Instance
Figure 6: Multi-Threaded Scores on Compute-Intensive Instance
Figure 5 indicates that Amazon EC2 achieved the highest performance in the Single-threaded test because its compute-intensive instance runs on a customized processor at a speed of 2.9 GHz. This instance was designed to deliver the highest level of processor performance [Barr14]. Figure 6 indicates that Azure delivered highest Multi-threaded
1300 1350 1400 1450 1500 1550 1600 1650
Amazon EC2 GCE Azure Rackspace
S in gle -thr ead ed S cor e 0 1000 2000 3000 4000 5000 6000 7000
Amazon EC2 GCE Azure Rackspace
M u lti -thr ead ed S cor e
performance because its processor with a high CPU clock speed of 3.1 GHz provides a performance boost by utilizing all eight vCPUs consistently [Nottingham16].
6.1.3.1Performance Variability
For both Single-threaded and Multi-threaded tests, P-value was calculated for each pair of IaaS cloud platforms on the scores captured from the four test sessions. Table 3(See Appendix D for Statistical Analysis) shows the P-values for Single-threaded and Multi-threaded scores on Compute-intensive instance. The differences in Single-Multi-threaded scores by two pairs of IaaS cloud platforms - GCE Vs Amazon EC2, and Amazon EC2 Vs Rackspace were statistically significant. The differences in Multi-threaded scores by four pairs of IaaS cloud platforms - GCE Vs Amazon EC2, GCE Vs Rackspace, Amazon EC2 Vs Rackspace, and Rackspace Vs Azure were statistically significant with a P-value < 0.05.
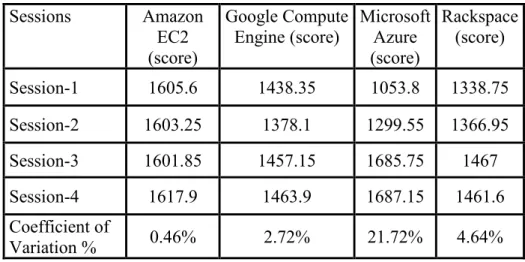
Table 17 shows the Single-threaded scores of each IaaS platform throughout the test period with CoV indicating the variability in performance. Table 18 shows the Multi-threaded scores of each provider throughout the test period with CoV indicating the variability in performance. In both the tests, Amazon EC2 was the most consistent IaaS platform with the least CoV. Azure displayed the least consistency in performance. One possible explanation for the performance variability in Azure was due to the VM resource contention between users [Makroo16].
Sessions Amazon EC2 (score)
Google Compute
Engine (score) Microsoft Azure (score) Rackspace (score) Session-1 1605.6 1438.35 1053.8 1338.75 Session-2 1603.25 1378.1 1299.55 1366.95 Session-3 1601.85 1457.15 1685.75 1467 Session-4 1617.9 1463.9 1687.15 1461.6 Coefficient of Variation % 0.46% 2.72% 21.72% 4.64%
Table 17: Single-Threaded Scores with CoV on Compute-Intensive Instance
Sessions Amazon
EC2 (score)
Google Compute
Engine (score) Microsoft Azure (score) Rackspace (score) Session-1 5790.2 5303.75 6454.1 4069.5 Session-2 5881.1 5009.75 4580.4 4294.35 Session-3 5772 5173 6335.2 4602.15 Session-4 5848.85 5264.8 6327.4 4552 Coefficient of Variation % 0.87% 2.52% 15.15% 5.63%
Table 18: Multi-Threaded Scores with CoV on Compute-Intensive Instance
6.1.3.2Price-per-Server Performance on Compute-Intensive Instance
Price-per-server performance value for each IaaS platform was determined by dividing the respective score by VM charge per hour. Table 19 shows the comparison of price-per-server performance values across all the IaaS cloud platforms. From the table it can be observed that the price-per-server performance value was higher for GCE. Therefore, GCE was the best-valued IaaS platform.