Marketing Solutions Enabled by Big Data
Using Structural Models
By Xiao Liu
A dissertation submitted to
Tepper School of Business, Carnegie Mellon University in partial fulfillment of the requirements for the degree of
DOCTOR OF PHILOSOPHY in Industrial Administration (Marketing)
Doctoral Committee:
Professor Kannan Srinivasan (Co-Chair)
Professor Alan Montgomery (Co‐Chair)
Professor Baohong Sun Professor Param Vir Singh Professor Burton Hollifield
Abstract
Digital marketing has brought in enormous capture of consumer data. In quantitative marketing, researchers have adopted structural models to explain the (dynamic) decision process and incentives of consumers. However, due to computational burdens, structural models have rarely been applied to big data. Machine learning algorithms that perform well on big data, however, hardly have any theoretical support. Equipped with both economics perspective and machine leaning techniques, in this dissertation, I aim to combine rigorous economic theory with machine learning methods and apply them to data on a large scale. First of all, I am deeply rooted in economic theory in understanding the behaviors of consumers, firms and the entire market. In my first essay “An Empirical Analysis of Consumer Purchase Behavior of Base Products and Add-ons Given Compatibility Constraints”, I model consumers as forward-looking utility maximizers who consider the product bundle of base products and add-ons jointly. I derive the add-on-to-base effect from the solution of the dynamic programming problem and then quantified it by model estimates. The underlying theory of switching cost caused by incompatibility constraints helps me rationalize the high market share of Sony’s despite its high price. Without this theoretical foundation, I could not explain the data puzzle and might have fallen into false causality. Doing empirical research in this time of an explosion of the quantity and quality of data is fortuitous. With the help of “Big Data”, I am able to explore new areas of research, like social media. In my second essay “A Structured Analysis of Unstructured Big Data Leveraging Cloud Computing”, I conduct analysis on a staggering volume of nearly two billion tweets to predict TV show ratings. Different from the traditional economics data that can be easily stored in a spreadsheet, the unstructured format and sheer volume of the tweet data challenges traditional information extraction and selection methods. But after careful sifting the data through a combination of methods from cloud computing, machine learning and text mining, the rich content information imbedded in the text provides us with much better explanatory and predictive power.
The beauty of structural models comes with a cost of computational burden as manifested in estimating dynamic choice models. The problem of curse of dimensionality is exacerbated when I estimate the model at the individual level on a large sample, as I do in the third essay “Overhaul Overdraft Fees: Creating Pricing and Product Design Strategies with Big Data”. In this project I build a model where I assume consumers perform financial planning and spend their money rationally subject to monitoring cost and heavy discounting tendency. As consumers exhibit significantly different behavior patterns, I need to estimate the model at the individual level in order to design targeted strategies. But to do this with the standard estimation methods takes prohibitively large amount of time. To solve this problem I borrow a new parallel computing algorithm to conduct parallel MCMC to speed up the estimation. This facilitates the marriage of applying the structural model on Big Data.
Acknowledgements
I would like to thank my co-advisors, Professor Kannan Srinivasan and Professor Alan Montgomery for their tremendous help, nurture and support. They set up an example for me to be passionate and rigorous with research. Every time after our conversation, I feel sobered with brilliant insights and inspired with full-hearted motivation. They strengthened my conviction to be a scholar to discover and contribute knowledge to the public.
I am sincerely obliged to Professor Baohong Sun. It was she who brought be to CMU and taught me how to combine consumer behavior theory with empirical modeling techniques. She urged me to read plenty of classical marketing papers, she supported me to go to the top-tier conferences since my first year in the PhD program and she started the first project with me. These experiences all helped me lay a solid foundation for the future research. I also want to thank Professor Joachim Vosgerau who gave me a hand when I had a hard time. His integrity and generosity helped me survive the hardship and gain confidence to overcome difficulties and move forward.
I feel incredibly fortunate to have worked closely with Professor Param Vir Singh who challenged me to create works that are rich in managerial implications. My thanks also go to Professor Burton Hollifield who encouraged me to work in the area of marketing-finance interface.
I benefited enormously from a number of faculty members and alumni of CMU: Professor Guofang Huang, Professor Nitin Metha (University of Toronto), Professor Kevin Chung (University of Wisconsin-Madison), Professor Baojun Jiang (Washington University St. Louis), Professor Jeff Galak, Professor Chris Olivola, Professor Kinshuk Jerath (Columbia University), Professor Peter Boatwright, Professor Carey Morewedge, Professor Kaifu Zhang, Professor George Loewenstein, Professor Rahul Telang, Professor Beibei Li, Professor Vibhanshu Abhishek, Professor Vishal Singh (New York University), Professor Vineet Kumar (Yale University), Professor Timothy Derdenger, Professor Yan Huang (University of Michigan), Professor Yingda Lu (Rensselaer Polytechnic Institute), Professor Helen Yangfang Zhou (Singapore Management University), Professor Yaroslav Kryukov, Professor Joachim Ryohei Groeger, Professor Bo Zhou (University of Maryland), Professor Liye Ma (University of Maryland), Professor Young Eun Huh, Professor Amin Sayedi (University of Washington), Willie Neiswanger, Professor Juanjuan Zhang (MIT), Professor Carl Mela (Duke University), Professor Jack Xinlei Chen (CKGSB), Professor Jinhong Xie (University of Florida), Professor Wei Zhang (Iowa State University), Professor Yuhuang Zheng and many others.
I especially thank Professor Dipankar Chakravarti and Mrs. Sharmila Chakravarti for their generosity to provide the me with a fellowship to support by dissertation.
Thanks to Lawrence Rapp for the continuous help.
I am grateful to have many friends who made my Phd studies a colorful period of life. Special thanks go to Qianyun Xie, Zichao Yang, Ryan Tae Wook Kim, Ying Xu, Jiaxu Wang, Jing Gong, Yang Yang, Sijia Wang, Ronghuo Zheng, Ying Zhang and Miao Fan. I also thank Francisco Cisternas for being there all the time.
Most importantly, I'll give my deepest thanks to my parents who make me a better person every day. This dissertation is dedicated to my mother Mrs. Chunling Xiao and my father Mr. Yongchang Liu.
Contents
Abstract ... 2 Acknowledgements ... 3 Contents ... 5 Introduction ... 9 1 Chapter 1 ...11 1.1 Introduction ...12 1.2 Literature Review ...141.3 Industry Background and Data Description...15
1.3.1 Digital Camera and Memory Card Industries ...15
1.3.2 Data Description ...17
1.3.3 Model Free Evidence of Cross-Category Inter-temporal Dependence ...21
1.4 Model ...24
1.4.1 Assumption ...24
1.4.2 Consumer Choices and Flow Utility ...25
1.4.3 State Transitions ...30
Inventory Process ...30
Price and Quality Process ...31
1.4.4 Dynamic Optimization Problem and Inter-temporal Tradeoffs ...31
1.4.5 Heterogeneity, Initial Value, and Estimation ...33
1.5 Results and Discussion ...34
1.5.1 Model Comparison ...34
1.5.2 Add-on-to-Base Effect and Cross-category Dynamic Price Effect ...37
1.5.2.1 Dynamic Add-on-to-Base Effect and Interaction with Future Prices of Add-ons .38 1.5.2.2 Quantify Purchase “Lock-In” due to Compatibility ...39
1.5.2.3 Inter-temporal Price Tradeoff—Price Elasticity ...41
1.6 Counterfactual Simulations...42
1.6.1 Alternative Dynamic Pricing Strategies ...43
1.6.2 Compatibility ...43
1.6.3 Partial Compatibility ...44
1.6.4 Incompatibility and Brand Equity ...45
1.7 Conclusions and Future Research ...46
2.1 Introduction ...50
2.2 Literature Review ...52
2.2.1 Social Media Predictions ...52
2.2.2 The Effect of Online UGC on Sales ...53
2.2.3 Mining Unstructured Text Data ...54
2.3 Data description ...55
2.3.1 TV series ...55
2.3.2 NFL ...56
2.3.3 A.C. Nielsen Ratings ...56
2.3.4 Twitter ...58
2.3.4.1 Data gathering ...58
2.3.4.2 Selecting relevant Tweets ...59
2.3.4.3 TV Series ...59
2.3.4.4 NFL ...60
2.3.5 Google Trends ...61
2.3.6 Wikipedia ...62
2.3.7 IMDB Reviews ...63
2.3.8 The Huffington Post News ...63
2.3.9 Comparing Ratings, Twitter Tweets, Google Trends, Wikipedia Views, IMDB Reviews and Huffington Post News ...64
2.4 Structured Analysis ...65
2.4.1 Dynamic Panel Data Linear Model ...65
2.4.2 Information in Tweets, IMDB Reviews and Huffington Post News ...66
2.4.2.1 Information measures of Content: Count, Sentiment and n-grams PCA ...66
2.4.2.2 Information Timeliness ...67
2.4.3 Challenges in Processing Enormous Unstructured Data – Cloud Computing Techniques ...68
2.4.4 Alternative Machine Learning Models ...69
2.5 Results ...70
2.5.1 Specification Tests and Fit ...70
2.5.1.1 Stationarity Tests ...70
2.5.1.2 IV validity and Serial correlation ...70
2.5.1.3 Number of Lags...70
2.5.2.1 People Tweet about what they are going to do ...70
2.5.2.2 Twitter Content is a lead indicator of TV Ratings ...73
2.5.3 Forecasting ...78
2.6 Conclusions ...80
3 Chapter 3 ...82
3.1 Introduction ...83
3.2 Related Literature ...84
3.3 Background and Model Free Evidence ...86
3.3.1 Summary Statistics ...87
3.3.2 Model Free Evidence ...90
3.3.2.1 Heavy Discounting ...90 3.3.2.2 Inattention ...91 3.3.2.3 Dissatisfaction ...95 3.4 Model ...97 3.4.1 Timing ...98 3.4.2 Basic Model ...99
3.4.3 Inattention and Balance Checking ... 100
3.4.4 Dissatisfaction and Account Closing ... 101
3.4.5 State Variables and the Transition Process ... 102
3.4.6 The Dynamic Optimization Problem and Intertemporal Tradeoff ... 104
3.4.7 Heterogeneity... 106
3.4.8 Numerical Example ... 106
3.4.8.1 Effect of Overdraft ... 106
3.4.8.2 Effect of Inattention--Overdraft ... 107
3.4.8.3 Effect of Inattention--Error Constraints Spending ... 108
3.5 Identification and Estimation ... 108
3.5.1 Identification ... 108
3.5.2 Likelihood ... 110
3.5.3 Estimation: Imai, Jain and Ching (2009) ... 111
3.5.3.1 Modified IJC ... 111
3.5.3.2 Parallel Computing: Neiswanger, Wang and Xing (2014) ... 111
3.6 Results ... 113
3.6.1 Model Comparison ... 113
3.6.3 Parameter Estimates ... 115
3.7 Counterfactuals ... 116
3.7.1 Pricing ... 116
3.7.2 Alerts Benefit Consumers And the Bank ... 117
3.7.3 Optimal Alert Strategy ... 118
3.8 Contributions and Limitations ... 120
Bibliography ... 122
Appendix for Chapter 1 ... 128
A1.1. Model Details ... 128
A1.2. Identification ... 130
A1.3. Focal Store Assumption ... 132
A1.4. Other Utility Specifications ... 133
A1.5. Procedure for Decomposition Analysis... 135
Appendix for Chapter 2 ... 137
A2.1 Alternative Models ... 137
Autoregression X... 137
LDA (Latent Dirichlet Allocation) ... 139
A2.2 Regression and Prediction Results for the One-Week Window ... 140
A2.3 Correlation among Independent Variables ... 142
A2.4 Details of Implementation of EMR ... 144
Appendix for Chapter 3 ... 145
A3.1 Overdraft Fees at Top US Bank ... 145
A3.2 Estimation Algorithm: Modified IJC ... 145
A3.3 Parallel MCMC Sampling Algorithm ... 147
Introduction
Digital marketing has brought in enormous capture of consumer data. In quantitative marketing, researchers have adopted structural models to explain the (dynamic) decision process and incentives of consumers. However, due to computational burdens, structural models have rarely been applied to big data. Machine learning algorithms that perform well on big data, however, hardly have any theoretical support. Equipped with both economics perspective and machine leaning techniques, in this dissertation, I aim to combine rigorous economic theory with machine learning methods and apply them to data on a large scale. First of all, I am deeply rooted in economic theory in understanding the behaviors of consumers, firms and the entire market. That’s why I always have impetus to employ economic theories to explain the data at hand. In my first essay “An Empirical Analysis of Consumer Purchase Behavior of Base Products and Add-ons Given Compatibility Constraints”, I model consumers as forward-looking utility maximizers who consider the product bundle of base products and add-ons jointly. I derive the add-on-to-base effect from the solution of the dynamic programming problem and then quantified it by model estimates. The underlying theory of switching cost caused by incompatibility constraints helps me rationalize the high market share of Sony’s despite its high price. Without this theoretical foundation, I could not explain the data puzzle and might have fallen into false causality. Doing empirical research in this time of an explosion of the quantity and quality of data is fortuitous. As two of my favorite economists, Liran Einav and Jonathan Levin have said, “Large-scale administrative datasets and proprietary private sector data can greatly improve the way we measure, track and describe economic activity.” With the help of “Big Data”, I am able to explore new areas of research, like social media. In my second essay “A Structured Analysis of Unstructured Big Data Leveraging Cloud Computing”, I conduct analysis on a staggering volume of nearly two billion tweets to predict TV show ratings. Different from the traditional economics data that can be easily stored in a spreadsheet, the unstructured format and sheer volume of the tweet data challenges traditional information extraction and selection methods. But after careful sifting the data through a combination of methods from cloud computing, machine learning and text mining, the rich content information imbedded in the text provides us with much better explanatory and predictive power. This project has encouraged me to advocate for collecting and using Big Data to conduct marketing research. Armed with state-of-the-art data processing and analyzing techniques, I am anxious to tackle the complex real-world problems with Big Data to offer new insights on consumer behavior, firm strategies and public policy.
The beauty of structural models comes with a cost of computational burden as manifested in estimating dynamic choice models. When estimating the Base and Add-on model, I encounter the problem of curse of dimensionality because there were too many dimensions of the state variables. The problem is exacerbated when I tried to estimate the model at the individual level on a large sample, as I do in the third essay “Overhaul Overdraft Fees:
Creating Pricing and Product Design Strategies with Big Data”. In this project I build a model where I assume consumers perform financial planning and spend their money rationally subject to monitoring cost and heavy discounting tendency. As consumers exhibit significantly different behavior patterns, I need to estimate the model at the individual level in order to design targeted strategies. But to do this with the standard estimation methods takes prohibitively large amount of time. To solve this problem I borrow a new parallel computing algorithm to conduct parallel MCMC to speed up the estimation. This facilitates the marriage of applying the structural model on Big Data.
In summary, I have done research in areas spanning high-tech marketing, social media and consumer financial decision making using structural models and “Big Data”. I hope these studies help researchers and marketers create better marketing solutions enabled by Big Data using structural models.
1
Chapter 1
An Empirical Analysis of Consumer Purchase Behavior of Base Products
and Add-ons Given Compatibility Constraints
Xiao Liu, Timothy Derdenger, and Baohong Sun1
Abstract
Despite the common practice of multiple standards in the high-technology product industry, there is a lack of knowledge on how compatibility between base products and add-ons affects consumer purchase decisions at the brand and/or standard level. We recognize the existence of compatibility constraints and develop a dynamic model in which a consumer makes periodic purchase decisions on whether to adopt/replace a base and/or an add-on product. Dynamic and interactive inventory effects are included by allowing consumers to account for the long-term financial implications when planning to switch to a base product that is incompatible with their inventory of add-ons. Applying the model to the consumer purchase history of digital cameras and memory cards from 1998 to 2004, we demonstrate that the inventory of add-ons significantly affects the purchase of base products. This “lock-in” effect is enhanced when future prices of add-ons decrease. Interestingly, it is more costly for consumers to switch from Sony to other brands than vice versa. In four policy simulations, we explore the impact of alternative pricing and compatibility policies. For example, if Sony did not create its proprietary Memory Stick, the market share of its cameras would have been reduced by 6 percentage points.
Keywords: Compatibility and standard, base product, add-on product, dynamic structural model, product adoption, product line pricing
1 Xiao Liu is a PhD student of Marketing at Tepper School of Business of Carnegie Mellon University. Email: [email protected]. Timothy Derdenger is an Assistant Professor of Marketing and Strategy of the same institute. Email: [email protected]. Baohong Sun is Dean’s Distinguished Chair Professor of Marketing at Cheung Kong Graduate School of Business. Email: [email protected]
1.1
Introduction
In high-tech markets, products often consist of a basic component, the base product (e.g. cameras), and some accessories, the add-ons (e.g. memory cards). The add-on product market is non-trivial. In 2006, the Consumer Electronics Association estimated that buyers spent an average of 15 percent of the cost of a primary consumer electronics device on compatible accessories.2 In the automobile industry, the market size of add-ons is $216
billion and has been growing at an annual rate of 8 percent since 2000.3 These statistics imply
that manufacturers are increasingly relying on selling add-ons to raise profits and, more importantly, manufacturers are eager to explore how to design add-on products in order to boost product line total sales. One common strategy is to create a proprietary standard for the add-ons to “lock in” consumers to the base product.
The compatibility creates inter-dependence between the base products and add-ons, which makes consumers’ purchase/upgrade/replacement decisions inter-connected both across time and across categories. For example, in the video game industry, many games are tied to only one type of console, e.g. Xbox or PlayStation. Game players accumulate many games over time. At the time when a console needs to be replaced, the game players usually prefer to stay with the same standard or brand of console because they want to continue playing their games (in inventory) and in this way they avoid re-purchasing all the games in inventory in order to achieve the same entertainment value offered by the old console and the games in possession. In a similar fashion, when making a smartphone replacement decision, an Android user might be hesitant to switch to an iPhone because of all the apps purchased. It is interesting and important to understand how the past ownership of add-ons affects consumer choices of brands when multiple standards exist.
There are many existing studies on cross-category purchases of durable goods at a category level. Yet, most of them do not recognize the existence of multiple standards that are regularly observed in practice. Moreover, among the few studies that focus on the interdependence of base and add-on products, many only recognize the simultaneous ownership of base and on products and not the potential impact past ownership of add-ons may have on future base product adoption. Hence, there is a need to understand the impact of proprietary standards or incompatibility between base and add-on products on consumers’ purchase decisions of these products. In this paper, we evaluate the dynamic impact of add-on products on a consumer’s choice of a base product by deconstructing the impact into the following key issues: First, how do the prices/qualities of add-ons affect consumer choice of a base product at the brand or standard level? Second, does the inventory of add-ons affect the purchase of compatible and non-compatible base products; in other words, does a compatibility requirement of add-on products create a cost of switching that locks consumers into the compatible base product? Third, how do consumer expectations about future price/quality trends of add-ons moderate the effect of inventory
2 http://www.letsgodigital.org/en/13653/camera_accessories/
of add-ons on the purchase of compatible base products? Fourth, what is the monetary equivalent for consumers to switch to a non-compatible brand? Finally, is it a profitable strategy to leverage the cost of switching created by incompatibility of add-ons with base products?
This paper provides a framework to explicitly model consumer brand and standard choices of base and add-on products and investigate the dynamic dependence between two product categories, when multiple standards exist. Distinguishing ourselves from prior literature, we model compatibility as the link between the base product and the add-ons which makes consumers’ purchase decisions dynamically interdependent. Moreover, we allow forward-looking consumers to consider the inventory of their add-ons when determining the purchase of base and add-on products. Our dynamic structural model further characterizes two new inter-temporal trade-offs of consumers simultaneously: cross-category price effect and the cross-cross-category dynamic inventory effect. Specifically, a consumer may sacrifice the current utility (lower price) of the base product for future benefit (lower price/higher quality) of the add-ons. Besides, a forward-looking consumer may sacrifice the gain from switching to a cheaper but incompatible base product in exchange for the stream of future consumption utilities from the inventory of add-ons by continuing with a compatible base product. We name the later effect the “Add-on-to-base effect”, which captures the notion that the more add-ons a consumer has accumulated, the less the consumer is willing to switch to other incompatible base products because the forward-looking consumer wants to continue enjoying the benefit of the add-ons and avoid the cost of replenishing these inventory in the future.
We apply the model to a unique panel data with 828 households and their purchase history of digital camera and memory card from December 1998 to November 2004. During the six year observation period, manufacturers of digital cameras developed (at least) three standards to take advantage of the exclusivity benefit of compatibility: Memory Stick (Standard 1) for Sony, xD Card (Standard 2) for Olympus and Fujifilm and SD Card (Standard 3) for Canon, Kodak, Nikon and HP. The unique structure of this industry provides an ideal opportunity to examine brand competition in the face of standard compatibility constraints.
We find strong empirical evidence of an “add-on-to-base effect.” Consumers are indeed locked in by the utility compatible add-ons provide. Interestingly, the cost to switch is asymmetric: it takes more for Standard 2 and Standard 3 to steal Sony consumers ($23.06 and $21.59) than for Sony to steal the consumers from the other two standards ($8.48 and $15.50). The structural model further permits us to investigate the interaction between the “cross-category price effect” and the “base effect.” We show that the add-on-to-base effect is enhanced when future prices of add-ons are lower, (i.e. when the expected future price of a memory card decreases) the purchase probability of the compatible camera increases given the same amount of add-ons purchased before.
With the use of several counterfactual simulations we also discover that if manufacturers of Standard 2 cameras lower their camera prices during the initial two year period, they can benefit more from the dynamic “add-on-to-base effect” and increase camera sales by roughly 20%. Moreover, when incompatibility is removed among standards, the manufacturer of a premium memory card cannot reap the profit from camera transactions. For instance, if Sony did not create its proprietary memory card standard, the market share of its cameras would have been reduced by 6 percentage points. Our third finding determines that the sales of Standard 3 cameras increase significantly if they adopt an adapter that makes their cameras compatible with the memory cards of Sony’s. And finally when a firm’s brand equity (approximated by the intrinsic brand preference) falls below the industry average, incompatibility damages its market share.
We contribute theoretically and substantively to the literature on cross-category purchases of durable goods. Our model advances the literature by endogenizing purchase quantity of add-ons and allowing consumers to consider their inventory of the add-ons when making brand/standard choice decisions. Built at the standard level, our model is the first to allow forward-planning consumers to consider the enhanced consumption value that increases with the number of add-on products at possession and the financial cost of replacing them if she chose to switch to an incompatible base product., Substantively, our results reveal interesting brand level asymmetric competition patterns that can explain the puzzle that high price/low quality products receive high demand. Moreover, our policy simulations offer insights on how compatibility constraints affect consumer demand and firm pricing strategies.
1.2
Literature Review
Our paper stems from three streams of literature: durable goods adoption and replacement decision-making; multi-category purchase analysis; and compatibility. Recent years have seen an increase in research on empirical examination of durable goods adoption and replacement decision-making. This stream of research focuses on how consumers take the price and quality evolvement process into account to make long-term purchase decisions. For example, Melnikov (2013) constructs a dynamic model that describes consumers' adoption of differentiated durable products as an optimal stopping problem and finds evidence of forward-looking behavior. Song and Chintagunta (2003) and Gowrisankaran and Rysman (2012) further incorporate consumer heterogeneity. Nair (2007) studies the optimal pricing strategy for a firm to sell video-games to forward-looking consumers who strategically delay purchases to benefit from lower prices in the future. Gordon (2009) models both product adoption and replacement process. However, this stream of research focuses on a single product category and does not examine multi-category purchases.
There also have emerged a few papers investigating the complementarity relationship between products in different categories. Seetharaman et al. (2005) provides an excellent review of models of multi-category choice behavior, including three outcomes: purchase
incidence, brand choice, and quantity consideration. Sriram, Chintagunta and Agarwal (2009), Gentzkow (2007) as well as Liu, Chintagunta and Zhu (2010) present a framework to measure the complementarity effect which is the additional per-period utility derived from owning products of both categories. Hartmann and Nair (2010) study how expectations about the future prices of the aftermarket goods influence initial purchase of the primary good. Though recognizing the complementary relationship between base products and their add-ons, these models use a time-invariant constant term to capture the relationship, not fully capturing the dynamic (especially inventory) impact of one category on the other. In contrast, our paper not only relaxes the assumption that all the add-ons in inventory will be discarded, but also allows the add-on-to-base effect to vary across standard. These model advancements allow us to investigate how previous investment in add-ons affects a consumer replacement choice of base products that are of different standards.
Finally, our paper is related to the literature on the compatibility problem of base products and add-ons. Standard economics literature, mostly analytical works, claims that if products are incompatible, cost of switchings bind customers to vendors. Such cost of switchings not only involve direct efficiency losses but also soften competition and magnify incumbency advantages (see Farrell and Klemperer (2005) for a review). Therefore, consumers as well as economists favor compatibility, or in other words standardization (see Farrell and Simcoe (2012) for benefits of compatibility). However, on the supply side, firms have incentives to create incompatibility constraints. Matutes and Regibeau (1988) used a “mix and match” model to show that compatibility leads to higher pricing. Katz and Shapiro (1985) found that firms with good reputations or large existing networks tend to be against compatibility while firms with weak reputation tended to favor product compatibility. Focusing on the supply side, these models have a simplistic specification of consumer
demand hence they are not able to capture consumers’ dynamic decision making process.4
Our paper takes a different approach and focuses on the rich characterization of consumers’ inter-temporal tradeoffs. Additionally, our policy simulations reinforce and extend the findings in this analytical literature.
1.3
Industry Background and Data Description
1.3.1 Digital Camera and Memory Card Industries
Since 1994, the digital camera industry has seen constant technology improvements: higher pixel counts, larger sensors, shorter shutter lag, smaller and lighter bodies, and more optical zoom options. The market also saw a substantial increase in models and brands, with Canon, Casio, Fujifilm, Kodak, Nikon, Olympus, and Sony as the leading players. As digital cameras began taking higher quality pictures, consumers demanded larger memory devices to store photos. It was in this memory card territory that competition increased; manufactures
developed multiple standards to take advantage of the exclusivity benefit of incompatibility. Table 1 is the adoption timeline of memory cards for different manufacturers.
Table 1 Memory Card Timeline5
Std. 1(SON) Std. 2(OLY/FUJ) Std. 3(KOD/CAN/HP/NIK)
1996 PCMCIA 1997 1998 DISK SM CF 1999 DISK/MS 2000 MS 2001 CF/SD 2002 SM/XD SD 2003 XD 2004
As shown in Table 1, accompanying Sony’s first digital camera was a 3.5” floppy disk storage device. The desire for smaller cards led Sony to invest R&D resources to create its own memory card format, the Memory Stick, which was launched in October 1998. After its introduction, from 1999 to 2001, Memory Stick embraced a market expansion from 7% to
25%.6 Meanwhile, from 1998 to 2004, the market share of Sony's cameras increased from 17%
to 23%.7 Since then, Sony has been using its proprietary standard and its extensions, such as
Memory Stick PRO, Memory Stick Duo, and Memory Stick PRO Duo as its compatible storage device.
Olympus and Fujifilm, on the other hand, employed SmartMedia cards for their first few cameras and in July 2002, they jointly invented another standard, the xD card,8 as the
primary storage device to compete with Sony.
The success of the Sony Memory Stick also motivated SanDisk, Matsushita, and
Toshiba to develop and market the SD (Secure Digital) memory card.9 Early samples of the
SD card became available in the first quarter of 2000. Later, in March 2003, SanDisk Corporation announced the introduction of the miniSD, a variant of the original SD Card. Because SD cards are ultra-compact, reliable, interoperable, and easy to use, many of leading digital camera manufacturers, including Canon, Kodak, Nikon, and HP, all of which originally used the CompactFlash card format, switched to SD cards in their consumer product lines in 2002.
5DISK: 3.5 floppy disk, MS: Memory Stick, SM: SmartMedia card, XD: xD card, CF: CompactFlash, SD: SD card 6 http://news.cnet.com/2100-1040-268460.html
7 http://www.pcworld.com/article/114711/sony_unveils_digicams_photo_printer.html 8 http://en.wikipedia.org/wiki/XD-Picture_Card
To summarize, we categorize memory cards into three standards.10 Disk and
Memory Stick (MS) are labeled as “Standard 1” and only Sony cameras are compatible with the Standard 1 cards. SmartMedia cards (SM) and xD cards (XD) are grouped as “Standard 2” with Olympus and Fujifilm cameras compatible with Standard 2 cards. CompactFlash (CF) and SD cards are called “Standard 3” cards with Kodak, Canon, HP, and Nikon cameras all adopting Standard 3 memory cards. We are going to use Standard 1, 2 and 3 in the Model section (section 1.4) to avoid confusion.
1.3.2 Data Description
The data is an individual level scanner panel provided by an anonymous major electronic retailer in the United States. Our sample consists of the complete purchase records of 828 randomly selected households that purchased at least one camera in six years, from December 1998 to November 2004. The transaction record includes detailed information about purchases of products, such as brand name, product type, price paid, time and location of purchases. In addition, we collect information on digital cameras at the brand level from a camera database website that tracks detailed information of all camera models.11
The quality information on memory cards is obtained from annual reports of major memory card manufacturers at the standard level.12 Following Song and Chintagunta (2003), we use
effective pixels (in megapixels) as a proxy of camera quality because it is the most important factor in determining the performance. The quality of a memory card is measured by capacity (in megabytes). One limitation of the data is that we only know brand information, rather than product specifications such as the model name of each camera and the size of each memory card. Therefore we calculate the average quality of a brand from all models on the market and use this as a proxy. We assume no introduction of new formats and hence the choice set of consumers is identical during our observation period.
Table 2A. Summary of Purchase Incidences of Cameras and Memory Cards
Camera Purchases Memory Purchases
Brand Frequency Percentage Standard Frequency Percentage
Sony 295 27.86% 1 (Sony) 309 29.63%
Olympus 172 16.24% 2 (Olympus, Fuji) 241 23.11%
Fuji 81 7.65% 3 (Kodak, Canon, HP, Nikon) 493 47.27%
Kodak 212 20.02%
Canon 114 10.76%
HP 89 8.40%
10 We are able to group two formats (for example, Disk and Memory Stick) as the same standard because when the new
Memory Stick was launched, Sony’s cameras were designed to use both formats (e.g. Sony’s Cyber-shot DSC-D700). Moreover, adapters existed to transfer data from both formats of memory cards to the computer. In the case of Sony, although there were constantly new introductions (later versions of Memory Stick) to the market, i.e. Memory Stick Select and Memory Stick Pro, most devices that use the original Memory Sticks support both the original and PRO Sticks since both formats have identical form factors10.
11 www.dpreview.com/products 12 www.dpreview.com/products
Nikon 96 9.07%
Table 2B. Total Purchase Incidences
Camera\Memory 0 1 2 3 4 5 Total 1 17 621 56 5 3 0 702 2.05% 75.00% 6.76% 0.60% 0.36% 0.00% 84.78% 2 11 8 6 2 0 0 27 1.33% 0.97% 0.72% 0.24% 0.00% 0.00% 3.26% 3 4 10 26 47 5 1 93 0.48% 1.21% 3.14% 5.68% 0.60% 0.12% 11.23% 4 0 0 0 0 1 5 6 0.00% 0.00% 0.00% 0.00% 0.12% 0.60% 0.72% Total 32 639 88 54 9 6 828 3.86% 77.17% 10.63% 6.52% 1.09% 0.72% 100.00%
Table 2C. Summary Statistics of Price and Quality
Sony Olympus Fuji Kodak Canon HP Nikon M 1 M 2 M 3
Price 521.577 429.172 339.028 387.213 504.043 256.239 342.537 65.182 72.989 62.230
Quality 3.898 3.895 3.547 3.889 4.082 3.316 4.444 3.058 2.900 3.089
We prepare the data in the time frequency of a quarter because consumers seldom purchase cameras and memory cards more frequently than that. During the six-year sample period, the 828 households made 1059 transactions of cameras and 1043 purchases of memory cards. Table 2A presents market shares of different brands of cameras and memory cards. In the digital camera market, Sony had the largest market share of 27.86%. Olympus and Fujifilm together took up 23.89%, and left the remaining 48.15% to other brands. Consistently, Standard 1 memory cards (compatible with Sony cameras) had a market share of 29.63%, Standard 2 memory cards (compatible with Olympus and Fujifilm cameras) had a market share of 23.11% and Standard 3 memory cards (compatible with Kodak, Canon, HP, and Nikon cameras) occupied 47.27%.
Table 2B reports the total purchase incidences for 828 consumers. 15.22% of consumers had replaced cameras while 84.78% of consumers purchased one camera; 18.97% of consumers purchased more than one memory card. The maximum number of camera purchase incidences is three and the maximum number of memory card purchase incidences is four. These numbers are consistent with the nature of cameras and memory cards as durable goods.
Table 2C reports the summary statistics of price and quality information. On average, the price of the Sony cameras is the highest and that of the HP cameras is the lowest. Interestingly, the quality measure is not quite aligned with price as Nikon, rather than Sony, has the highest average quality. For memory card, Standard 2 is the highest priced with lowest average quality while Standard 3 charges the lowest price with the highest average
quality. The misalignment of price and quality triggers our interest to investigate their impacts on sales.
Figures 1A and 1B. Original Price Trend of Camera and Memory Card by Quarter
Figure 1A and 1B exhibit the price trend of cameras and memory cards. We find that the price of Sony cameras decreased over time. Prices of Olympus and Fujifilm cameras increased in 2000 and 2001 and then decreased for the rest of the sample periods. Prices of Kodak, Cannon, Nikon and HP decreased at the beginning and stabilized (or slightly increased for Kodak) later on. In terms of memory cards, standard 1 almost always had the highest price except after 2002, when the price of standard 2 caught up. Standard 3 charged a lower price than standard 2 after the second quarter of 2002 and stayed with the lowest price among the three standards.
Figure 2A and 2B show the corresponding quality trend of camera and memory card. During our sample period, technology improved dramatically and all products saw a significant quality upgrade. Interestingly, there’s no clear quality differentiation among brands of cameras, in other words, no brand had the dominating quality position throughout time. In addition, although Sony set a relatively high price in both the camera and memory card market, it doesn’t have clear quality advantage over its competitors. Recall that Table 2A reveals Sony as the camera market leader, which cannot be explained by Sony’s high price and low quality. This intriguing puzzle motivates us to investigate the dynamic impact
of add-on products on a consumer’s choice of base products by modeling the micro-foundations of consumer decisions.
1.3.3 Model Free Evidence of Cross-Category Inter-temporal Dependence Cross-Category Price/Quality Effect
Figures 3A and 3B. Purchase Incidences and Price (Adj. by Quality) Trend of Camera by
Quarter
Figures 4A and 4B. Purchase Incidences and Price (Adjusted by Quality) Trend of Memory Card by Quarter
For technology goods like cameras and memory cards, prices highly depend on features of the model. Prices alone don’t provide the true nature of the product, thus we need to use quality-adjusted price. Figure 3A illustrates how demand of cameras evolved over time whereas Figure 3B shows the quality-adjusted price trends for each camera brand. We also present demand and quality-adjusted price trends of memory cards in Figures 4A and 4B. There are two interesting findings to note from these figures.
First, the price gap between Sony and most Standard 3 cameras became smaller over time--Sony’s price fell over the entire time period whereas Canon’s fell at the beginning but slightly increased for the remainder of the data period when it became higher than Sony’s price. Yet, Canon’s sales of cameras increased faster than those of Sony’s. So price of the camera market alone cannot explain the demand pattern. But when we look at the memory card market, Standard 3 always charged the lowest price. We conjecture that it’s because when making a purchase decision of cameras, consumers not only consider price/quality of cameras but also the add-on, memory cards. Lower future prices of memory cards decrease the total financial cost for consumers and become the driver of consumers’ choice of cameras.
Second, although Olympus and Fuji cut camera price aggressively after the second half of 2002, it did not help save their camera sales. Perhaps such a limited response is a consequence of the price of memory cards compatible with their cameras rising and of forward-planning customers realizing the long-term financial burden of having such a bundle of products.
The above two points provide some evidence for a “cross-category dynamic price effect”. More specifically, if consumers anticipate the price of future add-on products as rising, they will switch brands in the base product category to minimize the total financial burden of the product portfolio.
Add-on-to-base Effect (Cross-category Dynamic Inventory Effect)
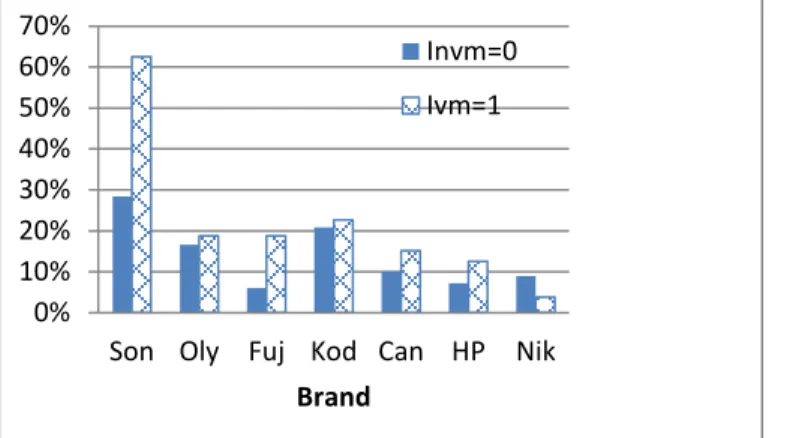
Figure 5. Percentage of Camera Purchases at Memory Card Inventory at 0 vs. 1
Recall that in section 1.3.2, we discovered a puzzle about Sony’s high market share versus high price and low quality. We conjecture that in addition to the above memory card price effect on camera purchase incidence, perhaps inventory of memory cards also plays an important role in camera purchases, what we call the “add-on-to-base effect”. We assume memory cards do not become obsolete, and with this a consumer who owns a memory card should be more reluctant to switch to a camera that is incompatible with her existing stock of memory inventory. On the other hand, a consumer who has zero stock of memory card inventory is not “locked-in” to a particular camera brand. Figure 5 illustrates the purchase incidences for each camera brand conditional on consumer inventory levels of compatible memory cards. We see that for all camera brands, purchase incidence increases as the inventory level of compatible memory card increase. This is particularly true for Sony: it appears that a Sony consumer is locked-in and perhaps faces higher cost of switchings or add-on-to-base effects associated with existing memory card inventory than consumers who own other standards.
In summary, the data pattern shows the cross-category inter-temporal interdependence between purchases of base and add-on products. It is evident that forward-planning consumers take into account the price/quality of add-ons as well as financial implications of discarding their existing add-ons when comparing long-term utilities of
0% 10% 20% 30% 40% 50% 60% 70%
Son Oly Fuj Kod Can HP Nik
Brand
Invm=0 Ivm=1
alternative choice sequences. In the next session, we develop a model to explicitly describe this decision process.
1.4
Model
Consumer purchase behavior of high-tech and durable goods is distinguished from that of consumer package goods on several fronts. Existing literature has established that prices of technology products decline while qualities improve over time. Accordingly, our model of consumer adoption of products accounts for the fact consumers anticipate these future price and quality trajectories while deciding when to purchase. Moreover, since base products are durable in nature and add-on products can be purchased subsequently, consumers tend to look into the future when making purchasing decisions (Nair, Chintagunta and Dube 2004, Derdenger and Kumar 2013). The forward-looking behavior of consumers and the issue of compatibility between camera and memory cards, imply that a consumer's decision of purchasing the base product depends on the anticipated purchase(s) of the add-on products. Therefore, the purchase decision for the base product would depend not only on the expected price and quality trajectories of that product, but also on the anticipated price and quality of the add-on product. To approximate a consumer’s decision process that accounts for the above characteristics, we develop a model of consumers’ joint purchase (adoption and replacement) decisions of base and add-on products as a dynamic optimization problem under price and quality uncertainty.
1.4.1 Assumption
In light of the data on hand and the specific industry we study, we make several assumptions regarding consumer behavior for model parsimony. First, we assume consumers can buy only at the focal store. This assumption may seem quite restrictive as consumers may often purchase at several electronic stores. However, this concern is mitigated in our sample for several reasons. One, all households are holders of loyalty cards of the store so they are frequent buyers in the store. Two, the focal store offers a “low-price guarantee” that will beat any price from a local store stocking the same item. This highly competitive pricing strategy provides a large disincentive for these loyal consumers to purchase at rival stores. Three, we delete households that only purchased memory cards from the store. These consumers are more likely to purchase from multiple stores rather than only one. Lastly, our observed data pattern from this store is representative of the industry average (See Appendix A1.3). For example, we observe a camera replacement cycle of 4.67 years while the industry average is 4.30 years with a standard deviation of 2.28 years. Above all, we acknowledge the data limitation and only claim that we provide insight on loyal consumers' brand and standard choice behavior within a store. Store competition is beyond our scope of this research. Our second assumption treats a consumer who buys multiple memory cards on a single trip as only one purchase incidence. This assumption is reasonable because only a very small portion (0.6%) of the purchases in our sample involves
multiple items.13 Third, we assume there is no resale market for cameras and a discarded
camera cannot be exchanged for its residual value. This implicitly assumes consumers only derive utility from their most recently purchased camera. Finally, we assume that consumers keep all memory cards i.e. memory cards are accumulated not replaced. Past research of durable good replacement purchases ignores the quantity of memory card in inventory, which is equivalent to assuming consumers discard all the add-on products that they purchased before and ignore them when making decisions on base product replacement choices (it is fine if they do not study standard choice). In contrast, we relax the assumption and allow inventory to be cumulative. We rely on the estimated coefficient (𝛾 to be explained later) to tell us the extent to which the memory cards in inventory affect consumers’ decision to buy a new camera.
1.4.2 Consumer Choices and Flow Utility
Our model follows the large literature pertaining to choice models (Guadagni and Little 1983). The per-period utility for consumer 𝑖 (𝑖 = 1,2, … , 𝐼) who makes purchase decisions of both the base product (camera of brand 𝑐) and the add-on (memory card of standard 𝑚) jointly at time period 𝑡 (𝑡 = 1,2, . . , 𝑇) can be decomposed into a deterministic part 𝑈̅𝑖𝑡𝑐,𝑚 and an idiosyncratic error term 𝜀𝑖𝑡𝑐,𝑚.
𝑈𝑖𝑡𝑐,𝑚 = 𝑈̅𝑖𝑡𝑐,𝑚+ 𝜀𝑖𝑡𝑐,𝑚 (1)
The deterministic part of the per-period utility 𝑈̅𝑖𝑡𝑐,𝑚 has three elements 1) consumption utility from using the camera (with the internal memory or small external memory card that comes with the camera purchase) 2) enhanced consumption utility that is associated with the additional number of add-ons, and 3) cost of purchasing/replacing the products. We adopt an additive utility specification which follows a large body of literature of complementary good14 and multi-category purchases15. We also conduct robustness test with other utility
specifications, like multiplicative utility. These alternative utility functions and estimation results are exhibited in Appendix A1.4.
So in specific, 𝑈̅𝑖𝑡𝑐,𝑚 = 𝑈⏟𝑖𝑡𝑐 𝑐𝑎𝑚𝑒𝑟𝑎 𝑐𝑜𝑛𝑠𝑢𝑚𝑝𝑡𝑖𝑜𝑛 + 𝑈⏟ 𝑖𝑡𝑚∗ 𝐼(𝑐~𝑚) 𝑚𝑒𝑚𝑜𝑟𝑦 𝑐𝑜𝑛𝑠𝑢𝑚𝑝𝑡𝑖𝑜𝑛 − 𝜆𝑖 ∗ (𝑃𝐶𝑡𝑐 + 𝑃𝑀 𝑡𝑚) ⏟ 𝑓𝑖𝑛𝑎𝑛𝑐𝑖𝑎𝑙 𝑐𝑜𝑠𝑡 (2)
1) Consumption Utility of Camera
13 When multiple memory cards are bought, we treat each item as a separate purchase incidence. The state variable,
inventory of the memory cards is cumulated by the number of items bought. We delete the consumer who purchased multiple cameras because this might be a case of several family members adopt together. We only examine the behavior of an individual consumer.
14 Cheng and Nahm 2007, Chen and Nalebuff 2006, Nair, Chintagunta and Dube 2004, Lee 2013, Derdenger and Kumar
2013, Derdenger 2014.
15 Sriram, Chintagunta and Agarwal 2009 and Liu, Chintagunta and Zhu 2010, Manchanda et al. 1999, Seetharaman et al.
1999, Russell and Petersen 2000, Chung and Rao 2003, Wedel and Zhang 2004, Seetharaman et al. 2005, Song and Chintagunta 2006, Gentzkow 2007.
Since most camera models have internal memories1 with an average size of 16.2 MB
or come with a free small-size (for example 16 MB1) memory card at the time of the
purchase, the cameras can function by themselves.
𝑈𝑖𝑡𝑐 = 𝛼𝑖𝑐 + 𝜙𝑖𝑄𝐶𝑡𝑐 + 𝑆𝐷𝑖 ∗ 𝐼(𝑐 = 𝑐) (3)
As shown in equation (3), the consumption utility of camera (𝑈𝑖𝑡𝑐) is summarized by
the brand-specific constant (𝛼𝑖𝑐), quality (𝜙
𝑖𝑄𝐶𝑡𝑐) and state dependence (𝑆𝐷𝑖∗ 𝐼(𝑐 = 𝑐)).
The first term 𝛼𝑖𝑐 is the brand-specific fixed effect, which represents a persistent form of
product differentiation that captures the household’s intrinsic brand preferences of camera brand 𝑐. The second term 𝑄𝐶𝑡𝑐 is the quality of the camera 𝑐 at its purchase time 𝑡. Quality
is measured by megapixels as in Song and Chintagunta (2003). The coefficient 𝜙𝑖 is the
marginal utility for a single unit of quality increment. If 𝜙𝑖 > 0, a consumer obtains higher
utility from a high quality product than from a low quality product. The next term 𝑆𝐷𝑖 ∗
𝐼(𝑐 = 𝑐) denotes state dependence (Dubé, Hitsch and Rossi 2010), that is if the consumer considers purchasing a camera (brand 𝑐) of the same brand as the one she already owns (brand 𝑐), she can receive an extra utility 𝑆𝐷𝑖 compared to other brand choices. If 𝑆𝐷𝑖 > 0,
then the model predicts persistency in camera brand choices. More specifically, if a household adopts brand 𝑐, the probability of a repeat purchase of brand 𝑐 is higher than prior to this purchase: the conditional choice probability of repeat-purchasing exceeds the marginal choice probability. There could be different behavioral mechanisms that generate state dependence. One is that consumers have become loyal to the brand because of their past user experiences, thus incurring a psychological cost of switching to choose other brands. Or a consumer is going through a learning process that she finds high match value from the brand. The purpose of this paper is not trying to differentiate these explanations. We will simply capture the “state dependence” effect as it is.
2) Consumption Utility of Add-on Memory Cards
The add-on memory cards refer to the additional memory cards that do not come with the camera. These additional memory cards enhance the utility of the camera by adding more storage space, offering flexibility of taking more and larger size (more pixels) pictures (e.g. on a trip), shooting videos, decreasing the frequency of transferring pictures to computers, hedging failure of other memory cards, etc. It is the additional investment on add-ons that does not come with the base product camera.
Note that add-on products only provide consumption value to the compatible base
product. The indicator 𝐼(𝑐~𝑚) in equation (2) denotes that only compatible memory cards
can enhance the utility of a camera. From the data description section (section 1.3.2) we
know that (𝑐 = 1)~(𝑚 = 1)16; (𝑐 = 2,3)~(𝑚 = 2); (𝑐 = 4,5,6,7)~(𝑚 = 3).
𝑈𝑖𝑡𝑚 = 𝑢⏟𝑖𝑡𝑚 𝑛𝑒𝑤 𝑝𝑢𝑟𝑐ℎ𝑎𝑠𝑒 + 𝛾𝑖𝑚∗ 𝑢⏟ 𝑖𝑡𝐼𝑁𝑉𝑀 𝑖𝑛𝑣𝑒𝑛𝑡𝑜𝑟𝑦 𝑢𝑖𝑡𝑚 = 𝜃𝑖𝑚+ 𝜓𝑖 ∗ 𝑄𝑀𝑡𝑚 𝑢𝑖𝑡𝐼𝑁𝑉𝑀 = ∑ 𝑢 𝑖𝑃𝑇𝑘 𝑚 𝐼𝑁𝑉𝑀𝑖𝑡−1𝑚 𝑘=1 (4) (4-1) (4-2)
According to our assumption, consumption utility from the memory card (𝑈𝑖𝑡𝑚) includes the utility of the currently purchased memory card (𝑢𝑖𝑡𝑚) as well as utility from all
memory cards in inventory (𝑢𝑖𝑡𝐼𝑁𝑉𝑀), as shown in equation (4). (The coefficient 𝛾𝑖𝑚is going to be explained later in Case 1.) For a newly purchased memory card of standard 𝑚, the consumption utility (equation 4-1) is summarized by 𝜃𝑖𝑚, the standard-specific fixed effect and quality, 𝑄𝑀𝑡𝑚, measured by megabytes. The coefficient 𝜓
𝑖 is consumer 𝑖’s sensitivity to
memory card quality or storage capacity. Utility of memory cards in inventory (equation 4-2) sums the consumption utility of each item 𝑘 from 1 to 𝐼𝑁𝑉𝑀𝑖𝑡−1𝑚 , the total number of
memory cards (standard 𝑚) purchased by consumer 𝑖 up to 𝑡 − 1. Note that we don’t allow depreciation, but with quality 𝑄𝑀𝑃𝑇𝑚𝑘 being associated with the purchase time 𝑃𝑇
𝑘, memory
cards purchased prior to period t naturally provide less utility compared to a current card due to the lower quality in the past.
3) Cost of Purchasing
Finally, the cost of purchasing is the sum of 𝑃𝐶𝑡𝑐, price for camera of brand 𝑐, and
𝑃𝑀𝑡𝑚, the price for memory card of standard 𝑚., The coefficient 𝜆
𝑖 is the price sensitivity.
We allow consumers to choose from multiple brands of cameras (𝑐 ∈
{0,1,2, … , 𝐶})and multiple standards of memory cards 𝑚 ∈ {0,1,2, … , 𝑀} where 0 denotes
no purchase, and 𝐶/𝑀 is the total number of camera brands/memory card standards. In our
data, 𝑐 = 1,2,3,4,5,6,7 represents Sony, Olympus, Fujifilm, Kodak, Canon, HP and Nikon
respectively while 𝑚 = 1,2,3 corresponds to Standard 1 (Memory Stick), Standard 2 (SmartMedia/xD card), Standard 3 (CompactFlash/SD card) respectively. Thus, during each time period, a consumer faces altogether 18 choice alternatives,17 which can be classified into
four types of choice alternatives: (1) purchase (adopt or replace) only a camera of brand 𝑐, (2) purchase only a memory card of standard 𝑚 , (3) purchase one camera and one memory card together and (4) purchase neither product.
Case 1: Purchase Camera Only
When the consumer only purchases a camera but no memory cards, she obtains consumption utility from the camera and pays for the purchase. In addition, she obtains enhanced utility associated with the compatible add-ons in inventory. So for 𝑐 ∈ {1,2, … , 𝐶}
𝑈̅𝑖𝑡𝑐,0= 𝑈⏟𝑖𝑡𝑐 𝑐𝑎𝑚𝑒𝑟𝑎 𝑐𝑜𝑛𝑠𝑢𝑚𝑝𝑡𝑖𝑜𝑛 + 𝛾𝑖𝑚∗ 𝑢 𝑖𝑡 𝐼𝑁𝑉𝑀∗ 𝐼(𝑐~𝑚) ⏟ 𝑚𝑒𝑚𝑜𝑟𝑦 𝑐𝑜𝑛𝑠𝑢𝑚𝑝𝑡𝑖𝑜𝑛(𝑖𝑛𝑣𝑒𝑛𝑡𝑜𝑟𝑦) − 𝜆⏟ 𝑖 ∗ 𝑃𝐶𝑡𝑐18 𝑓𝑖𝑛𝑎𝑛𝑐𝑖𝑎𝑙 𝑐𝑜𝑠𝑡 (5)
As you can see from the second term in equation (5), the more memory cards (larger
𝐼𝑁𝑉𝑀𝑖𝑡𝑚) a consumer has, and/or the better quality the memory cards (larger 𝑄𝑀
𝑃𝑇𝑘
𝑚 ) are,
the higher the utility a consumer can derive from the inventory. A positive coefficient 𝛾𝑖𝑚 corresponds to memory cards in inventory having an impact on a consumer’s decision to purchase a new camera. We call this effect the “add-on-to-base effect” which links a consumer purchase decision of a camera and that of memory cards into a single framework, i.e., a forward-looking consumer who makes a purchase decision of a camera at time t will consider not only the extra utility generated by the compatible memory cards in inventory, but also the effect of future price and quality of the memory cards. Without this term, the purchase decisions of the two categories will be separated. Note however, if a consumer chooses a camera that is incompatible with the memory cards in inventory, she cannot continue deriving utilities from these memory cards. She instead loses the utility provided by these memory cards and must re-invest on more memory cards to enhance the consumption value of the camera in the future.
Fundamentally different from existing literature on cross-category purchases of durable goods, our approach allows us to investigate the dynamic and interdependent consumer decision process: First, we recognize the compatibility at the brand (for camera) and standard level (for memory cards). This allows us to study how brand choices of base products are driven by past, current, and future choices of standard of the add-on products. Second, we allow the on-to-base effect to depend on the number and quality of the add-on products owned. Therefore, the add-add-on-to-base effect can vary across time and affect the inter-temporal decision-making of forward-looking consumers--since the more compatible memory cards that are accumulated, the higher the per-period add-on-to-base effect. This implies that the accumulation of add-on products creates a higher cost of switching for consumers to abandon the compatible base product. Note that our definition of the add-on-to base effect is consistent with the literature that recognizes complementarity between product categories (Sriram, Chintagunta and Agarwal (2009) and Liu, Chintagunta and Zhu (2010)). However, previous models define the complementary term as time-invariant and only at the category level. We advance the literature by making it time varying and standard specific. In specific, the add-on-to-base effect coefficient (𝛾𝑚) is standard specific
(superscript 𝑚). This supports our model free evidence in section 1.3.3 that the effect of inventory of memory cards on camera purchases varies for different standards of memory
18 When there’s no purchase of memory card, the consumption utility from new purchase is zero. Besides, 𝑃𝑀𝑡0= 0, the
cards. We hope to compare the magnitude of different add-on-to-base effects in order to explain the observed data pattern and conduct meaningful counterfactual analysis.
Case 2: Purchase Memory Only
When a consumer buys only a memory card, she must have owned a compatible camera. So her utility originates from consumption utility of using the camera in inventory and enhanced utility that comes from the additional purchases of memory cards net the cost of purchasing. So for 𝑚 = 1,2,3 the utility function takes the form
𝑈̅𝑖𝑡0,𝑚 = 𝑈⏟𝑖𝑡𝑐 𝑐𝑎𝑚𝑒𝑟𝑎 𝑐𝑜𝑛𝑠𝑢𝑚𝑝𝑡𝑖𝑜𝑛 + ( 𝑢⏟𝑖𝑡𝑚 𝑛𝑒𝑤 𝑝𝑢𝑟𝑐ℎ𝑎𝑠𝑒 + 𝛾𝑖𝑚∗ 𝑢⏟ 𝑖𝑡𝐼𝑁𝑉𝑀 𝑖𝑛𝑣𝑒𝑛𝑡𝑜𝑟𝑦 ) ∗ 𝐼(𝑐~𝑚) ⏟ 𝑚𝑒𝑚𝑜𝑟𝑦 𝑐𝑜𝑛𝑠𝑢𝑚𝑝𝑡𝑖𝑜𝑛 − 𝜆⏟ 𝑖 ∗ 𝑃𝑀𝑡𝑚19 𝑓𝑖𝑛𝑎𝑛𝑐𝑖𝑎𝑙 𝑐𝑜𝑠𝑡 (6)
where 𝑐 is the brand of the camera in inventory. Note that when the consumer only purchases the memory card, she will definitely pick the standard that is compatible with the camera in inventory (𝐼(𝑐~𝑚) = 1) because other memory card standards cannot be used with the camera at hand.
Case 3: Camera & Memory
When a consumer simultaneously purchases camera 𝑐(> 0) and memory card 𝑚(> 0), they must be compatible (no consumer purchased incompatible base product and add-on at the same time in our data).
𝑈̅𝑖𝑡𝑐,𝑚 = 𝑈⏟𝑖𝑡𝑐 𝑐𝑎𝑚𝑒𝑟𝑎 𝑐𝑜𝑛𝑠𝑢𝑚𝑝𝑡𝑖𝑜𝑛 + 𝑈⏟ 𝑖𝑡𝑚∗ 𝐼(𝑐~𝑚) 𝑚𝑒𝑚𝑜𝑟𝑦 𝑐𝑜𝑛𝑠𝑢𝑚𝑝𝑡𝑖𝑜𝑛 − 𝜆𝑖 ∗ (𝑃𝐶𝑡𝑐 + 𝑃𝑀 𝑡𝑚) ⏟ 𝑓𝑖𝑛𝑎𝑛𝑐𝑖𝑎𝑙 𝑐𝑜𝑠𝑡 (7)
The utility function is a combination of those in the previous two cases. Case 4: No Purchase
If a consumer does not own a camera and she decides not to make a purchase of any product at time t, we normalize the utility to zero.
𝑈̅𝑖𝑡0,0= 0 .
However, if the consumer owns a camera and decides not to replace it with a new one, she continues to receive utility from the camera and the compatible memory cards in inventory (if there is any) without paying additional cost. Thus, the utility function has two components: possession of a camera 𝑐, and the add-on-to-base effect provided by inventory of compatible memory cards.
𝑈̅𝑖𝑡0,0= 𝑈⏟𝑖𝑡𝑐
𝑐𝑎𝑚𝑒𝑟𝑎 𝑐𝑜𝑛𝑠𝑢𝑚𝑝𝑡𝑖𝑜𝑛
+ 𝛾⏟ 𝑖𝑚∗ 𝑢𝑖𝑡𝐼𝑁𝑉𝑀∗ 𝐼(𝑐~𝑚)
𝑚𝑒𝑚𝑜𝑟𝑦 𝑐𝑜𝑛𝑠𝑢𝑚𝑝𝑡𝑖𝑜𝑛(𝑖𝑛𝑣𝑒𝑛𝑡𝑜𝑟𝑦) (8)
1.4.3 State Transitions Inventory Process
According to our assumptions, a consumer uses only the latest purchased camera. So the camera inventory variable,𝑐, is just an indicator of the brand of camera owned at time 𝑡. When the consumer buys a new camera 𝑐, its inventory switches from 𝑐 to 𝑐. When no camera is purchased at time 𝑡, the inventory remains the same as in the last period. So the inventory process for cameras is (after dropping the consumer index 𝑖)
𝑐𝑡+1= { 𝑐, 𝑖𝑓 𝐷𝑡
𝑐 , . = 1
𝑐𝑡, 𝑖𝑓 𝐷𝑡𝑐′, . = 0 𝑓𝑜𝑟 𝑎𝑙𝑙 𝑐′ ∈ {1,2, … , 𝐶} (9) where 𝐷𝑡𝑐 , .is the indicator of consumer's choice, with 𝐷𝑡𝑐 , . = 1 denoting the consumer purchasing brand 𝑐 (𝑐 = 1,2,3,4,5,6,7) as the base product and any memory card (including no purchase) as an add-on product. 𝑐𝑡is the beginning camera inventory at time 𝑡.
On the other hand, since memory cards do not become obsolete, the inventory process of memory cards is simply the accumulation of purchased cards over time up to period t. 𝐼𝑁𝑉𝑀𝑡𝑚 = {𝐼𝑁𝑉𝑀𝑡−1𝑚 + 𝐷𝑡. ,𝑚, 𝑖𝑓 ∑ 𝐼𝑁𝑉𝑀𝑡−1𝑘 𝑀 𝑘=1 < 𝐵̅ 𝐼𝑁𝑉𝑀𝑡−1𝑚 , 𝑜𝑡ℎ𝑒𝑟𝑤𝑖𝑠𝑒 (10)
Where 𝐼𝑁𝑉𝑀𝑡−1𝑚 is the ending inventory, total number of memory card 𝑚 at time 𝑡 − 1 and
𝐷𝑡. ,𝑚 is new purchase during period 𝑡. If no purchase is made at time 𝑡, 𝐷𝑡. ,𝑚= 0. This process is in contrast to that of fast-moving packaged goods, for which inventory is the cumulative purchases minus consumption throughout time. Similar to Hartmann & Nair (2010) and Derdenger and Kumar (2013), we restrict the number of memory cards in inventory to be less than 𝐵̅20 to keep the state space for the dynamic problem bounded.
The transition matrix of inventory process from period 𝑡 to period 𝑡+1 for the 18 choice -options is shown in Table A1.2 of Appendix A1.1.