Computational Intelligence Contributions to Readmission Risk
Prediction in Healthcare Systems
by
Arkaitz Artetxe
Submitted to the Department of Computer Science and Artificial Intelligence, in partial
fulfilment of the requirements for the degree of Doctor of Philosophy
PhD Advisors:
Prof. Manuel Graña At The University of the Basque Country
and
Dr. Andoni Beristain At Vicomtech-IK4
Universidad del País Vasco
Euskal Herriko Unibertsitatea
Donostia-San Sebastián
2017
iii
Acknowledgements
Special thanks to my advisor, Prof. Manuel Graña for his experience, support and guidance. Without him this Thesis would not have been possible.
I am also grateful to Dr. Andoni Beristain for his technical collaboration and direction at Vicomtech-IK4.
I would also like to thank to all my workmates and colleagues at Vicomtech-IK4 Research Center who helped me in this task. Eskerrik asko.
v
Computational Intelligence Contributions to Readmission Risk
Prediction in Healthcare Systems
by Arkaitz Artetxe
Submitted to the Department of Computer Science and Artificial Intelligence, in partial fulfilment of the requirements for the degree of Doctor of Philosophy
Abstract
The Thesis tackles the problem of readmission risk prediction in healthcare systems from a machine learning and computational intelligence point of view. Readmission has been recognized as an indicator of healthcare quality with primary economic importance. We examine two specific instances of the problem, the emergency department (ED) admission and heart failure (HF) patient care using anonymized datasets from three institutions to carry real-life computational experiments validating the proposed approaches. The main difficulties posed by this kind of datasets is their high class imbalance ratio, and the lack of informative value of the recorded variables. This thesis reports the results of innovative class balancing approaches and new classification architectures.
Keywords: Readmission, class imbalance, classification, heart failure, machine learning, artificial intelligence
vii
“Nola aldatzen diren gauzak, kamarada.”
ix
Contents
1. Introduction ... 1
1.1. Motivation ... 1
1.1.1. Emergency Department Readmissions ... 2
1.1.2. Heart Failure ... 3
1.2. Thesis Contributions ... 3
1.2.1. On the curation of the experimental datasets ... 4
1.3. Publications ... 5
1.4. Structure of the Thesis ... 9
2. State of the Art... 11
2.1. Predictive Models for Readmission Risk: A Systematic Review ... 11
2.1.1. Research methodology ... 12
2.1.2. Research questions ... 13
2.1.3. Search strategy ... 13
2.1.4. Results ... 15
2.1.5. Discussion ... 22
2.2. Heart Failure readmission risk ... 23
2.2.1. Related Studies ... 24
2.3. Conclusions ... 25
3. Dataset ... 27
3.1. University Hospital of Araba Dataset ... 27
3.2. University of Chile Dataset ... 32
3.2.1. Data pre-processing ... 32
3.2.2. Description ... 32
3.3. Hospital of Basurto Dataset ... 39
3.3.1. Context ... 39
3.3.2. Preprocessing ... 39
3.3.3. Description ... 39
4.1. Class Imbalance ...45 4.1.1. Introduction ...45 4.1.2. Preprocessing ...46 4.1.3. Cost-sensitive learning ...49 4.1.4. Ensemble classifiers ...50 4.2. Feature Selection ...53 4.2.1. Filter Methods ...54 4.2.2. Wrapper methods. ...55 4.2.3. Embedded methods. ...57 4.3. Classification ...58
4.3.1. Definition of the problem ...58
4.3.2. Logistic Regression ...58
4.3.3. Gradient Boosting ...59
4.3.4. Support Vector Machine ...59
4.3.5. Decision Tree ...60
4.3.6. Random Forest ...61
4.3.7. Extreme Learning Machine ...62
4.3.8. Adaptive Hybrid Extreme Rotation Forest (AHREF) ...62
4.3.9. Miscellaneous commonly used classifier learning ...64
5. Results ...67
5.1. Evaluation Metrics ...67
5.2. Experimental Design ...70
5.2.1. Defining the outcome ...70
5.2.2. Validating the model ...72
5.3. Emergency Department Readmission Prediction...75
5.3.1. Hospital Universitario Araba dataset ...75
5.3.2. Chile ED dataset...80
5.4. Heart Failure readmission prediction ...92
5.4.1. Experiment 1: feature selection ...92
5.4.2. Experiment 2 comparison of classifiers upon complete feature set ...97
6. Conclusions ...105
Appendix A. HF patient telemonitoring program ...107
Inclusion-exclusion criteria ...107
Patient profiling ...108
Contents xi Appendix B. Systematic Review ... 111 Bibliography ... 119
xiii
List of Figures
Figure 1.1. Thesis structure ... 8
Figure 2.1. Phases of a systematic review according to [Tranfield2003] ... 12
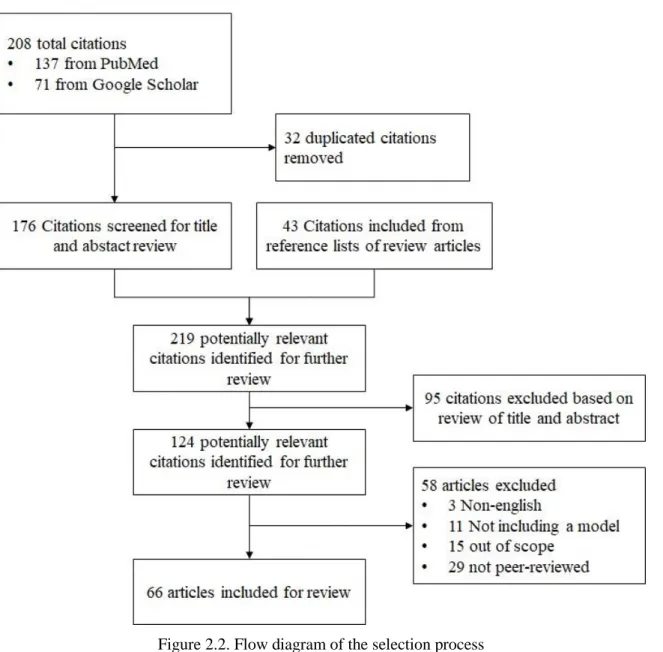
Figure 2.2. Flow diagram of the selection process ... 16
Figure 2.3. Number of publications per year ... 17
Figure 2.4. Taxonomy of data analysis methods ... 18
Figure 2.5. Distribution of methods per type and year (note that years without any publication included in the study are not present) ... 19
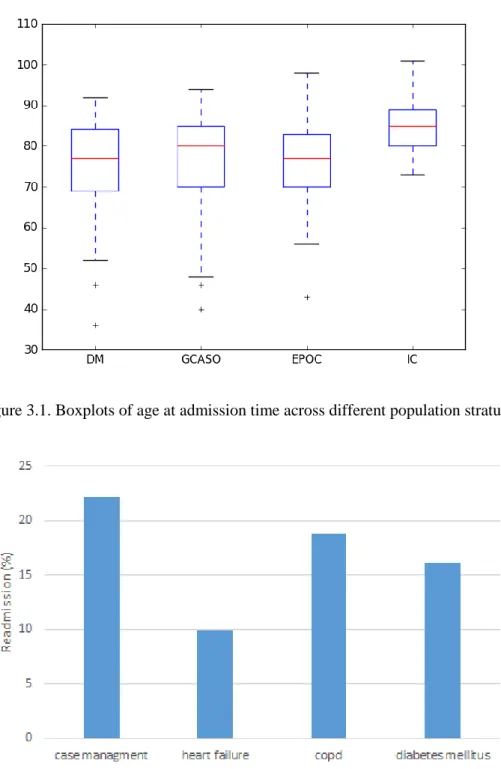
Figure 3.1. Boxplots of age at admission time across different population stratum ... 29
Figure 3.2. Readmission rate across different population stratum ... 29
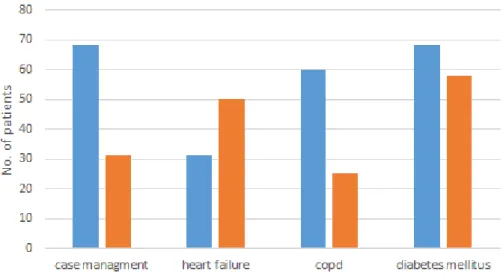
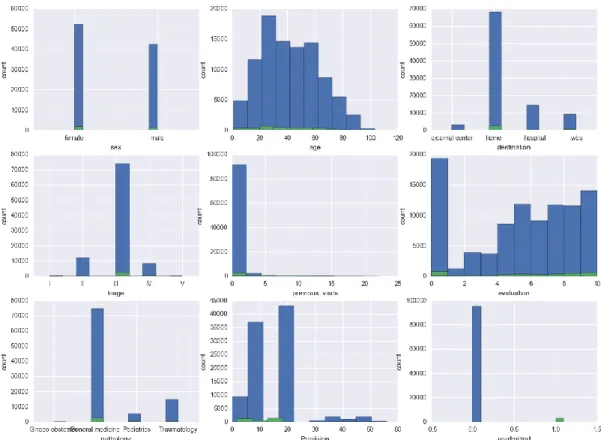
Figure 3.3. Distribution of number of patients per sex in the University Hospital of Araba . 30 Figure 3.4. Distribution of readmission class among different attributes (readmission in green, regular admissions in blue) in the University of Chile dataset. From left to right, top to bottom: sex, age, destination after discharge, triage, previous visits, evaluation, pathology, prevision, and readmission ... 35
Figure 3.5. Histograms of the 20 most common reasons for consultation for a) all admissions, b) non-readmissions and c) readmissions ... 38
Figure 3.6. Distribution of readmission class for different attributes in the Hospital of Basurto (readmission in green, blue otherwise). ... 43
Figure 4.1. Taxonomy of Class imbalance problem addressing techniques extracted from [lopez2013] ... 46
Figure 4.2. Undersampling and oversampling techniques, effect on the sample distribution on a 2D dataset. ... 47
Figure 4.3. Synthetic instance generation with SMOTE [Borovicka2012] ... 49
Figure 4.4. Bagging with resampling ... 52
Figure 4.6. Taxonomy of feature selection techniques according to [Kohavi1997] ...54
Figure 4.7. Filter approach for feature selection ...55
Figure 4.8. Wrapper approach for feature selection ...56
Figure 5.1. Example of a ROC curve. ...69
Figure 5.2. Example precision-recall curve. ...70
Figure 5.3. Hospital readmission event. ...71
Figure 5.4. Different events among patients ...72
Figure 5.5. Flowchart of k-fold cross-validation ...73
Figure 5.6. Flowchart of an example experiment ...74
Figure 5.7. ROC curve for DT using undersampling, RUSBagging and original ...82
Figure 5.8. ROC curve for DT and RF algorithms using RUSBagging method ...82
Figure 5.9. Bagging ensemble with resampling ...87
Figure 5.10. Comparison of ROC curves for different methods with random undersampling ...90
Figure 5.11. AUC versus maximum DT depth. ...90
Figure 5.12. Recall versus maximum DT depth ...91
Figure 5.13. Recall versus number of hidden units in the ELM. ...91
Figure 5.14. Roc curve (SVM + SBS-SVM) ...95
Figure 5.15. ROC curve (RF + SBS-SVM) ...95
Figure 5.16. Scatter plot of the first 2 components of PCA ...98
Figure 5.17. 3D Scatter plot of the first 3 components of PCA ...99
Figure 5.18. AUC comparison for different class distributions ...101
Figure 5.19. ROC plot of different classifiers for an instance of their execution. ...101
Figure 5.20. Performance comparison of Random Forest and SVM classifiers using normal distribution, weighting and resampling (SMOTE) ...103
xv
List of Tables
Table 2.1. Research questions ... 13
Table 2.2. Search strings ... 14
Table 2.4. Class imbalance addressing methods in readmission risk prediction ... 22
Table 3.1. Distribution of variables by category from the University Hospital of Araba ... 28
Table 3.2. Comparative information about the subpopulations of the dataset from the University Hospital of Araba ... 28
Table 3.3. Most significant variables for each population stratum in the University Hospital of Araba dataset according to t-test, extracted from [Besga2015] ... 31
Table 3.4. Statistics of ED admissions from 2013 to 2016. Age mean and standard deviation. Remaining rows give the number of records and the percentage relative to the total Columns correspond to no readmission, readmission, and total number of records. By rows, we give the total number and percentage of the total population of the occurrence of each kind of gender, class of pathology, and triage assigned upon arrival. ... 33
Table 3.5. Distribution of causes of admission and readmission cases. GAP general abdominal pain, 1/3DF up to three days fever; 24HF 24 hours; fever; HA headache; D diarrhoea; T throwing up; EP epigastric pain; LuP lumbar pain; GD general discomfort; LegP leg pain; AD acute dyspnoea. ... 34
Table 3.6. Descriptive statistics of the Hospital of Chile variables ... 36
Table 3.7. Description of the variables in the Hospital of Basurto dataset... 40
Table 3.8. Summary of characteristics and its distribution. Mean and standard deviation is reported for continuous variables and percentage for categorical ones. ... 42
Table 4.1. Cost matrix for binary classification ... 50
Table 5.1. Confusion matrix for a binary classifier ... 68
Table 5.3. Comparative information about the subpopulations of the dataset ...76
Table 5.4. Confusion matrix of SVM on the diabetes mellitus dataset ...76
Table 5.5. Comparison of performance evaluation metrics for RF over original and under-sampled versions of diabetes mellitus dataset ...77
Table 5.6. Performance comparison using SVM and RF classifiers on original and over-sampled datasets ...77
Table 5.7. Performance comparison of both feature selection methods ...78
Table 5.8. Mean ± standard deviation of performance metrics for each data balance ...81
Table 5.9. Accuracy, sensitivity and specificity results (average ± standard deviation) of the ...85
Table 5.10. Comparison of different machine learning methods (mean ± standard deviation) ...88
Table 5.11. Mean accuracy and its standard deviation for each classification algorithm and FS method ...93
Table 5.12. List of variable included in the model by each method and number of times they were selected in the 10 randomized runs ...96
Table 5.13. 10-fold cross-validation of AUC over the different classification algorithms ...99 Table 5.14. ROC AUC scores for SVM and RF classifiers with the original data distribution and distributions after different class imbalance correction procedures (mean+-standard deviation) .100
1
Chapter 1
Introduction
This chapter provides a general introduction to the Thesis, providing a brief presentation of its contents, motivation, supporting publications and structure. It is structured as follows: Section 1.1 presents the main motivations of the Thesis. Section 1.2 summarizes the main methodological and technical contributions. Section 1.3 enumerates the publications obtained during the research associated with this Thesis studies. Finally, Section 1.4 describes the structure of the Thesis.
1.1.
Motivation
The application of predictive analytics techniques in the medical and clinical practice is gaining momentum because they can improve healthcare in several ways [Mortazavi2016]. Specifically, risk prediction models are widely used to predict the level of risk of individual patients or patient groups for different types of diseases and populations. Those models facilitate the identification of patients potentially at high risk so that resources can be used more efficiently in terms of cost-benefit.
In hospitals inside public and private healthcare service networks, there is a growing concern on the quality and sustainability of the service. Readmission events, defined as returning admissions to a hospital after a short time (below some specified threshold) after discharge from hospital, are widely recognized as healthcare quality indicators. Readmission threshold is a matter of political choice. Readmissions are costly events that impose tremendous burden on patients and on healthcare systems [Wallmann2013, Dharmarajan2013]. Preventable readmissions are related to suboptimal care during hospitalization and poor management of the discharge process [Swain2015, Balla2008]. Thus, hospital readmissions are becoming a strong concern of hospitals and policy makers as a measure of the quality of given care and have been adopted by many organizations as quality indicators [Baillie2013]. Centres of Medicare and Medicaid Services
(CMS) in the USA [CMS2011] and policy makers in UK [Kmietowicz2010] have introduced financial penalties to hospitals with high readmission rates by reducing the payment of patients readmitted within 30-day of discharge. This is a widely-used readmission threshold, but there are some studies where they use 28 days [Betihavas2015, Tsui2015], and we have even dealt with a short 3 days’ threshold in one of the studies reported in this Thesis.
Readmission risk prediction models have become effective tools that help medical decision making and provide several benefits to both healthcare providers and patients [[Zheng2015]. Predictive models facilitate identification of patients at high risk for hospital readmissions and potentially enable direct specific interventions toward those who might benefit most [Walraven2010]. Interventions involving issues such as medication reconciliation, patient education, telephone follow-ups among others, have shown to effectively reduce readmission rates for patients after hospital discharge [Kripalani2014, Urma2017, Leppin2014].
However, some studies agree in concluding that predictive models based on administrative and clinical data discriminate poorly on readmissions [Ross2008, Kansagara2011, Dharmarajan2013, Mortazavi2016, [Krumholz2016]. The inherent difficulty of the problem and the limited discriminant power of the variables recorded in the dataset (i.e. the problem may be far from being linearly separable) may be the cause to the modest performance of the risk prediction models.
Most of the models in the literature are based on traditional statistics, mainly logistic regression and survival analysis [Ross2008, [Zheng2015]. Increasingly, authors propose machine learning as one of the best ways in which data can be used to extract knowledge [Kadi2017].
Machine learning techniques can improve both discrimination and range of prediction over traditional statistical techniques, with the ability to leverage all available data and their complex relationships [Mortazavi2016].
This Thesis aims to contribute to the field of readmission risk prediction modelling by providing comparative studies on the application of state-of-the-art and some innovative machine learning techniques for model building. We have tackled the problem in two different medical areas which are commented below, namely emergency department readmissions and those related with heart failure patients.
1.1.1.
Emergency Department Readmissions
The aging of global population is a recognized fact. The number of people aged over 65 is projected to grow from an estimated 524 million in 2010 to nearly 1.5 billion in 2050 worldwide [WHO2011]. This trend has a direct impact on the sustainability of health systems, in maintaining both public policies and the required budgets.
Introduction 3 This growing population group represents an unprecedented challenge for healthcare systems. In developed countries, older adults already account for 12 to 21% of all Emergency Department (ED) visits and it is estimated that this will increase by around 34% by 2030 [Carpenter2011]. Older patients have increasingly complex medical conditions in terms of their number of morbidities and other conditions, such as the number of medications they use, existence of geriatric syndromes, their degree of physical or mental disability, and the interplay of social factors influencing their condition [Kansagara2011]. Recent studies have shown that adults above 75 years of age have the highest rates of ED readmission, and the longest stays, demanding around 50% more ancillary tests [Lopez2011]. Notwithstanding the intense use of resources, these patients often leave the ED unsatisfied, with poorer clinical outcomes, and higher rates of misdiagnosis and medication errors [Han2009] compared to younger patients. Additionally, once they are discharged from the hospital, they have a high risk of adverse outcomes, such as functional worsening, ED readmission, hospitalization, death and institutionalization [Guidelines2014].
1.1.2.
Heart Failure
Heart failure (HF) is a clinical syndrome characterized by typical symptoms (e.g. breathlessness, ankle swelling and fatigue) caused by a structural and/or functional cardiac abnormality, resulting in a reduced cardiac output and/or elevated intra-cardiac pressures at rest or during stress. Demonstration of an underlying cardiac cause is central to the diagnosis of HF. This is usually a myocardial abnormality causing ventricular dysfunction or abnormalities of the valves, pericardium, endocardium, heart rhythm and conduction [Ponikowski2016].The prevalence of HF is approximately 1–2% of the adult population in developed countries, rising to ≥10% among people >70 years of age [Mosterd2007]. Cardiovascular diseases and pathological processes such as HF have the highest 30-day readmission rates [Jencks2009]. In USA, it is estimated that almost half of the Medicare beneficiaries are readmitted within 6 months after a hospitalization for congestive HF [Krumholz1997].
1.2.
Thesis Contributions
The following are the technical and methodological contributions to the field of predictive models for readmission in this Thesis:
● We carry out a systematic literature review, through a thorough analysis of the most significant and recent literature on readmission risk prediction modelling
● We contribute an innovative ensemble method that combines data resampling with bootstrap aggregating (bagging) and an ensemble of Extreme Learning Machine (ELM) and Decision Tree (DT) pairs for modelling heavily imbalanced datasets
● We carry out a detailed analysis of the state-of-the-art approaches addressing the issue of class imbalance. Different methods for alleviating the majority class bias are evaluated using real life medical datasets
● We present a real-life application of the recently published Anticipative Hybrid Extreme Rotation Forest (AHERF), which is a heterogeneous ensemble classifier that anticipates which classifier architecture is better suited for the problem domain at hand
● We provide an overview and evaluation of common approaches for feature selection in readmission risk prediction. We evaluate the performance of some of the most relevant techniques in the field using real use-case data
● We design and implement a software toolbox for predictive modelling in readmission, distributed as open source software1. In addition, a synthetic dataset is included for testing
purposes, which has been generated in accordance with the statistics of the real datasets used in this Thesis
1.2.1.
On the curation of the experimental datasets
Although it’s been extensively reported, we believe that it is necessary to stress the importance of data preparation in general, and data cleansing in particular. Often, when working with most of publicly available datasets, most data preprocessing is already done and thus, it is transparent to the data scientist, whose effort can be focused on carrying out machine learning experiments. However, the real-life datasets that we have been provided with are in a quite different state. Most of times, data was delivered to us in several ASCII or spreadsheet files, often containing incongruences and erroneous data. Let this example help illustrate the problem: One of the datasets came from a study regarding a telemonitoring program for specific kind of patients. The user interface presented to the patients in the telemonitoring program (via a PDA) provided a free text field for reporting data such as weight or systolic and diastolic blood pressure, instead of using proper float or integer constrained set of form fields (even with input coherence check). Therefore, I had to spend long working hours figuring out the way the patient wrote down the data, and implementing appropriate scripts to filter millions of data entries. This minor design flaw means that data is unreliable even after such cleaning since patients will always be able to
1https://github.com/aartetxe/par-toolbox
Introduction 5 invent innovative ways of annotating the required measurement values if no guidance or control is provided. The consequence is that most of the researchers in the data science field spend more time data sanitizing than in model building. As a corollary, we learnt that data preparation is a time and resource consuming task intrinsic to data mining that shouldn’t be underestimated, under penalty of jeopardizing a data analysis project (in terms of both tasks and budget).
1.3.
Publications
The following publications are the direct result of the works reported in this Thesis.
1. Arkaitz Artetxe, Manuel Graña, Andoni Beristain, Sebastián Ríos. Balanced training of a hybrid ensemble method for imbalanced datasets: A case of emergency department readmission prediction. Neural Computing and Applications (2017) (Accepted). [JCR (2016): 2.505, 5-year: 2.012, Q2]
2. Arkaitz Artetxe, Manuel Graña, Andoni Beristain, Sebastián Ríos. Emergency Department Readmission Risk Prediction: A Case Study in Chile. In International Work-Conference on the Interplay Between Natural and Artificial Computation (pp. 11-20). Springer, Cham (2017).
3. Arkaitz Artetxe, Nekane Larburu, Nekane Murga, Vanessa Escolar, Manuel Graña. Heart Failure Readmission or Early Death Risk Factor Analysis: A Case Study in a Telemonitoring Program. In International Conference on Innovation in Medicine and Healthcare (pp. 244-253). Springer, Cham (2017).
4. Arkaitz Artetxe, Borja Ayerdi, Manuel Graña, Sebastian Rios, Using Anticipative Hybrid Extreme Rotation Forest to predict emergency service readmission risk. Journal of Computational Science, vol. 20, p. 154-161 (2017). [JCR (2016): 1.748, 5-year: 2.009, Q2]
5. Arkaitz Artetxe, Andoni Beristain, Manuel Graña, Ariadna Besga. Predicting 30-Day Emergency Readmission Risk. In Proceedings of the International Joint Conference SOCO'16-CISIS'16-ICEUTE'16. ICEUTE 2016. Advances in Intelligent Systems and Computing, vol. 527, pp.3-12. Springer, Cham (2016).
Other publications by the PhD student not directly related to the topics presented in this Thesis: 6. Arkaitz Artetxe, Gorka Epelde, Andoni Beristain, Ane Murua, Roberto Álvarez. Gaining
Proceedings of the 11th Joint Conference on Computer Vision, Imaging and Computer Graphics Theory and Applications ISBN 978-989-758-175-5, pages 115-122. DOI: 10.5220/0005675701150122 (2016)
7. M. Alberich, A. Artetxe, E. Santamaría-Navarro, A. Nonell-Canals, G. Maclair, GENESIS - Cloud-Based System for Next Generation Sequencing Analysis: A Proof of Concept, Innovation in Medicine and Healthcare 2016, Smart Innovation, Systems and Technologies, vol 60, pp 291-300. Springer, Cham (2016).
8. Álvarez, R., Murua, A., Artetxe A., Epelde G. & Beristain A. A platform for user empowerment through Self Ecological Momentary Assessment / Intervention. Proceedings of 5th EAI International Conference on Wireless Mobile Communication and Healthcare (2015)
9. Carrasco, E., Sánchez, E., Artetxe, A., Toro, C., Graña, M., Guijarro, F., Susperregui J.M., Aguirre, A. Hygehos Home: an innovative remote follow-up system for chronic patients. Innovation in Medicine and Healthcare 2014, 207, 261 (2015).
10. Iker Mesa, Eider Sanchez , Carlos Toro , Javier Diaz , Arkaitz Artetxe , Manuel Graña , Frank Guijarro , Cesar Martinez , Jose Manuel Jimenez , Shabs Rajasekharan , Jose Antonio Alarcon & Alessandro De Mauro: Design and Development of a Mobile Cardiac Rehabilitation System. Cybernetics and Systems: An International Journal, 45:2, 92-108 (2014) [JCR (2014): 0.84, 5-year: 0.968, Q3]
11. Arkaitz Artetxe, Andoni Beristain, Luis Kabongo. Activity Classification Using Mobile Phone based Motion Sensing and Distributed Computing. Studies in health technology and informatics, 207, 1-10 (2013)
12. Arkaitz Artetxe, Eider Sanchez, Carlos Toro, Cesar Sanín, Edward Szczerbicki, Manuel Graña, Jorge Posada: Impact of Reflexive Ontologies in Semantic Clinical Decision Support Systems. Cybernetics and Systems: An International Journal 44(2-3): 187-203 (2013) [JCR (2013): 0.507, 5-year: 0.77, Q3]
13. Eider Sanchez, Carlos Toro, Arkaitz Artetxe, Manuel Graña, Cesar Sanín, Edward Szczerbicki, Eduardo Carrasco, Frank Guijarro: Bridging challenges of clinical decision support systems with a semantic approach. A case study on breast cancer. Pattern Recognition Letters 34(14): 1758-1768 (2013) [JCR (2013): 1.062, 5-year: 1.466, Q3]
Introduction 7 14. Iker Mesa, Eider Sanchez, Javier Diaz, Carlos Toro, Arkaitz Artetxe. GoCardio: A novel approach for mobility in cardiac monitoring. InImpact: The Journal of Innovation Impact, vol. 6(1), p. 110 (2016)
15. Arkaitz Artetxe, Eider Sanchez, Carlos Toro, Cesar Sanín, Edward Szczerbicki, Manuel Graña, Jorge Posada: Speed-up of a Knowledge-Based Clinical Diagnosis System using Reflexive Ontologies. KES 2012: 1480-1489 (2012)
16. Eider Sanchez, Carlos Toro, Arkaitz Artetxe, Manuel Graña, Eduardo Carrasco, Frank Guijarro: A Semantic Clinical Decision Support System: conceptual architecture and implementation guidelines. KES 2012: 1390-1399 (2012)
Introduction 9
1.4.
Structure of the Thesis
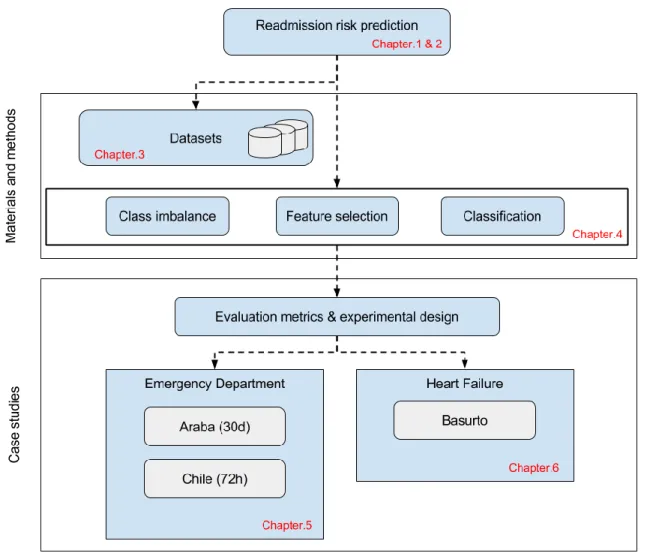
The contents of the Thesis (shown diagrammatically in Figure 1.1) are structured as follows: ● Chapter 2 introduces the readmission risk prediction problem and provides background
information related with the main contributions of this Thesis. This chapter contains a detailed systematic review of the state-of-the-art techniques and methodologies related with readmission risk prediction models.
● Chapter 3 describes the datasets that were used for the computational experiments carried out in this Thesis.
● Chapter 4 provides the definition of the computational methods used in the experiments, along with a description of the related methodological issues. Several feature selection techniques, class imbalance addressing approaches and classification algorithms used in this Thesis are presented.
● Chapter 5 presents the experimental results of the studies developed in the two areas of healthcare tackled in this Thesis: Emergency Department and Heart Failure readmission risk prediction.
● Chapter 6 provides the conclusions of the Thesis and proposes some future work.
Complementarily, 2 appendices are included in the Thesis.
● Appendix A: Describes the HF patient telemonitoring program, which is part of the working scenarios of this Thesis.
● Appendix B: Presents the results of the systematic review on readmission risk prediction models.
11
Chapter 2
State of the Art
This chapter provides a description of the Thesis’ most relevant concepts by a systematic literature review, in which a thorough analysis of the most significant readmission risk predictive modelling studies is carried out. Next, we briefly describe heart failure from the medical point of view, discussing some predictive modelling studies related to this disease.
2.1.
Predictive Models for Readmission Risk: A Systematic
Review
Readmission prediction models are not new, and there exists a plethora of studies addressing this problem. A query about readmission prediction in Google Scholar returns about 28,500 hits, which is a clear indicator of the interest of the scientific community in the topic. The high number of published studies covers a wide spectrum of approaches, which justifies the work on a thorough review in order to achieve a map of the relevant procedures and issues regarding the topic.
Some authors have performed bibliographic review studies with the objective of synthesizing the literature on prediction models for the estimation of readmission risk. In 2011 Kansagara et al. [Kansagara2011] presented the most referenced systematic review paper about this topic. It was focused on model description and performance comparison in order to assess model suitability for clinical or administrative use. Authors conclude that most readmission risk prediction models perform poorly so that efforts to improve their performance are still needed. The study also concludes that readmission risk prediction is a complex problem by nature, with many inherent difficulties and inescapable traps, such as the small number of variables which are very noisy and not very much informative.
In 2015 Swain et al. [Swain2015] conducted a semi-systematic review of readmission predictive factors from predictive modeling papers published prior to March 2013. This review was, to some degree, based on [Kansagara2011] since its citations were automatically included within the potentially relevant article’s list. Other studies concentrate on a certain subpopulation rather than covering all the published risk prediction models. Ross et al. [Ross2008] conducted a review of statistical models for the readmission of heart failure (HF) patients. This work included the identification of analytic models, apart from identifying patient characteristics associated with readmission. A more recent study from Leppin et al. [Leppin2014] reviewed randomized trials that assessed the effect of interventions intended to prevent 30-day hospital readmissions.
Most of the previous review studies have focused on measuring the discrimination ability of the models and identifying predictive characteristics associated with readmission. In different but related fields, review studies targeting the analysis of data analysis approaches can be found. For instance, [Kadi2017] is a recent systematic literature review on data mining techniques applied in cardiology.
Nevertheless, to our knowledge no review study covering data mining techniques, including feature selection and class imbalance, has been presented in the field of readmission prediction.
2.1.1.
Research methodology
A systematic review is a formal method that enables the identification, assessment and interpretation of all available studies relevant to a specific research question, topic area or subject of interest [Brereton2007]. Systematic reviews differ from narrative reviews in that they are based “on a clearly formulated question that uses systematic and explicit methods to identify, select and critically appraise relevant primary research, and to extract and analyse data from the studies that are included in the review” [Khan2003].
In this work, we conduct a systematic review following the three stages proposed by Tranfield et al. [Tranfield2003], namely planning, conducting and reporting, as illustrated in Figure 2.1.
State of the Art 13 According to this methodology, first we define the research questions. Secondly, we define the search strategy by identifying the source databases and the inclusion and exclusion criteria. Next, we present the data extraction procedure and, finally, we present the results.
2.1.2.
Research questions
The overall objective of our systematic review is to identify and analyse the most significant research studies carried out on the topic of readmission risk prediction. More precisely, this review examines the data analysis methods utilized in these studies, paying special attention to data mining techniques. Table 2.1shows the research questions that guided this review.
Table 2.1. Research questions # Research Question Rationale Q1 Which data analysis methods were used
in readmission risk prediction?
To identify the most common procedures that are applied for model construction in readmission risk prediction.
Q2 Which data mining techniques were used in readmission risk prediction?
To identify which data mining techniques are used for readmission risk prediction model construction.
Q3 What is the overall performance of models in readmission risk prediction?
To assess the discrimination ability of the models in readmission risk prediction.
Given that the second research question (Q2) is broad, it was divided into three sub-questions: ● Q2.1 Classification algorithms,
● Q2.2 Feature selection techniques, and
● Q2.3 Techniques addressing class imbalance issues.
2.1.3.
Search strategy
Search engines
We chose PubMed and Google Scholar search engines to retrieve the primary literature references. Google Scholar was selected because of its broad coverage of general scientific publications, while PubMed provided access to the more specialized MEDLINE (Medical Literature Analysis and Retrieval System Online) database.
Table 2.2 shows the search strings used with the search engines. The search strings were designed to achieve an appropriate trade-off between coverage and manageable size of the retrieved reference list.
Table 2.2. Search strings Database Search term
Google Scholar ((readmission) OR (rehospitalization)) AND ((“prediction model”) OR (“predictive model”) OR (“risk model”))
PubMed ((readmission*) OR (rehospitalization*)) AND (("prediction model") OR ("predictive model"))
Additionally, we added the reference lists of main review articles to the references used in the analysis, assuming their quality.
Search limits
The following search limitations were applied: ● Peer-reviewed journal articles in English
We limited the search to indexed journal articles written in English language. Peer-reviewed journal articles are considered to provide a good view of accepted and validated methodologies and knowledge.
● Search within
We performed the search using all fields available, that is, we do not restrict the search to the title and abstract or to a particular subject area. Our main goal was not to disregard high impact papers due to restrictive search conditions.
● Published between
We did not restrict our search to a precise time frame. Citations were collected on February 15, 2017 so that very few studies published in 2017 were included. It’s worth noting that, due to the delays related to journal publishing, some studies accepted for publication in late 2016 may not be included.
Moreover, we excluded studies whose target population were patients that underwent certain surgical procedure for being too specific.
Data extracted from the publications
For each study included in the review, we have extracted and summarized data associated with the research questions defined. Analytic model was extracted in relation to Q1. We collected the AUC metric (Area Under the Roc Curve) if reported as the canonical measure for discrimination
State of the Art 15 ability (Q3) of the models. The different sub-questions of Q2 lead us to the collection of the following information: Feature selection technique, procedures addressing class-imbalance applied, and readmission rate, which is directly related to the imbalance-ratio (see Section 4.1). Additionally, target population, readmission threshold (in hours, days or months) and dataset size (number of instances of the dataset) were also collected.
2.1.4.
Results
In this section, we present the results of our systematic review study. First, we present an overview of the results and following we discuss specific research questions.
Overview of selected studies
As shown in Figure 2.2, we gathered 208 eligible references from the search engines. Duplicated references (32) in the merged list retrieved from both databases were excluded. To this list, we added references extracted from the reference lists of main review articles in the literature (43 additional references). At this step, we had a dataset consisting of 219 potentially relevant references for analysis and review. In the following step, 95 references were excluded based on the review of the title and abstract. Further reviews excluded 58 articles that did not fulfil the predefined inclusion criteria. 32 of them were excluded due to the language and peer-review criteria. 11 citations were excluded for not including a readmission prediction model and 15 were discarded for being out of the review scope.
State of the Art 17
Figure 2.3 shows the number of papers (only covers studies included in the review) per year. Can be noticed that the number of papers has increased in recent years, reaching a peak in 2015 and 2016. Nevertheless, it’s worth noting that the number of papers corresponding to 2017 is not the final count since the search was performed on 15th February 2017. In addition, the value for 2016
should also be considered with caution, since probably some 2016 papers were not yet indexed on early 2017, when this survey was carried out.
Figure 2.3. Number of publications per year
Data analysis methods
Readmission risk prediction has been addressed from different perspectives. Early studies have been conducted using conventional statistical multivariate modelling, which has been widely used in medical research. Fundamentally two different but related procedures from classical statistical modelling approaches have been used: regression analysis and survival analysis. Both techniques consist basically in defining a binary outcome (readmitted or not), and fitting a multivariate model over a given set of samples (aka instances), each composed of multiple features (aka variables, predictors or covariates) describing the facts related to the event, such as patient demographics, physiological state, etc.
Regression analysis estimates the probability of the target variable from some linear combination of the predictors. Binary logistic regression is a regression model where the target variable is
binary, that is, it can take only two values, 0 or 1. It is the most utilized regression model in readmission prediction, where the output is modelled as readmitted (1) or not readmitted (0). Survival models, on the other hand, use the features to compute an estimate of the time that passes before the event of interest (i.e. readmission) occurs.
In recent years, machine learning and data mining have emerged as approaches with big potentiality to improve the prediction ability of the readmission risk prediction models. Those techniques include classification algorithms widely used in multiple fields for predictive modelling of the most diverse tasks. However, machine learning techniques are not limited to the construction of the classifier, but they also encompass a wider set of techniques such as feature selection, variable discretization and normalization, missing value imputation, and many others. Figure 2.4 presents a simplified taxonomy of procedures held in the studies included in this review. Figure 2.5 shows the evolution in time of the proportion of modelling techniques regarding the type of approach. A trend can be devised where machine leaning (ML) techniques emerged during the last years are gaining relevance over the classical techniques.
State of the Art 19
Figure 2.5. Distribution of methods per type and year (note that years without any publication included in the study are not present)
Feature selection techniques
Feature selection, aka feature subset selection (FSS), is a common practice in many data analytic fields aiming to identify the most significant variables of a dataset. In medicine, it is of special importance since it allows identifying the key factors associated to a disease, or a specific risk condition. Moreover, feature selection is of special interest for its ability to reduce the number of features, what simplifies model’s complexity and reducing overfitting. This is particularly important in the clinical environment, where data acquisition is often related to costly procedures. In the context of readmission risk prediction, feature selection is tightly related to the classification model used. Here we can clearly distinguish the classical approach, consisting on a regression analysis procedure preceded by a univariate parametric or model-free method that selects the most significant variables to be included in the model. The most extended feature selection procedure is to carry out a univariate/bivariate analysis by means of statistical tests such as Student’s t-test, chi2, Wilcoxon or ANalysis Of VAriance (ANOVA), among others. Significant predictors from the univariate/bivariate analyses are then included in the final model. Variables with p-values lower than a pre-established threshold (typically 0.001 [AbdelRahman2014] though it may change from one study to another) are considered statistically significant features. A more refined hybrid approach that includes a stepwise [Greenland1989] approach is widely utilized with regression-based models.
1. Univariate variable selection (optional): For every feature, a univariate logistic regression model is built. Only features with a p-value from a Likelihood Ratio test below a specified threshold are retained.
2. A multivariate logistic regression is built on a stepwise fashion. There are two basic approaches:
a. Forward selection: initializes the model with an empty set of selected features and iteratively adds features, retaining only those whose addition shows statistically significant improvement of the fit.
b. Backward elimination, which initializes the model with the whole set of features proceeding by iteratively removing the features that do not improve (or do worsen) the model fit.
3. A final logistic regression model is built using the features selected in previous steps.
There is a wide variety of feature selection techniques that are utilized in the studies following data mining approaches for readmission risk prediction. Abdelrahman et al. [AbdelRahman2014] systematically evaluated different feature selection and ranking methods such as wrapper subset selection, information gain, gain ratio and symmetrical uncertainty. Cai et al. [Cai2016] used a correlation-based feature selection (CBFS) method for selecting the most significant features. Some other authors follow an embedded feature selection approach, which consists in conducting the feature search within the classifier itself, as part of the learning process. Nevertheless, many of the DM papers do not report the use of any specific feature selection approach.
Class imbalance
In readmission prediction, as well as in many other fields (e.g. fraud detection or fault diagnosis), instances of the event of interest are outnumbered by the “other events” instances. In supervised classification, data imbalance occurs when the a priori probabilities of the classes are significantly different, i.e. there exists a minority (positive) class that is underrepresented in the dataset in contrast to the majority (negative) class. Often the goal is the detection of the minority class instances, while the majority class is the collection of “other things” in the universe where classification is desired. Most classification algorithms assume equal a priori probabilities for all classes, so when the training dataset is imbalanced, the resulting model is biased towards the majority class.
Readmission prediction is an intrinsically imbalanced problem. All-population 30-day readmission rate is estimated in a 20% [Jencks2009], although it varies greatly depending on multiple factors (e.g. readmission threshold, subpopulation characteristics etc.). The level of class
State of the Art 21 imbalance of a dataset is given by the imbalance ratio (IR), so that a IR of 1:10 expresses that for each sample of the positive class, there are 10 samples of the negative class.
Unlike most classification algorithms used in machine learning (e.g. decision trees or linear discriminant analysis), linear regression is not affected by class imbalance (at least for modestly imbalanced data) [Crone2012]. Thus, while regression-based approaches do not suffer the class imbalance problem, it is a relevant problem that arises when machine learning approaches are implemented.
As shown in Table 2.3, most studies using machine learning algorithms do not report the use of any procedure correcting class imbalance. Among those who actually do something, resampling is the most utilized strategy to overcome class imbalance, either subsampling the majority class or oversampling the minority class.
Table 2.3. Class imbalance addressing methods in readmission risk prediction Paper Class imbalance addressing IR
amalakuhan2012 - 1:2.1
Au2012 - 1:5.3
abdelrahman2014 - 1:5.3
walsh2014 sub-sampling 1:14
Yu2015 - 1:5.3
Zheng2015 random oversampling 1:4.6
cai2016 - -
fisher2016 - 1:4
turgeman2016 boosting 1:3.6
Mortazavi2016 sub-sampling/oversampling/weighting1 1:6.8
bergese2017 - 1:45.5
1weighting chosen for final model
Most studies included in this review employ basic random over or sub sampling techniques. There are some cases [[Zheng2015] using more sophisticated resampling methods, such as SMOTE (Synthetic Minority Oversampling Technique) [Chawla2002]. In [Mortazavi2016] different methods are compared, including resampling (oversampling and subsampling) and cost-sensitive learning (weighting). According to the authors, weighting achieved the best results, and, hence, they included it in their final model. By contrast, Turgeman et al. [Turgeman2016] used boosting, which is an ensemble meta-algorithm also known to overcome the bias towards the majority class.
2.1.5.
Discussion
Different approaches reported in different studies cannot be directly compared since each study has its own particular characteristics in population, definition of the problem, computational methods and evaluation metrics.
The Area Under Receiver Operating Characteristic (ROC) Curve or c-statistic is the standard de facto metric for measuring the discrimination ability of readmission risk prediction models. The main goal of some papers is to identify predictors associated to readmission. Often, this kind of studies do not provide the c-statistic as the overall performance metric. Regarding the discrimination ability of the models, most papers report modest AUC scores, mostly below 0.75,
State of the Art 23 in agreement with the results presented in [Kansagara2011]. Nevertheless, 16 models reported AUC scores above 0.75 and 21% of the studies did not report AUC metric. However, discrimination of the models is not comparable since it is greatly influenced by the population subject to study as well as by factors such as readmission length threshold.
The most widely used readmission threshold is 30-day. It is used by 75% of the reviewed papers, although we found time spans ranging from 48 hours to 1 year. Consequently, readmission rates also vary depending on this threshold. Longer readmission thresholds are related to higher readmission rates and vice versa. However, other factors such as the population subject to study or the type of clinical study, can greatly influence this indicator.
There exists a discussion about what separates “traditional” applied statistics from machine learning. Even though we consider that there is considerable overlap among them, in this work we separate “traditional” methods from data mining or machine learning techniques. All the same, we are aware that many researchers accept that regression analysis (which we have excluded from machine learning) does actually make part of machine learning. We found very few studies were both approaches are compared under the same conditions. Most salient is the work by Futoma et al. [Futoma2015], where a comparison of logistic regression, stepwise logistic regression, random forest, SVM and deep neural networks is presented. Authors conclude that overall predictive accuracy can be improved moving from standard logistic regression to more complicated non-linear models although resulting models may be difficult to tune and interpret.
2.2.
Heart Failure readmission risk
Heart failure (HF) is a clinical syndrome characterized by typical symptoms (e.g. breathlessness, ankle swelling and fatigue) caused by a structural and/or functional cardiac abnormality, resulting in a reduced cardiac output and/or elevated intra-cardiac pressures at rest or during stress. Demonstration of an underlying cardiac cause is central to the diagnosis of HF. This is usually a myocardial abnormality causing ventricular dysfunction or abnormalities of the valves, pericardium, endocardium, heart rhythm and conduction [Ponikowski2016]. The prevalence of HF is approximately 1–2% of the adult population in developed countries, rising to ≥10% among people >70 years [Mosterd2007]. Cardiovascular diseases such as HF have the highest 30-day readmission rates [Jencks2009]. In USA, it is estimated that almost half of the Medicare beneficiaries are readmitted within 6 months after a hospitalization for congestive HF [Krumholz1997].
Over the last 30 years, improvements in treatments and their implementation have increased survival but the outcome often remains unsatisfactory. Most recent European data (ESC-HF pilot
study) demonstrates that 12-month mortality rates for HF patients are between 7% and 17%, and the 12-month hospitalization rates are between 32% and 44% [Ceia2002].
The negative effects of cardiovascular disease (CVD) are not limited only to the individual’s health. When CVD causes hospitalizations, short-term expenses tend to be extremely high. Costs include ambulance rides, diagnostic tests, hospital stays, and immediate treatment that may include surgery. Short-term costs aside, CVD remains expensive for the long-term due to the price of drugs, tests to monitor the progress of the disease, and frequent doctor appointments [HSA2011]. The high cost of CVD is compounded by the lack of productivity and income that such patient may have [Anand2006]. Additionally, high rates of readmission after hospitalization for HF impose tremendous burden on patients and on the healthcare system.
In this context, predictive models facilitate the identification of patients at high risk for hospital readmissions and potentially enable direct specific interventions toward those who might benefit most by identifying key risk factors. However, current predictive models using administrative and clinical data discriminate poorly on readmissions [Kansagara2011]. That is the reason why some studies have been developed in order to try to define whether machine learning would enhance prediction [Mortazavi2016].
Nevertheless, it remains unclear whether it is possible to predict and prevent hospital readmission and mortality in patients with HF. Currently, there are several healthcare programs where patient monitoring is carried out, so that clinicians can check patients’ progress [Riley2009, Cleland2005, Lusignan2001, U4H2017].
In some cases, clinicians define some simple rules, so that they can get some alerts that may indicate the deterioration of a patient [Mosterd2007]. In other cases, as shown in Mobiguide EU project, the system implements the local clinical guidelines and extend them to guide patients during their daily life [Ceia2002]. However, due to the lack of time of clinicians and the lack of suitable IT solutions, clinicians do not exploit the monitored information.
2.2.1.
Related Studies
Most studies follow methodologies based on statistical approaches, where logistic regression and Cox proportional hazard models are the most extended techniques. Among the studies that follow a traditional regression-based approach, a common procedure for dimensionality reduction is to apply wrapper feature selection techniques known as stepwise procedures, namely forward selection, backwards elimination or stepwise regression. These techniques consist in sequentially adding or removing features into/from a feature subset according to the estimated performance of a multivariate regression model. Often, a previous univariate feature selection is performed, where not-significant features (those with a p-value greater than a given threshold) are removed. With
State of the Art 25 this preliminary step, it is intended that only significant features are passed to the following feature selection step
Some authors [Mortazavi2016] have pointed out that other approaches for risk prediction, such as machine learning, can be utilized to achieve better performance, comparing the predictive performance of traditional statistics methods (logistic regression and Poisson regression) and machine learning methods (Random Forest, Boosting and SVM). In [Kadi2017] a review of studies on the application of data mining techniques in cardiology is presented where Neural Networks, Decision Trees and SVMs are identified as the most frequently used predictive techniques. Some recent studies [Au2012, [Zheng2015, Turgeman2016] make use of machine learning techniques, where Support Vector Machine (SVM) and Random Forest (RF) are the most utilized algorithms. In [Au2012] authors undertook RF analysis for predicting unplanned readmission or death within 30 day of discharge after a HF hospitalization. Prediction ability of the features selected by RF were compared with the variables in the LACE score [Walraven2010]. On the other hand, [Turgeman2016] presented an ensemble algorithm combining boosted decision trees and SVM.
Zheng et al. [[Zheng2015] studied the risk prediction of hospital readmissions in HF patients using metaheuristic and data mining approaches. Authors indicate the need of compensation strategies that address the class imbalance, suggesting over-sampling techniques such as SMOTE.
2.3.
Conclusions
Although classical statistical techniques have prevailed and are still popular techniques in medical studies, machine learning approaches have emerged in the last years as a promising set of techniques that can improve the predictive ability of readmission risk prediction models. Still, univariate and stepwise regression are the dominant modelling methods, while additional feature selection methods are infrequent. Within the studies that use data mining techniques, we found that class imbalance is only addressed in a minority of them, though it is a major shortcoming of conventional machine learning.
Regarding feature selection techniques, we observed that conventional univariate approaches are the most extended. Stepwise regression is also an extended feature reduction procedure intended to produce parsimonious models. Recent studies introducing machine learning techniques report promising results and anticipate advantages over classical methods. Nevertheless, further comparative studies are needed to assess the real impact of this techniques in the domain of readmission risk prediction. Moreover, further areas of machine learning such as feature selection, class imbalance or variable discretization remain still largely unexplored.
In readmission prediction like in many other medical fields, data is intrinsically class-imbalanced. General 30-day readmission rate varies from 11% to 25% [Jencks2009, Silverstein2008, Desai2012] depending on the population subject to study. In supervised classification, class imbalance imposes a bias towards the majority class that leads to a higher misclassification rate of the minority class instances (which are usually the most interesting ones from the practical point of view [Lopez2013]). Although this effect is not that significant for regression analysis, most of machine learning techniques assume equal a priori probability for all the classes, so that class imbalance is an issue that must be addressed.
Feature selection is another challenge that must be tackled when applying machine learning techniques in the readmission prediction domain. Feature reduction is of great importance since it reduces noise, avoids collinearity and reduces the cost since in a clinical context, measuring variables may be expensive. Traditional procedures include univariate parametric methods such as t-test, chi2 or regression [Bradford2016] and wrapper methods, mainly stepwise regression. Nevertheless, machine learning methods can be used to improve model’s performance thanks to their ability to leverage all available data and their complex relations.
27
Chapter 3
Dataset
This chapter is devoted to the description of the datasets that support the experimental works of this Thesis. These datasets were directly provided by physicians through their information and communication (ITC) services, such as the one of Osakidetza, the Basque public health service provider, and the Hospital José Joaquín Aguirre of the Universidad de Chile. We received the data after being anonymized, so that all issues of ethics and data privacy were already solved by the providers. In the following sections, we present the three datasets that we used, named according to their place of origin: University Hospital of Araba, Hospital José Joaquín Aguirre of the Universidad de Chile, and Hospital of Basurto.
3.1.
University Hospital of Araba Dataset
The original dataset was collected by Dr. Ariadna Besga during June 2014 and was composed of 802 admissions registered at the two hospitals that form the University Hospital Araba, namely Hospital Txagorritxu and Hospital Santiago Apostol. After filtering the Emergency Department (ED) admissions, the dataset was composed of 462 admission samples of 360 unique patients. The final curated dataset used for the experiments was presented by Besga et al. in [Besga2015]. It encompases data of 360 patients divided into four groups, namely:
1. Case management (CM), which is the most general category of data encompassing all categories not covered by the specific categories
2. Patients with chronic obstructive pulmonary disease (COPD), 3. Heart failure (HF) and
4. Diabetes Mellitus (DM).
For each patient, a set of 97 variables were collected, divided into four main groups: i) Sociodemographic data and baseline status, ii) Personal history, iii) Reasons for consultation/
Diagnoses made at ED and iv) Regular medications and other treatments. The dataset contains missing values. Table 3.1 shows the distribution of the number of variables of each category.
Table 3.1. Distribution of variables by category from the University Hospital of Araba
Variable No. (%) of variables n=96
Sociodemographic and
baseline status 4 (4.2) Personal history 43 (44.8) Reasons for consultation 16 (16.7) Regular medications 33 (34.3)
In order to build our model following a binary classification approach, the target variable was set to readmitted/not readmitted. Those patients returning to ED within 30 days after being discharged are considered readmitted (value=1), otherwise are considered as not readmitted (value=0).
It is noteworthy that one patient returning the first day and another returning the 30th are both
considered as readmitted. On the other hand, a patient returning the 31th day is considered as not readmitted, while in practice underwent a readmission Table 3.2 shows the distribution of readmission rate across different subpopulations.
Table 3.2. Comparative information about the subpopulations of the dataset from the University Hospital of Araba
Readmission within 30 days, no. (%) of patients Overall no. of patients No Yes n=360 n=296 (82.2) n=64 (17.7) Case management 94 (26.1) 73 (77.7) 21 (22.3) Heart failure 70 (19.4) 62 (88.6) 8 (11.4) Chronic obstructive pulmonary disease 80 (22.2) 64 (80) 16 (20) Diabetes mellitus 116 (32.2) 97 (83.6) 19 (16.4)
We observe that readmission rate varies greatly depending on the subpopulations, ranging from 11.4% to 22.3% for HF and case management respectively. We also notice that data is not well
Dataset 29 balanced in terms of different population stratum. Figure 3.1 shows the distribution of some demographic features across the mentioned subpopulations. It can be appreciated (Figure 3.2) that the class distributions are imbalanced, though the actual imbalance ratios vary greatly between population strata.
Table 3.3 reproduces the most significant variables of each subpopulation according to a t-test for the significant differences among the mean values between readmitted and non-readmitted patients as (Besga et al. in [Besga2015]).
Figure 3.1. Boxplots of age at admission time across different population stratum
Figure 3.3. Distribution of number of patients per sex in the University Hospital of Araba dataset across different population stratum
Dataset 31 Table 3.3. Most significant variables for each population stratum in the University Hospital of
Araba dataset according to t-test, extracted from [Besga2015]
Feature p-value
Case management
Patient age on admission 0.0054
Considered useful to make a follow-up call 0.0087
Acute myocardial infarction 0.0066
Thyroid disease 0.0013
Use of antipsychotics 0.0039
Use of inhalers 0.0034
Diagnosis of COPD 0.0021
Heart failure
Acute myocardial infarction 0.0001
Dementia 0.0001
Number of medications prescribed on ED discharge 0.0000 Diagnosis of gastrointestinal illness 0.0020
COPD Dementia 0.0071 Depression 0.0038 Use of anticoagulants 0.0071 Genitourinary problems 0.0021 Use of opioids 0.0021 History of falls 0.0071 Diabetes mellitus Organic lesions 0.0006
3.2.
University of Chile Dataset
This dataset is composed of ED admission events of 102,534 patients divided into 2 groups, namely adults and paediatrics, which amounts to 156,120 admission cases recorded between January 1st, 2013 and August 31, 2015 from the electronic medical records of the Hospital José Joaquín Aguirre de la Universidad de Chile. At admission time a set of 17 variables were collected. The variables or features are categorized into three main groups: i) Sociodemographic data and baseline status, ii) Personal history and iii) Reasons for consultation or diagnoses made at admission. The dataset contains missing values.
3.2.1.
Data pre-processing
Data was provided in a large ASCII text file containing 156,120 admission records corresponding to 102,534 different patient identities. After parsing the data, we built a dataset combining admission and patient-related data. Next, we cleaned the data by removing inconsistent and missing samples. Missing values were imputed using the arithmetic mean for continuous variables and the mode for categorical variables.
For each admission of a patient to the ED we calculated the number of days elapsed since his last visit. In order to build our model following a binary classification approach, the target variable meaning was set to readmitted/not readmitted. Those patients returning to the ED within 72 hours after being discharged were considered readmitted, otherwise they were considered not readmitted.
Notice that a patient returning the very first day after discharge and another one returning the third day are both considered as readmitted. On the other hand, a patient returning the 73rd hour from discharge is considered as not readmitted.
After removing inconsistent and missing samples the dataset was composed of 99,858 instances.
3.2.2.
Description
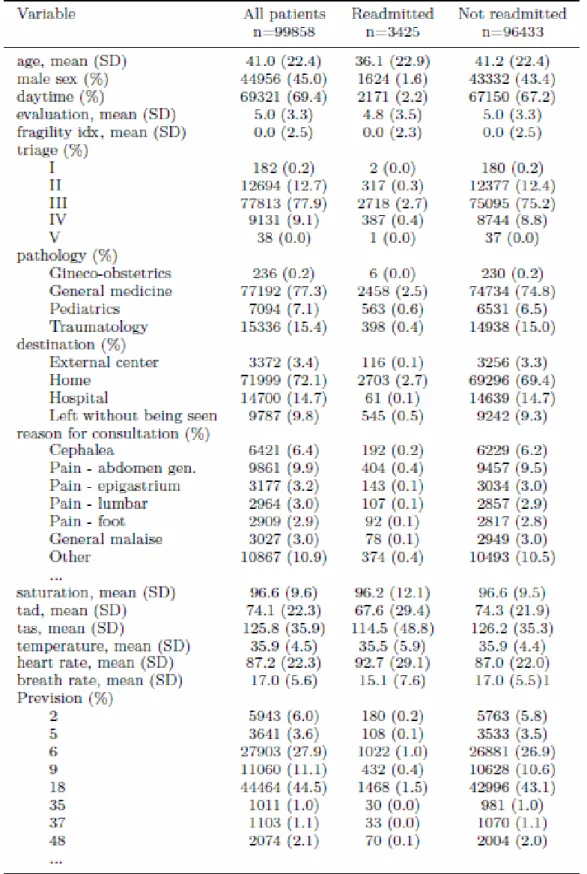
Table 3.4 shows the distribution of admissions and readmission records according to gender, broad pathology class (general medicine, traumatology, paediatric, and gyneco-obstetrics), and the assigned triage. Class distribution shown in Table 3.4 indicates an imbalance ratio (IR) of approximately 1:28, which is a strong case of class imbalanced data. Notice that most admissions correspond to general medicine, followed by the paediatric admissions, however if we consider readmissions, the paediatric segment of the population is responsible for more than half (56%) of
Dataset 33 the readmissions, with some implications on the causes. Note also that triage III accounts for most admissions and readmissions (75%).
Figure 3.4 shows the distribution of readmission class among some attributes of our dataset. Readmissions (shown as green columns) are much less frequent than normal admissions, i.e. the dataset is heavily imbalanced. Some details, such as the greater frequency of readmission for people in the age range 20-30, can be appreciated. Still, there is not enough evidence that allow to use a single variable for the prediction.
The description of each patient contains a categorical variable encoding the admission motivation, this encoding into more than 500 topics is given by the electronic medical record implementation. Table 3.5 contains the more frequent causes of admission and readmission, those accounting for 1.5% of the cases or more. The non-informative category “OTHERS” is the most frequent, and the most frequent causes for admission appear also as causes of readmission. In our current implementation, this variable has been encoded with a vector of binary valued features, one per each admission motivation category. This approach is equivalent to unfold a subspace of dimension 500 to represent the variable motive. Additional features correspond to the encoding of the triage, demographics variables such as age, sex, adult or paediatric patient, and physiological variables such as blood pressure, temperature, heart rate, respiratory rate, glucose levels, and others. Hence, feature vector dimension is greater than 500, which is an already very high dimension. Table 3.6 contains the descriptive statistics of the main variables of the University of Chile dataset. In some variables, we give the mean and standard deviation mean (SD), for other we give the number of instances and the percentage in the whole population. Figure 3.5 shows the histograms of the causes for admission (a) for the entire population, (b) for the non-readmitted patients, and (c) for the readmitted patients. It can be appreciated that the OTHERS motivation is rather salient in all situations, while the next five most frequent motivations are common to the readmitted and non-readmitted patients, though in different orders of importance, exception made of the fever cause, which is much more prevalent in readmissions.
Table 3.4. Statistics of ED admissions from 2013 to 2016. Age mean and standard deviation. Remaining rows give the number of records and the percentage relative to the total Columns correspond to no readmission, readmission, and total number of records. By rows, we give the total number and percentage of the total population of the occurrence of each kind of gender, class
of pathology, and triage assigned upon arrival.
72h readmission Total No (n=148617) Yes (n=5674) n=154291
Age Years (%) 33.3 (24.8) 22.2 (24.6) 32.9 (24.9) Gender Male 69106 (46.5) 2832 (49.9) 71983 (46.6) Female 79511 (53.5) 2842 (50.1) 82353 (53.4) Pathology General Medicine 91566 (61.6) 2375 93941 (60.9) Traumatology 16651 (11.2) 325 16976 (11) Paediatric 39999 (26.9) 2964
![Figure 2.1. Phases of a systematic review according to [Tranfield2003]](https://thumb-us.123doks.com/thumbv2/123dok_us/516564.2560899/28.893.117.759.897.1074/figure-phases-systematic-review-according-tranfield.webp)