Network Effects on Standard Software Markets:
A Simulation Model to examine Pricing Strategies
Peter Buxmann1
Abstract
This paper examines strategies of standard software vendors, in view of the existence of network effects on standard software markets. In particular, we analyze if and under which conditions penetration pricing can be considered as a promising strategy. Our work is based on a simulation model, which provides the opportunity to examine the impact of alternative pricing strategies on the distribution of software systems. Furthermore, the paper provides some empirical results from the perspective of the users.
1
Prof. Dr. Peter Buxmann, Freiberg University of Technology, Chair of Information Management, Lessingstr. 45, 09596 Fre iberg, Germany, [email protected]
I
Introduction
Today, more and more software can be downloaded from the Internet for free. This software includes Web Browsers, different tools for software development as well as an operating system “LINUX” which has been developed by an Internet community. The company Star gave away its products, first to private customers and later on also to business enterprises until the company was taken over by Sun Microsystems. Does this mean that software will be free in the future?
This paper discusses pricing strategies for standard software vendors. In particular, we examine under which conditions penetration pricing [Shapiro/Varian (1998), 14] can be a promising strategy. Thereby, the existence of network effects plays a key role. The analysis is based on a simulation model. Furthermore, we conducted an empirical survey among users.
Section two provides a short introduction to the theory of network effects and its application to standard software. In section three an overview of strategies of standard software vendors is given. Using a simulation model, alternative pricing strategies will be examined in section four. The results of the simulation model will be compared to the findings of empirical studies.
II
Network Effects on Standard Software Markets
2.1 Basics of Network Effects
Let us first define network effects: The utility of some goods depends on the number of people using these goods. We distinguish between direct and indirect network effects [Katz/Shapiro (1985), 424]:
§ Direct network effects result from compatibility between system elements. For example, the utility of an e- mail system is increasing with the number of users also using it. Further examples are Internet as well as mobile phone standards.
§ Indirect network effects assume a positive dependency between the spreading of a technology or a standard and appropriate offers of complementary goods. For example, the spreading of an operating system plays an important part in determining the supply of compatible application software. Another example is the extensive variety of application programs for Windows.
Moreover, we can make a distinction between these network effect utilities and the basic utility of a good. A text processing program, for example, is offering both basic utility and network effect utility. The basic utility results from its functionalities, e.g. special options for text formatting, integration of graphics, automatic index creation etc. In contrast, the network effect utility results from the possibilities of exchanging files with other users (direct network effect), or receiving advices for handling the system (indirect network effect). On the other hand, an e- mail system is an example for a good which only leads to a network effect utility. What can a single user do with such a system?
To measure the strength of network effect utility in relation to basic utility, we introduce a network effect factor Q. Hereby, c defines the network effect utility and b the basic utility. The network effect factor is defined as follows:
Q has a value between zero and one. The higher Q, the more important is the network effect in comparison to the basic utility. To give an example, an e- mail system will have a network effect factor of 1.
The existence of these network effects can be the reason why the best technical system might not be adopted by the users. Therefore, often, a “lock in” into an inferior technology can be observed [David (1985), Liebowitz/Margolis (1994)]. Thus, an enterprise having an installed base on a network effect market has a substantial competitive advantage which can hardly be caught up by competitors. According to Farrell/Saloner, the installed base often avoids the switch to a superior standard due to coordination problems [Farrell/Saloner (1985)]. Their argumentation is the following: The total utility of all market users could be increased, if all market users decided for a change to a new, technically superior standard. However, because of information asymmetries it is uncertain whether such a transition actually takes place
b
c
c
Q
+
=
[Farrell/Saloner (1985), 75-79]. Due to imperfect information, the potential switcher has the problem that other market users may not follow. Then, the increase of basic utility might not compensate the lost network effect utility. This uncertainty concerning other market users can lead to the fact that enterprises remain in their current status. This coordination problem is called penguin effect [Farrell/Saloner (1987), 13-14]. The following analogy is the basis for the naming: Hungry penguins are at the edge of an ice floe. From fear of fishes of prey they hope that other penguins jump into the water first, so they can plumb the associated risk. As soon as some of the penguins dare the jump, the danger for the “free rider penguins” is reduced and they follow.
For that reason, on network effect markets we find often only a few vendors established [Besen/Farrell (1994)], offering high network effect utility to their clients. A consequence is that innovations are prevented since new vendors encounter problems entering the market. From the viewpoint of the users it is still disputed whether this constellation is problematic, due to a relatively small innovating rate, or if it is favorable because of a high compatibility [Liebowitz/Margolis (1994)].
2.2 The Market For Business Standard Software
In what respect are network effects relevant on standard software markets? Here, we concentrate on business standard software that supports for example functionalities like financial accounting, production planning, controlling or business processes. The following figure shows the distribution of the most important standard software systems in Germany and the USA [Westarp/Buxmann/Weitzel/König (1999)]:2
0 20 40 60 80 100
SAP R/3 SAP R/2 Oracle
-Appl. People-soft Baan-Triton JD. Ed-wards % of companies USA 0 20 40 60 80 100
SAP R/3 SAP R/2 Oracle-Appl. Baan-Triton
% of
companies
Germany
Figure 1: Spreading of Standard Software in the German Federal Republic and the USA
The German market is clearly dominated by SAP software. 77% of the interviewees use SAP R/3 and 48% use the predecessor SAP R/2. In contrast to this, only 16% of the interviewed enterprises are using Oracle Application and 3% Baan Triton. In the USA, Peoplesoft is the broadest system (51%), followed by SAP R/3 (40%), SAP R/2 (4%), Oracle Application (36%), J.D. Edwards (22%) and finally Baan Triton (9%).
2 These results are based on an empirical survey carried out in the summer of 1998. A questionnaire with
about 30 questions was sent to the 1000 largest companies both in Germany and the United States. 250 questionnaires were returned in Germany (25%), and 102 in the US (10,2%).
In accordance with the distinction introduced in section 2.1, direct network effects are present on markets for standard software to the extend that users of the same standard software can cooperate more easily. For example, with a common use of the SAP R/3 system, documents like sales orders or invoices on the base of the so called Idoc standard (SAP) can be easier exchanged, as if each company uses a different system. Likewise it is possible to find indirect network effects in the standard software market. These could be complementary software supplies, interfaces or consulting offers. We will return to that in the following paragraph.
Apart from this network effect utility, standard software offers a basic utility. This results from the support of business processes and is, by definition, independent of the use of software by other enterprises.
III
Strategies of Standard Software Vendors: An Overview
In the previous section we already described how difficult it is for a new vendor to enter a market with established vendors. On network effect markets the installed base plays a key role in gaining a competitive advantage, so both new and established vendors will aim at increasing their installed base. This in mind, we briefly want to examine strategies for these standard software vendors. Thereby, we use the common distinction between
§ product strategies,
§ communication strategies,
§ distribution strategies,
§ pricing strategies.
In this section we will briefly discuss the first three mentioned. In the following section we will examine pricing strategies in more detail.
Let us first consider the product strategy on standard software markets. Since we want to concentrate on strategies concerning network effects we will neglect general software quality criteria like reliability, etc. For the product strategy the design of interfaces is of special importance regarding the creation of network effects. The existence of these interfaces in the long run determines the ability of users of the systems to communicate among each other. Thereby, a trend away from specific to open and thus vendor-independent interfaces can be observed [Shapiro/Varian (1998), 206]. That is, software vendors offer interfaces enabling communication with other systems. Thus, for instance, the common web standards Java, XML, COBRA, TCP/IP or HTTP are part of the systems of vendors like Baan, J.D. Edwards, Oracle, and SAP. Besides these open interfaces, vendors offer proprietary interfaces as differentiation feature carrying different names like BOI (Business Object Interface), API (Application Programming Interface) or BAPI (Business Application Programming Interface).
Regarding the communication strategy large standard software vendors offer the classical repertoire of activities. These include press releases, direct mailing, ads, web sites etc. The announcement policy is of special importance on network effect markets [Farrell/Saloner (1986)]. Let us imagine a large software vendor who is able to offer his clients a high network effect utility in addition to the basic utility. If a new software
vendor, with a solution offering a higher basic utility due to an increased functionality, is entering the market, the clients will have the penguin problem described earlier: shall they buy the new software? If the established vendor now announces that his next version provides at least the same functionalities as the new vendor does, the clients will make the ir decision towards the established vendor. The solution of the new vendor will not enter the market. Thus the objective of the communication strategy consists of convincing the user of a future spreading of the own system. If the users believe that a certain system will become generally accepted, this will occur [Katz/Shapiro (1986) or Shapiro/Varian (1998), 14].
The distribution strategy on the standard software market is particularly characterized by cooperation. Standard software vendors are making partnerships with hardware vendors as well as other software vendors. In this case, management consultancies are of special importance because standard software usually has to be customized before it is used in the enterprises. The partnerships create indirect network effects.
After this overview of product, communication and distribution strategies we want to discuss pricing strategies in more detail.
IV
Pricing Strategies of Standard Software Vendors: A
Simulation Model
In the introduction we already mentioned examples of standard software vendors giving away their products. In this section we want to examine under which conditions penetration pricing is a promising strategy. Therefore, we developed a simulation model to analyze the influence of alternative pricing strategies of standard software vendors on the distribution of their systems.
4.1 Basis of the Simulation Model
The basic assumptions are:
1. On the market there are two vendors of standard software systems, being incompatible to each other.
2. We will analyze a time horizon of T periods. The pricing strategy of vendor 2 is given as a price vector which is well-known by vendor 1. The elements of the price vector show the prices in the periods 0 to T-1. Now we examine alternative pricing strategies for vendor 1 (p10, p11, ... p1T-1).
3. N = {1, 2, ..., n} is a set of potential users, whereby everyone makes a decision in period τ = 0 to τ = T-1 concerning the application of one of the two systems on the basis of the net present value. Thereby, he considers one-time and running costs as
well as basic and network effect utilities. Expenses of former periods are considered as sunk costs.
Now, the net present value model will be developed. First, we assume the purchase price for a user i being time-dependent. Besides the vendors can sell their systems to consumers at different prices since the prices are usually not transparent. Furthermore, let pi1τ(pi2τ) be the purchase price user i∈N has to pay for system 1 (2) in period τ. A specific feature introducing standard software is the fact that the user has to pay the purchase price as well as introduction costs. These arise predominantly from the necessity of a mutual adjustment between the business processes and the standard software. Similarly, let ai1τ (ai2τ) be the introduction costs for user i in period τ for
system 1 (2). Both costs, acquisition as well as introduction costs, come up at the begin. It is necessary to distinguish between acquisition and introduction costs, because only the first me ntioned will be revenue for the software vendor. The introduction costs are personnel costs, costs for trainings, and fees for management consultancies.
Apart from these one-time costs, users also have to bear current costs for running the system, like personnel costs. These costs for user i for system 1 (2) in period t are defined as ki1t (ki2t).
Concerning the utility, we will integrate in the model the distinction between basic utility and network effect utility which has already been addressed in sections two and three. We assume the gain user i receives of an investment in system 1 (2) is time-dependent and occurs from point in time τ+1 up to the end of planning horizon T. Both basic utility and network effect utility can be expressed in monetary units and cash flows are discounted by the factor r.
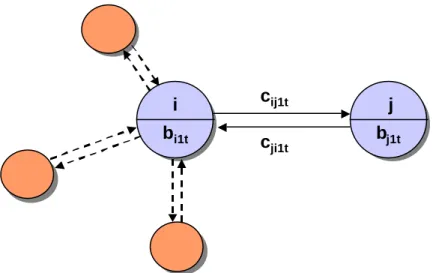
To illustrate basic and network effect utility, we imagine the users as a network, which is illustrated using nodes and edges. The users are represented by nodes while the edges represent the relationships between these nodes. Because of being independent of the systems´ distribution, we model the basic utility in the nodes. The basic utility of user i applying system 1 (2) in period t is given by bi1t (bi2t).
In contrast to the basic utility, the network effect utility depends on the distribution of the system and thus on the user’s decision. We can assign the network effect utility to the edges and define it as cij1t (cij2t). We only take direct network effects into
consideration. Since the network effe ct can be user specific, that means i profits more in communicating with j then the other way round, the edges will be modeled bi-directional.
i bi1t j bj1t cij1t cji1t
Figure 2: Basic and Network Effect Utility in the Model
To develop the net present value model, we need a binary variable xj1τ (xj2τ) which shows if system 1 (2) is used by j in period τ. We assume that user i, using system 1 (2), receives in period t a network effect utility together with user j having a value of cij1t
(cij2t), if xj1τ (xj2τ) becomes 1 [Buxmann/Weitzel/Westarp/König (1999)]. That will be the case if j uses the same system. This modelling implies the assumption of either complete compatibility or incompatibility of the systems. Likewise we assume that the presently installed base also forms the basis for future expectations. These future expectations are checked permanently. In each period the user makes a new decision concerning the application of the system. We differentiate between two scenarios. In the first scenario no system has been implemented yet. In this case the user will select the system giving the maximum net present value, if this net present value has a positive value. If net present values are negative, he will not invest. Therefore the criteria for making decisions is from the perspective of i (max(Ki1τ, Ki2τ,0)) τ = 0 to τ = T-1 with
)
1
(
)
(
1 1 1 1 ( ) 1 1 1 1 1 τ τ τ τ τ τ − − − ⋅ + +∑
∑
⋅
+
−
−
=
+ = = t t i j t ij t i i i ip
a
b
c
x
k
r
K
T t n j)
1
(
)
(
2 2 2 2 ( ) 2 2 2 1 1 τ τ τ τ τ τ − − − ⋅ + +∑
∑
⋅
+
−
−
=
+ = = t t i j t ij t i i i ip
a
b
c
x
k
r
K
T t n jIn the second scenario a system is already installed. Now the user has to decide if he likes to switch to the other system. Assuming that he already implemented system 2, the decision changes as follows:3
)
1
(
)
(
1 1 1 1 ( ) 1 1 1 1 1 τ τ τ τ τ τ − − − ⋅ + +∑
∑
⋅
+
−
−
=
+ = = t t i j t ij t i i i ip
a
b
c
x
k
r
K
T t n j 3If system 1 is implemented, then the indices for system 1 and system 2 have to be switched in the equations.
)
1
(
)
(
2 2 2 2 ( ) 2 1 1 τ τ τ τ − − − ⋅ +⋅
+
∑
∑
=
+ = = t t i j t ij t i ib
c
x
k
r
K
T t n jThe costs for system 2, that already occured in former periods, are not modeled, since we consider them as sunk costs.
4.2 Implementation and Application of the Simulation Model
Now we will take the model developed in the previous section as a basis for several simulation runs. The goal is to examine alternative pricing strategies regarding their effects on the distribution of the systems. In particular we analyze to what ext end these strategies depend on
§ the network effect factor Q,
§ the installed base of the systems,
§ the product policy which is represented in this case as the basic utility.
For our simulation analysis we proceed from the following imaginary data:
1. Two vendors of standard software face n=10 users. 2. Planning horizon T=5 periods.
3. Calculation interest rate is 5% (r=0,05).
4. Introduction costs for both systems are identical for each user, that means ai1τ= ai2τ = 900 (τ=0,...τ=T-1).
5. Running costs are identical for both systems as well as constant in the long run. We assume the following values: ki1t= ki2t= 300 (t=1,...t=T).
6. Furthermore, we assume one system having a higher functionality. This functionality is represented by a higher basic utility. Basic utilities are dependent from the users. For this reason it is possible that one user can receive a higher basic utility with the same system than another user. In order to illustrate user specific variation of the basic utility, the program assigns a random value to each user. These basic utilities are constant over the time with µ (b1) = 900, µ (b2) = 800, the random numbers are generated using a uniform distribution with [0,1800] for system 1 and [0,1600] for system 2.
7. The value of the network effect utility is determined by the basic utility and the network effect factor Q. If, for example, Q has a value of 0,5 and the generator for random numbers gives each user a basic utility bi1=810, the expected value of the network effect utility for each edge will be µ (cij1)=90.4 This process will be realized using a simulation program by generating a random number for each edge coming out of i [0,180].
On the basis of these data several simulation runs are executed. In the first step, we assume that no installed basis exists, i.e. no user is using one of the systems. Pricing
4 If Q=0.5, the network effect will equal the basic utility. If n=10 users, each user is having nine potential
communication partners. If we produce for each out-going edge of user i a network effect utility by random having an expected value of 90, the network effect utility will equal the basic utility of 810.
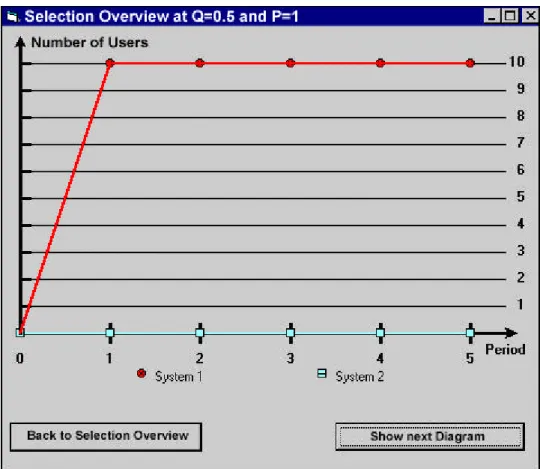
strategies are identical for each supplier and given by price vectors (300, 300, 300, 300, 300). The following figure shows the spreading of the system resulting from the users’ decisions:
Figure 3: System 1 with a higher basic utility becomes generally accepted
In the first period all users decide for system 1. The system with the higher basic utility becomes generally accepted.
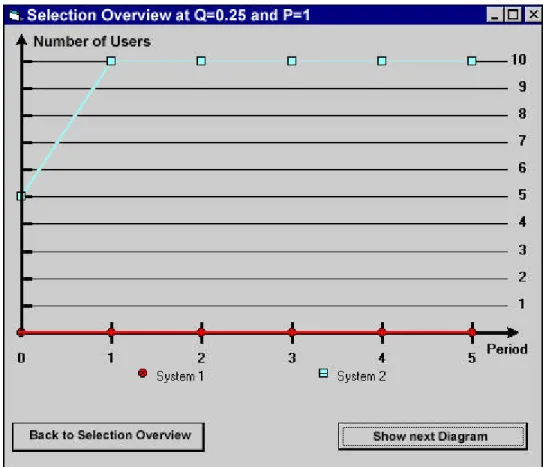
How will the results change if an installed basis exists? Let us assume, that system 2 has a market share of 50%. The network effect factor is assumed to be Q=0,25. Again, pricing strategies are identical. Users who did not implement the system yet, will decide for the system with the installed basis because it offers a network effect utility right from the start. Due to a similar situation, Apple-MacIntosh was not able to establish in the market.
Figure 4: System 2 with an installed basis becomes generally accepted
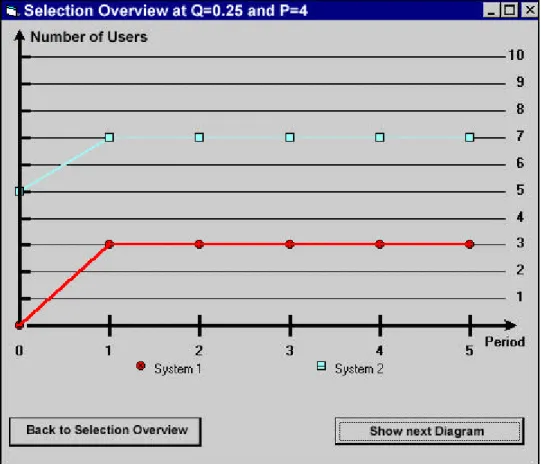
What can vendor 1 do in a situation in which the competitor has an installed base? In this case, penetration pricing, as already mentioned above, could be a possible strategy. Assuming vendor 1 enters the market with a price vector of (0, 100, 200, 300, 400). However, after the first period he will receive a share of 30% as shown in figure 5.
Figure 5: Using Penetration Pricing, system 1 receives a 30% share
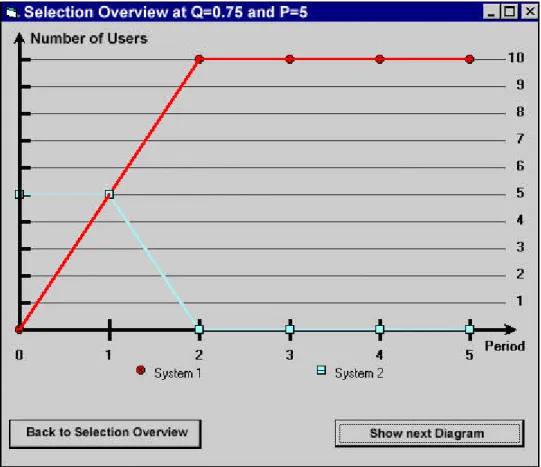
Next, we assume the same pricing strategies and installed base as in our last scenario, but a higher network effect factor. Thus, compared to the basic utility, network effects are more important. Let us assume a network effect factor of Q=0,75. Even if vendor 1 implements a low pricing strategy, he will not be able to enter the market. The system with an installed basis becomes generally accepted again.
Figure 6: Although having a low pricing strategy, system 1 is not able to enter the market
The penetration pricing strategy’s success is obviously depending on the network effect factor. What can vendor 1 do now? One possible reaction could be an extreme penetration pricing strategy: a so called “paying extra strategy”. Let us assume that vendor 1 pays its customers 5000 monetary units during the first period. The price vector is assumed being (-5000, 0, 100, 200, 300). As shown in figure 7, system 1 is able to enter the market. In the first period, we observe a share of 50% for both systems. Afterwards system 1 becomes generally accepted.
Figure 7: As a consequence of a Paying Extra Strategy, system 1 becomes generally accepted
4.3 Discussion of Results
Actually the presented results are only valid for values used in the statuated examples. However, experiments with different values lead to similar findings. Thus, our results reveal the following tendencies: On the one hand, a penetration pricing strategy is always necessary if a software vendor wants to enter a market with an installed base of a competitor´s system. In some cases, even a paying extra strategy is necessary. Furthermore, the success of penetration pricing depends on the network effect factor. The higher the network effect factor, the more necessary are low pricing strategies. However, penetration pricing is not the only possible way to enter network effect markets. For example, a possible alternative to penetration pricing for a new vendor could be to improve the functionality. This way, it is possible to increase the basic utility. In order to examine the chances of success of such a strategy, we executed further simulation runs. Starting point was the already introduced scenario in which vendor 2 has a market share of 50%. Again, the simulation results show a high sensitivity as a function of the network effect factor. Given a network effect factor of Q=0,25, it is sufficient for vendor 1 to increase the basic utility from 900 to approximately 1000, to be able to enter the market. However, assuming a network effect factor of Q=0,75, vendor 1 has to offer at least a basic utility of 2100. This means that on a market with a high network effect factor it is especially difficult for new vendors to
build up an installed base by increasing the basic utility of their products. Additionally, we have to keep in mind that such a strategy will be very time-consuming. On the one hand, this time factor will lead to lost revenues. On the other hand, the established vendor in the meantime can increase his installed base. This fact makes the situation for the new vendor even worse.
Using our model, it is possible to explain and understand the behavior of standard software vendors as well as market trends. For example, after first underestimating the Internet boom, Microsoft was able to reach a high market share with Web Browsers and Web Servers by applying a penetration pricing strategy. On the other hand, Star was not able to compete against Microsoft even though the company gave away its products. The reason was that Microsoft’s installed base had been too large. The question, whether a paying extra strategy, as proposed in the simulation runs, would have been successful, remains hypothetically. Furthermore, it is not clear for how long a paying extra strategy could have been implemented.
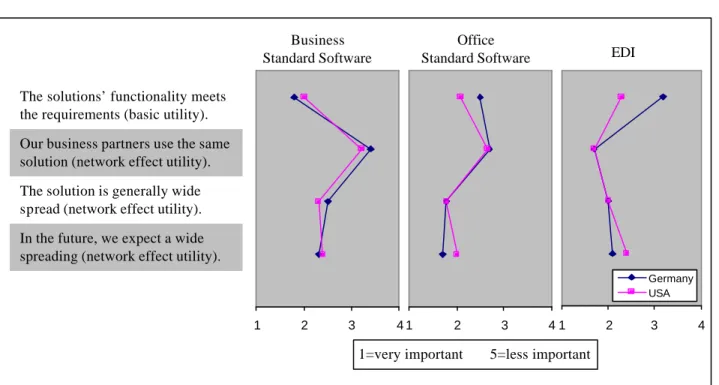
However, no penetration pricing strategy for business standard software can be observed on the business standard software markets in the US and in Germany, in spite of SAP´s dominating position. All of our four interviewed enterprises (Baan, J.D. Edwards, Oracle and SAP) negated implementing such a strategy. How can this be explained? A possible answer on the basis of our model is that the network effect factor Q is relatively small on this market. To estimate the meaning of both basic utility and network effect utility, we raised several questions in our empirical survey mentioned above. Thereby, we differentiated business standard software, office standard software, and EDI.5 A scale from 1=very important to 5=less important, was given. Figure 8 shows the profiles of network effect utility and basic utility.
Figure 8: Profile of Basic and Network Effect Utility for different Software Types
5
EDI (Electronic Data Interchange) defines the electronic interchange of business documents like orders or invoices.
1 2 3 4
1 2 3 4 1 2 3 4
Germany USA
The solutions’ functionality meets the requirements (basic utility). Our business partners use the same solution (network effect utility). The solution is generally wide spread (network effect utility). In the future, we expect a wide spreading (network effect utility).
Business Standard Software
Office
Standard Software EDI
1=very important 5=less important importanimportant
The results show that in the category business standard software the basic utility is most important while network effect utility does not play such an important role. Here we find high similarities between the evaluation of German and US American enterprises. The relatively low network effect factor is a reason for not implementing low pricing strategies in this market. However, we could not conclude the exact value of the network effect factor out of the empirical study.
Thus, the simulation model helps to explain certain phenomenon on the software market. However, the following extensions seem to be reasonable for future work: 1. The model proceeds from static expectations of the users, i.e. the current state is the basis for estimating the distribution of standards in the future. Extensions should try to model expectations depending on product, communication, pricing, and distribution strategies of vendors.
2. In the current state of the model, we assume the price vector of one vendor as given and only the other vendor can make pricing decisions. In reality, however, both vendors will observe the pricing strategies of the competitors and will make their price decisions based on these observations. Game-theory allows to develop models permitting the vendors to react on competitive strategies.
3. A substantial aspect of the pricing strategies concerns product and price bundling. This aspect deals with the question, under which circumstances it is favorable selling goods as a bundle [Olderog/Skiera (2000)]. This strategy is especially interesting for standard software vendors, because models show that the lower the variable costs, the more favorable price bundling [Bakos/Brynjolfsson (2000)]. Microsoft pursues such a bundling strategy by offering MS Office.
V
Conclusions
This paper examined pricing strategies of standard software vendors on network effect markets. The focus was the development and application of a simulation model. It showed the effects of alternative pricing strategies on the distribut ion of standards. In particular, we analyzed under which circumstances penetration pricing strategies will be necessary. The main results are the following:
§ Penetration pricing strategies are as more important, the larger the installed basis of alternative standard software systems.
§ Penetration pricing strategies are as more important for new vendors, the higher the importance of network effects, i.e. the higher the network effect factor Q.
§ If an alternative standard software system is wide spread and if it has strong network effects, it could be useful even to introduce a “paying extra strategy” to build up an installed basis.
Will standard software be free in the future? Today a free download is possible for a lot of software systems. It also was shown that giving away software or even introducing a paying extra strategy can be helpful for a new vendor trying to enter a network effect market. On the other hand, our simulation model showed that it is easy for an established vendor to sell products. Altogether, for the choice of a pricing strategy on a network effect market it is decisive whether a vendor has an installed base or not. We
do believe that due to cooperation between enterprises the importance of network effects on standard software markets will increase. Therefore, vendors offering their customers an installed basis will not have to give away software. For this reason, we believe that standard software and network effects will not be free in the near future.
References
Arthur, W. B. (1989): Competing technologies, increasing returns, and lock-in by historical events, in: The Economic Journal, 99 (March 1989), pp. 116-131.
Bakos, Y.; Brynjolfsson, E. (2000): Bundling and Competition on the Internet: Aggregation Strategies for Information Goods, in: Marketing Science,
http://www.stern.nyu.edu/~bakos/bci.pdf .
Besen, S.; Farrell, J. (1994): Choosing How to Compete: Strategies and Tactics in Standardization, in: Journal of Economic Perspectives, Vol. 8, No. 2, pp. 117-131. Buxmann, P.; Weitzel, T.; Westarp, F.; König, W. (1999): The Standardization Problem – An Economic Analysis of Standards in Information Systems, in: Proceedings of the 1st IEEE Conference on Standardization and Innovation in Information Technology SIIT ´99, pp. 157-162.
David, P. A. (1985): Clio and the economics of QWERTY, American Economic Review, Papers and Proceedings, Vol. 75, 1985, pp. 332-337.
Farrell, J.; Saloner, G. (1985): Standardization, Compatibility, and Innovation, in: Rand Journal of Economics 16, pp. 940-955, 1985.
Farrell, J.; Saloner, G. (1986): Installed Base and Compatibility: Innovation, Product Preannouncements, and Predation, in: American Economic Review 76, pp. 940 – 955. Farrell, J.; Saloner, G. (1987): Competition, Compatibility and Standards: The Economics of Horses, Penguins and Lemmings, in: H. Landis Gabel (ed.): Product Standardization and Competitive Strategy, 1987.
Katz, M. L.; Shapiro, C. (1985): Network Externalities, Competition, and Compatibility, in: American Economic Review 75, pp. 424-440.
Katz, M. L.; Shapiro, C. (1986): Technology adoption in the presence of network externalities, in: Journal of Political Economy, Vol. 94, pp. 822-841.
Katz, M. L./Shapiro, C. (1994): Systems Competition and Network Effects, Journal of Economic Perspectives, Spring, 8, pp. 93-115.
Liebowitz; S.J.; Margolis, S. (1994): Network externalitiy: An uncommon Tragedy, in: Journal of Economic Perspectives, Vol. 8; No. 2, pp. 133-150.
Olderog, T.; Skiera, B. (2000): "The Benefits of Bundling Strategies", in: Schmalenbach Business Review, Vol. 1, pp. 137-160.
Shapiro, C.; Varian, H. (1998): Information Rules: A Strategic Guide to the Network Economy, 1998.
Westarp, F.; Buxmann, P.; Weitzel, T.; König, W. (1999): The Management of Software Standards in Enterprises − Results of an Empirical Study in Germany and the US, SFB 403 Working Paper (99-7).
Westarp, F.; Weitzel, T.; Buxmann, P.; König, W. (1999): The Standardization Problem in Networks – A General Framework, in: Jakobs, K. (ed.): Standards and Standardization: A Global Perspective, Idea Publishing Group, 1999.