Estimating Individual Behaviour from Massive Social Data for An
Urban Agent-Based Model
Nick Malleson and Mark Birkin
School of Geography, University of Leeds, Leeds LS2 9JT
1 Introduction
This paper presents the most recent developments in an on-going programme of work towards a realistic agent-based model of urban dynamics. The focus of the paper is on the development of a framework for calibrating an agent-based model of urban dynamics using novel data from the Twitter social media service. In particular, we discuss initial attempts to elucidate information about peoples’ daily spatio-temporal behaviour and how such insight can be used for the benefit of agent-based models. The ultimate aim of the modelling work is to better understand the spatio-temporal movement patterns within the city.
2 Background: social media as a data source
In recent years, it has been recognised that cities have characteristics that classify them as a type of
complex system; one whose aggregate behaviour is driven by the individual actions and interactions
of its constituent parts. For this reason, aggregate urban models have the effect of smoothing out the underlying dynamism (Batty, 2005) and individual-level modelling approaches (such as agent-based modelling) have become popular for phenomena such as disease spread (Johansson et al., 2012), crime (Malleson et al., 2010) and land-use (Matthews et al., 2007). However, research efforts typically lack access to high-quality, individual-level data which makes it difficult to calibrate and validate models. Population censuses and other social surveys are often used, but these have the drawbacks of dealing with aggregate groups rather than individuals; occurring infrequently; focusing on population characteristics rather than attitudes and behaviours; and providing an a-temporal view rather than a dynamic and continuous perspective.
However, the recent popularity of new online social media services provides a valuable new source of data, commonly referred to as “crowd-sourced data” (Savage and Burrows, 2007) or “volunteered geographical information” (Goodchild, 2007). Services such as YouTube, FaceBook, Flickr, Twitter and FourSquare contain a wealth of information about peoples’ spatio-temporal be-haviour which are often disaggregate and are being continuously updated in real-time. Although a large body of research has evolved around equipping software agents with realistic human behaviour and cognition – e.g. frameworks such as BDI (Bratman et al., 1988) and PECS (Schmidt, 2000) – we are unaware of any attempts to utilise crowd-sourced data for improving agent behaviour.
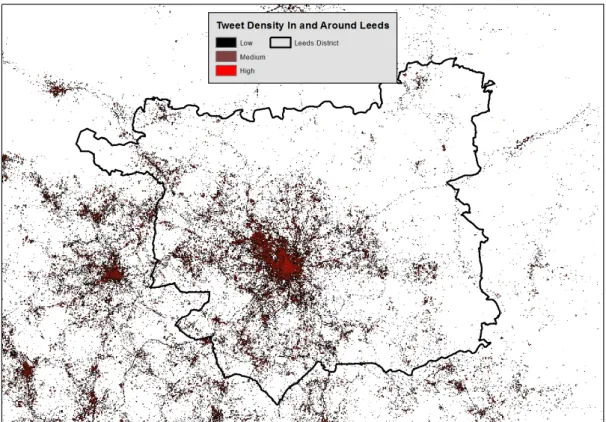
For this project, data have been collected from the Twitter service. With Twitter, users are able to create short (140-character) messages called ‘tweets’. A small percentage of these tweets – found to be 1% by Gelernter and Mushegian (2011) – which are sent from mobile devices also have accurate GPS coordinates associated with them. For this study, 400,000 individual geo-located tweets have been collected for the period June 2011 – March 2012 in the region of Leeds, UK. For context, Figure 1 illustrates the spatial density of all tweets.
3 Estimating Individual Behaviour
The ultimate aim of this research is to build an individual-level model of urban dynamics, capable of simulating the ‘ebb and flow’ of the city as people commute (with the aim to extending behaviour to include other reasons for travel). Therefore, in its current stage, individuals can occupy one of two behavioural states – ‘at home’ or ‘at work’ – and we attempt to draw inferences from crowd-sourced data about the times and spatial locations of these behaviours. Of course, travel between home and work will also be incorporated into the model, effectively leading to the additional behaviours of ‘travelling to work’ and ‘travelling home’.
Figure 1: The densities of all tweets in the data set.
The first research task is to determine which of the four behaviours the users are likely to be doing at a particular time of day through an analysis of individual Twitter messages. At this stage, behaviour is estimated simply from the spatial location of the message. Immediate future research will develop methods that also take the textual component of the post into account to create a more accurate estimate of behaviour – see, for example, Eisenstein et al. (2010).
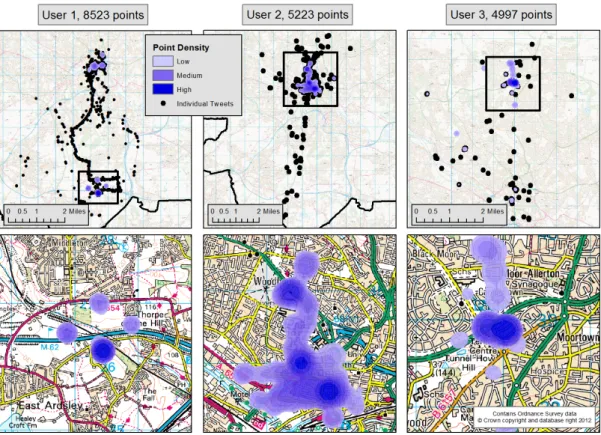
For a model that simulates commuting behaviour, it is necessary to determine whether or not an individual’s post was sent while they were at home or while they were working. The user’s home location can initially be defined as the location from which most of their tweets originate. Although this assumption will not carry for all users it is reasonable for this stage of the research. To estimate the most dense tweet location for each user, the kernel density estimation (KDE) algorithm was used to calculate the point density associated with each user’s tweets. Rather than applying the algorithm to each cell in a regular grid, as is typical, it was applied to the user’s individual tweet locations, providing a density measure at every place they sent a message from. The point with the highest density was assumed to be the home location for that user. For example, Figure 2 illustrates the tweet locations and associated densities for some users; clear ‘home’ locations emerge as well as other significant anchor points (e.g. where users work and socialise). Interestingly, travel patterns also appear to emerge and methods to utilise these data will be developed as future work. Having estimated where each user lives, it becomes possible to build a profile of their daily activity relative to their home. For the moment, it is assumed that all tweets within 50m of a user’s home indicate that they are ‘at home’, otherwise they are assumed to be ‘at work’. Future research will also attempt to identify work (or other non-home) locations from the data. As the current research focusses on commuting behaviour, a single profile is created for each user to represent theiraverage weekday behaviour. Profiles that indicate what the expected behaviour for each user will be during a given hourly weekday time period are created as follows:
1. For each user, count the number of posts that originate from their home and from elsewhere in each hour of the day. To capture commuting behaviour, only data for the days Monday –
Figure 2: The tweet locations and associated densities for a selection of prolific users.
Thursday are used (it is assumed that the proximity to the weekend will distort behaviour on Fridays).
2. Set the behaviour in each time period to be ‘at work’ or ‘at home’ depending on which behaviour has the larger number of tweets counted in (1). Where a user has not published any tweets for a given time period, a no-data value is assigned.
3. Remove no-data points by interpolating between the nearest known behaviours. A form of linear interpolation is used whereby the first half of a sequence of no-data values are set to the behaviour of the prior time period, and the second half are set to the known behaviour following the sequence.
Figure 3 provides some example activity profiles for a selection of users. Cell colours represent the behaviour during that hourly time interval. To gain an understanding of the overall nature of the profiles, Figure 4 presents the proportions of each behaviour in each time period for all users. It is clear that there are more ‘at work’ behaviours during the day and a greater proportion of ‘at home’ tweets in the evening. This is encouraging as it suggests that the behaviour profiles are capturing the commuting behaviours that were expected.
4 Building an Individual-Level Model
By creating activity profiles from the spatio-temporal behaviour of individual Twitter users, we have laid the groundwork for a new agent-based model of urban dynamics which is currently under development. Our aim is to use data from social networks, in conjunction with other sources such as population censuses, to provide novel ways of seeding, calibrating and validating the agent-based model. This section will briefly review the new model and discuss how the new social data will be incorporated.
!"#$ %%&%% %'&%% %(&%% %)&%% %*&%% %+&%% %,&%% %-&%% %.&%% %/&%% '%&%% ''&%% '(&%% ')&%% '*&%% '+&%% ',&%% '-&%% '.&%% '/&%% (%&%% ('&%% ((&%% ()&%% 01$234 ' ' ' ) ) ) ) ) ' ' ' ' ' ' ' ' ' ) ) ) ' ' ' ' 5$6 01$237 ' ' ' ' ' ' ' ' ) ' ' ' ' ) ' ' ' ' ' ' ' ' ' ' 893:;#$ ' 01$23< ' ' ' ' ' ' ' ' ' ' ' ' ' ' ) ) ) ) ) ) ' ) ' ' 893=;2> ) 01$23? ) ) ) ) ) ) ) ) ) ) ) ) ) ) ) ) ) ) ) ) ) ) ) ) 01$23$ ' ' ' ' ) ) ) ) ) ) ) ) ) ) ) ) ) ' ' ' ' ' ' ' 01$23@ ) ) ) ) ) ' ' ' ' ' ' ' ' ' ' ' ' ) ) ) ) ) ) ) 01$23A ' ' ' ' ' ' ' ' ' ' ' ' ' ' ' ) ' ' ' ) ) ) ' ' 01$23B ) ) ) ) ' ' ' ' ' ' ' ) ' ) ) ) ) ) ) ) ) ) ) ) 01$23" ' ' ' ' ) ) ) ) ) ) ) ) ) ) ) ) ) ) ) ) ) ) ' ' 01$23C ' ' ' ' ' ' ' ' ' ' ' ' ' ' ' ' ' ' ' ) ) ) ' '
Figure 3: Example activity profiles for an average weekday for a number of users.
0.03 0.035 0.04 0.045 0.05 0.055 00:00 03:00 06:00 09:00 12:00 15:00 18:00 21:00 Pro po rt io n of tw ee ts
Average weekday activities (Mon - Thurs) At Home
Away from Home
Figure 4: The proportions of tweets corresponding to ‘home’ or ‘work’ activities for an average weekday (all Monday – Thursday tweets) for all users.
The first stage of the modelling process is to generate a selection of individuals to populate the model. For this task, the technique of microsimulation can be used to disaggregate the 2001 UK census (and the 2011 census when it becomes available); generating a synthetic list of individual people and households (Birkin et al., 2006; Harland et al., 2012). Each individual has a number of attributes (e.g. age, gender, ethnicity) which can be used in later research to tailor their behaviour. Households are geo-referenced to the resolution of the smallest census area boundary (called an ‘output area’) and with the incorporation of additional spatial building data they can be assigned to distinct houses (Malleson and Birkin, 2011). Individuals’ work locations can be estimated from UK census journey to work data by identifying an agent’s most likely work location from their home location and their individual attributes. Hence the initial population of agents is a close representation of the underlying urban population.
The next step in the modelling process will be the construction of simple commuter agents who travel (once) to and from work every day in the model cycle. Each agent will be characterised by residential location and workplace destination, their times of departure and arrival, and the duration of their journey. The matrix of flows from home to work will be simulated using a spatial interaction model calibrated to the crowd-sourced data (Birkin et al., 2011). A simplifying assumption at this stage will be that agents travel at a constant speed and in a straight line from home to work, although constraining and allocating the flows to transport networks is planned as a future objective.
The distribution of times at which the agents leave home and leave work, the times at which they arrive and the lengths of the working day will be estimated as parameters in a genetic algorithm (GA). Fitness of the GA can be calculated by comparing the proportion of time that agents spend at home and at work at different times of day to the data from Twitter (e.g. the data presented in Figure 4). Hence the research will generate a temporally realistic, spatially-explicit model of individual commuting behaviour, calibrated using novel crowd-sourced data.
5 Challenges
Although crowd-sourced data offer a potentially invaluable source of information about individual peoples’ behaviour, there are a number of challenges that must be addressed before the data can be used in earnest. These include, among others, issues around ethics, representation and realism. As the whole concept of crowd-sourced / volunteered data is relatively new, ethical frameworks for using the data in research are still under-developed. Messages posted on public forums (includ-ing Twitter) are inherently accessible to the general public and hence do not fall under the remit of traditional human-subject research. However, it is possible that users are naively unaware of the amount of information they reveal about themselves when they use social networking services. Although early work in this area suggests that users do not need to be asked for consent and uni-versity ethics committee consideration need not be sought (Wilkinson and Thelwall, 2011), more work in this area is clearly needed.
In terms of representing the underlying population, deriving data solely from social-networking services will clearly lead to considerable biases. Immediate work is required to estimate which sections of society do not use social-networking services and hence who will not be captured in our analysis. Even populations that are well represented by Twitter might not be well represented in our data because only a small percentage of tweets – potentially as low as 1% (Gelernter and Mushegian, 2011) – are geo-coded. A way to address the problem of representation will be to combine the Twitter data with those form other sources, such as population censuses or records from government organisations. In this manner it might be possible to synthesise the individuals who are absent from social-network data.
The final challenge that must be considered promptly relates to the accuracy of the data. For example, the activity profiles depicted in Figure 3 contain an individual who appears to work 24 hours a day. This suggest that, as we might expect, an analysis of the locations of twitter messages
in isolation is insufficient to establish a person’s behaviour. Here, we expect that the coupling of
text mining techniques with traditional spatial analysis (e.g.“spatio-temporal text mining”) will provide a means of more accurately classifying a person’s behaviour.
6 Conclusions and Ongoing Research
This paper has presented a novel effort to classify individual behaviour from the spatial location of twitter messages. Ultimately the data will be used, with other sources, to improve the process of validation for an agent-based model of urban dynamics. Although current behaviours are limited to commuting to work, the intention is to extend this to a broader range of behaviour including shopping, socialising, education, etc (see Yang et al. (2008) for example). Immediate future work will focus on improving the interpolation method in users’ activity profiles and taking the textual content into of messages into account as well as their spatial location. The research programme is in early stages and there are many questions that wait to be addressed – such as how to account for the considerable biases in social media data – but early results suggest there is promise in the use of these types of data for the benefit of agent-based modelling efforts.
References
Batty, M. (2005). Agents, cells, and cities: new representational models for simulating multiscale urban dynamics. Environment and Planning A 37, 1373–1394.
Birkin, M., N. Malleson, A. Hudson-Smith, S. Gray, and R. Milton (2011). Calibration of a spatial simulation model with volunteered geographical information. International Journal of
Geographical Information Science 25(8), 1221–1239.
Birkin, M., A. Turner, and B. Wu (2006). A synthetic demographic model of the UK population: Methods, progress and problems. In Proceedings of the Second International Conference on
e-Social Science, Manchester, UK.
Bratman, M. E., D. J. Israel, and M. E. Pollack (1988). Plans and resource-bounded practical reasoning. Computational Intelligence 4(3), 349–355.
Eisenstein, J., B. O’Connor, N. A. Smith, and E. P. Xing (2010). A Latent Variable Model for Geographic Lexical Variation. InEMNLP ’10 Proceedings of the 2010 Conference on Empirical
Methods in Natural Language Processing. Stroudsburg, PA, USA: Association for Computational
Linguistics.
Gelernter, J. and N. Mushegian (2011). Geo-parsing Messages from Microtext. Transactions in
GIS 15(6), 753–773.
Goodchild, M. (2007). Citizens as sensors: the world of volunteered geography. GeoJournal 69, 211–221.
Harland, K., M. Birkin, A. Heppenstall, and D. Smith (2012). Creating realistic synthetic popu-lations at varying spatial scales: A comparative critique of microsimulation techniques. Journal
of Artificial Societies and Social Simulation 15(1).
Johansson, A., M. Batty, K. Hayashi, O. Al Bar, D. Marcozzi, and Z. Memish (2012). Crowd and environmental management during mass gatherings. The Lancet Infectious Diseases 12(2), 150–156.
Malleson, N. and M. Birkin (2011). Towards victim-oriented crime modelling in a social science e-infrastructure. Philosophical Transactions of the Royal Society A: Mathematical, Physical and
Engineering Sciences 369(1949), 3353–3371.
Malleson, N., A. Heppenstall, and L. See (2010). Crime reduction through simulation: An agent-based model of burglary. Computers, Environment and Urban Systems 34(3), 236–250.
Matthews, R., N. Gilbert, A. Roach, J. Polhill, and N. Gotts (2007). Agent-based land-use models: a review of applications. Landscape Ecology 22(10), 1447–1459.
Savage, M. and R. Burrows (2007). The Coming Crisis of Empirical Sociology. Sociology 41(5), 885–899.
Schmidt, B. (2000). The Modelling of Human Behaviour. Ghent, Belgium: Society for Computer Simulation International.
Wilkinson, D. and M. Thelwall (2011). Researching Personal Information on the Public Web: Methods and Ethics. Social Science Computer Review 29(4), 387–401.
Yang, Y., P. Atkinson, and D. Ettema (2008). Individual space–time activity-based modelling of infectious disease transmission within a city. Journal of The Royal Society Interface 5(24), 759–772.