Weyerhaeuser Company Limited
Tree Farm Licence 39
Type 2 timber supply analysis
in support of an
Incremental Silviculture Program
March 2001
Prepared by
Executive Summary
This report describes a Type 2 timber supply analysis of incremental silviculture
opportunities in TFL 39, held by Weyerhaeuser Company Ltd. The analysis
uses the Forest Service Simulator (FSSIM) to assess interactions between
silviculture and timber supply. The analysis assumes static, current conditions
for relative timber values and social use of the forest.
The analysis inspects a broad range of incremental silviculture treatments, as
identified at two workshops held with Forest Renewal BC, Ministry of Forests
and Weyerhaeuser foresters. Specific treatments and treatment combinations
(regimes) are tested for their ability to meet timber quality, harvest level, and
wildlife habitat objectives. Some treatments are found to have negative impacts,
while others are substantially positive. Table 9 provides a ranking of the
treatment alternatives.
The analysis demonstrates that if all identified suitable forest areas were
treated according to discussions at the workshop and corresponding
assumptions in the analysis, $16.1 million might be spent annually in TFL 39 on
incremental silviculture activities. From among these candidate investments, a
recommended silviculture program with a budget of $3.8 million is presented in
Table 11. This budget level is a 25% increase from recent silviculture levels in
TFL 39.
Investment of $3.8 million will increase future harvest levels by 3.4%, or
114,000 m³/yr. The investment will also improve visual scenery values.
Approximately 15% of the budget is allocated to wildlife habitat restoration.
Incremental silviculture activities will directly create an estimated 35 full time
equivalent jobs. Increased harvest levels will result in 210 direct and indirect
jobs within 20 years and 480 jobs in the longer term. Including income taxes
and stumpage fees, government will realize a return of $7.8 million from the
investment.
There are many uncertainties inherent in such an analysis, including stand
responses to silviculture, selection of appropriate treatment areas, and
economic assumptions projected over long time horizons. The analysis
attempts to make reasonable estimates within the scope of the existing
information.
Acknowledgements
This project was funded by Forest Renewal BC and administered by the British
Columbia Ministry of Forests, Vancouver Forest Region, by contract with Weyerhaeuser
Company Ltd. Weyerhaeuser contracted with Olivotto Timber, Forest Modelling
Consultants to conduct the analysis, facilitate the workshops and produce this report.
Sincere thanks are expressed to the participants at the two Workshops, held in
Campbell River and Nanaimo, for their time and valuable input. The following people
attended the workshops:
Karl Brand
Ministry of Forests, Port McNeill
Jim Davis
Forest Renewal BC, Campbell River
Ron Diederichs
Ministry of Environment, Lands and Parks, Campbell River
Glen Dunsworth
Weyerhaeuser, Nanaimo
Rod Hillyard
Olivotto Timber, Victoria
Cindy Fife
Weyerhaeuser, Campbell River
Bud Koch
Ministry of Forests, Victoria
Peter
Kofoed
Weyerhaeuser,
Nanaimo
Ken Mackenzie
Weyerhaeuser, Campbell River
Diane
Medves
Weyerhaeuser,
Nanaimo
Barry Miller
Ministry of Forests, Powell River
Gerrard Olivotto
Olivotto Timber, Victoria
Mark Scott
Ministry of Forests, Powell River
Larry Sigurdson
Ministry of Forests, Nanaimo
Rod Tysdal
Weyerhaeuser, Powel River
Table of Contents
Page
Executive Summary ... ii
Acknowledgments ... iii
1.0 Introduction and Basic Data ... 1
1.1 Description of TFL 39 ... 2
1.2 Timber growth and yield ... 7
1.3 Base case harvest forecast ... 7
1.4 Objectives of the silviculture program ... 10
1.4.1 TFL 39 objectives ... 10
1.4.2 Provincial goals ... 10
1.4.3 Provincial objectives ... 10
1.4.4 Regional objectives ... 11
2.0 Issues Affecting Timber Supply ... 11
2.1 Variable retention harvesting practices ... 11
2.2 Visual quality forest cover requirements ... 12
2.3 Minimum harvest ages ... 13
2.4 Second growth volumes ... 14
2.5 Genetic gain assumptions ... 14
2.6 Methods of analysis of silviculture opportunities ... 15
3.0 Incremental silviculture history and current program priorities ... 16
3.1 Current incremental silviculture history ... 16
3.2 Workshops discussion sessions ... 17
4.0 Test of opportunities to increase volume production ... 18
4.1 Fertilization of maturing Douglas-fir stands ... 18
4.2 Fertilization of poor site cedar/hemlock stands at establishment ... 19
5.0 Comparison of potential volume production treatments ... 20
6.0 Volume production strategy ... 21
7.0 Objectives to improve timber quality ... 22
8.0 Methods to improve timber quality ... 22
8.1 Increase stand diameters ... 22
8.1.1 Pole thinning and commercial thinning ... 25
8.2 Pruning for clear volume production ... 26
8.3 Conversion of natural hemlock regeneration to planted Douglas-fir stands ... 28
9.0 Preferred timber quality strategies ... 31
10.0 Returns to timber quality investments ... 32
11.0 Wildlife habitat enhancement ... 34
12.0 Working Targets ... 37
13.0 Incremental Silviculture Program ... 40
14.0 Jobs, Income and Revenue ... 43
List of Tables
TABLE 1. Administration and allowable annual cut apportionment for TFL 39 ... 4
TABLE 2. Derivation of the timber harvesting land base ... 5
TABLE 3. Summary of short- and long-term base case harvest levels by block ... 9
TABLE 4. Historical spending levels for incremental silviculture ... 16
TABLE 5. Summary of objectives, treatments and candidate stands modelled ... 17
TABLE 6. Potential gains in LTHL with pre-harvest fertilization of high and good site Douglas-fir ... 18
TABLE 7. Potential gains in LTHL with SCHIRP fertilization of poor site hemlock ... 20
TABLE 8. Summary comparison of outputs for the three quality regimes ... 33
TABLE 9. Ranking of the incremental silviculture treatments ... 38
TABLE 10. Areas suitable for treatment regimes, and cost of the regimes ... 39
TABLE 11. Recommended silviculture program ... 40
List of Figures FIGURE 1. Key map to the location of supply blocks in TFL 39 ... 2
FIGURE 2. THLB area distribution by species and site index 6 FIGURE 3. THLB age class distribution ... 6
FIGURE 4. Base case harvest forecast for TFL 39 ... 8
FIGURE 5. Growing stock levels over time for the base case ... 9
FIGURE 6. Harvest level effect of increased and decreased levels of variable retention ... 12
FIGURE 7. Harvest levels with more constraining visual quality requirements ... 13
FIGURE 8. Harvest levels with minimum harvest ages increased 10 years ... 13
FIGURE 9. Harvest levels with second-growth volumes changed ± 10%. ... 14
FIGURE 10. Harvest levels with the genetic gain assumptions removed from the base case ... 15
FIGURE 11. Block 1 areas aerial fertilized and yield gains with all candidate stands treated ... 19
FIGURE 12. Block 6 areas SCHIRP fertilized and yield gains with all candidate stands treated ... 20
FIGURE 13. Y-XENO diameter comparisons for candidate treatments ... 23
FIGURE 14. Y-XENO volume comparisons for candidate treatments ... 24
FIGURE 15. TFL 39 harvest levels with a spacing and thinning program applied in all suitable stands ... 25
FIGURE 16. TFL 39 gain in average harvested diameters with a spacing and thinning program in all suitable stands ... 25
FIGURE 17. Block 1 harvest levels and pruned log volumes with a spacing, pruning and fertilization regime at 400 sph ... 27
FIGURE 18. Block 1 harvest levels and pruned log volumes with a spacing, pruning and fertilization regime at 800 sph ... 27
FIGURE 19. Hemlock versus Douglas-fir volume development on site index 29 for each species .. 29
FIGURE 20. Block 1 long-term increase in Douglas-fir representation in the harvested profile ... 30
FIGURE 21. Block 2 long-term increase in Douglas-fir representation in the harvested profile ... 30
FIGURE 22. Species conversion costs for Blocks 1 and 2 ... 32
FIGURE 23. Block 1 harvest flow with the old seral age requirement reduced to 110 years ... 35
FIGURE 24. Block 1 increased short-term harvest level with variable density treatments in the riparian zone (outside the THLB) ... 36
FIGURE 25. Block 1 reduced harvest levels with variable density spacing of 40 year old natural- origin stands within the THLB ... 36
FIGURE 26. Effect of the recommended silviculture budget on harvest levels ... 42
Appendices Appendix 1. Cost and Employment Assumptions ... 45
1. Introduction and Basic Data
Tree Farm Licence (TFL) 39 is held by Weyerhaeuser Company Ltd. As part of its licence obligations, Weyerhaeuser must submit to government every five years a management plan that describes conditions and planned activities within TFL 39. This report, funded by Forest Renewal BC, partial fulfills of those obligations.
This report describes a Type 2 timber supply analysis of incremental silviculture opportunities in TFL 39. A Type 1 analysis uses existing published documents to estimate potential gains and budgets for silviculture investment. A Type 2 analysis uses a standard model to explicitly test interactions between silviculture activity and timber supply. A Type 3 analysis develops custom models to assess habitat conditions and other forest attributes that may be influenced by silviculture.
The analysis uses the Forest Service Simulator (FSSIM) to assess interactions between silviculture and timber supply. FSSIM models of each timber supply block in TFL 39 were developed in the summer of 2000 as part of the Management Plan #8 (MP#8) analysis for the Timber Supply Review (TSR2). The same models were then expanded to include silviculture treatments of interest to this project and Weyerhaeuser. Expansions added ability to track log size and quality, thinning yields, budget expenditures and job creation. All the components of the TSR2 models, including compliance with Forest Practices Code forest cover requirements and recognition of Weyerhaeuser’s forest stewardship practices were retained in the models.
TFL 39 is modelled as six separate sustained yield units. Fifteen silviculture scenarios were modelled in some units, and five attributes were reported for most scenarios. A data CD, attached as Appendix 4, includes maps of the blocks and detailed graphical summaries of inputs and outputs for the analysis, organized with an HTML interface for easy viewing with a web browser.
Managing a forest for product objectives is a very long-term issue. The shortest time to harvestable return on investment in the analysis is 7–21 years for aerial fertilization. Many treatments, such as prompt stand establishment, have an investment horizon of 50 years or more. Market conditions and social preferences can change dramatically over that length of time. Unable to predict the direction of change, this analysis assumes static, current conditions for relative timber values and social use of the forest.
The timber supply analysis report for MP#8 (September 2000) is included on the data CD. This section presents highlights from that report describing the TFL 39 land base and the base case results of the timber supply analysis. Section 2 of this report highlights some sensitivity analyses in the MP#8 analysis that may be interpreted for assessment of silviculture issues. This analysis may be considered an extension of the MP#8 analysis, which together with the map-based 20-year plan, forms a cohesive description of management direction in TFL 39. Figure 1 illustrates the location of TFL 39 on the coast of British Columbia.
Charlotte Islands, and smaller islands along the coast. TFL 39 is managed by four Weyerhaeuser timberlands operations; Queen Charlotte (Queen Charlotte Islands), Port McNeill, North Island (north of Campbell River), and Stillwater (Powell River). Figure 1 shows a key map of the supply blocks. TFL 39 is divided into six working circles (Blocks 3 and 4 are combined into one working circle). This analysis separately models current management within each working circle and reports aggregated results.
TFL 39 covers 801,393 ha in total, of which 68% is stocked with productive forest. The majority of this area is in the Coastal Western Hemlock biogeoclimatic zone, with some higher elevation areas in the Mountain Hemlock zone. The dominant tree species is western hemlock, although stands of Douglas-fir are common in southern areas. The total area considered available and suitable for timber production is 369,970 ha, which is 67% of the productive forest and 46% of the total TFL 39 area. Approximately 43% of the area suitable and available for timber production is presently stocked with old-growth stands, and the remaining 57% is stocked with regenerating forest up to 130 years of age.
The annual allowable cut (AAC) for TFL 39 is 3.74 million m³/yr. This harvest rate is apportioned among the supply blocks as listed in Table 1.
TABLE 1. Administration and allowable annual cut apportionment for TFL 39.
Supply Block
Block Name MoF Forest District Weyerhaeuser
Operations
AAC contribution (m³/yr)
Block 1 Powell River Sunshine Coast Stillwater 445,000 Block 2 Adam River Campbell River North Island 1,335,000 Block 3|4 Coast Islands|Port Hardy Port McNeill Port McNeill 415,000 Block 5 Phillips River Campbell River Stillwater 100,000 Block 6 Queen Charlotte Islands Queen Charlotte Queen Charlotte 1,210,000
Block 7 Namu Mid-Coast Port McNeill 195,000
Sub-total TFL 39 3,700,000
Deciduous (Not block specific) 40,000
Total AAC TFL 39 3,740,000
Weyerhaeuser maintains the land base and forest inventory information for TFL 39 in a geographic information system (GIS). The inventory describes in great detail the geographic location, area and nature of forest cover and administrative boundaries. The inventory includes information for all areas within TFL 39. However, many areas do not contribute to the timber harvesting land base (THLB). These areas are sequentially removed in a netdown process when building the THLB description for the timber supply models. Table 2 summarizes the netdowns for each working circle.
TABLE 2. Derivation of the timber harvesting land base
Netdown category Block 1 Block 2 Block 3|4 Block 5 Block 6 Block 7 TFL 39
(ha) (ha) (ha) (ha) (ha) (ha) (ha)
TFL 39 total area 186,979 203,065 67,288 47,411 240,311 56,339 801,393 Non-forest 34,983 4,756 3,518 12,731 12,112 6,169 74,269 Non-productive 55,562 28,031 8,364 19,588 35,163 20,283 166,991 Permanent roads 1,893 4,414 1,663 298 3,460 164 11,892 Productive forest 94,542 165,864 53,743 14,793 189,576 29,723 548,241 Inoperable 4,349 6,985 501 1,739 1,135 1,388 16,096 Environmentally sensitive 7,331 19,514 3,333 2,836 28,863 5,680 67,556 Mapped riparian 2,972 5,567 2,060 348 9,284 1,032 21,264 Uneconomic 1,382 2,003 1,077 315 7,909 2,950 15,636 Deciduous 1,189 744 139 17 833 2 2,924 Unmapped riparian 773 1,310 466 95 1,416 187 4,247
Wildlife tree patches 2,295 3,113 1,496 189 2,803 185 10,081 Variable retention patches 4,187 9,376 2,328 1,169 15,251 5,105 37,415
Culturally modified trees 0 0 0 0 3,052 0 3,052
Net current THLB area 70,064 117,251 42,343 8,086 119,030 13,196 369,970
Less future roads 2,003 3,063 810 89 4,061 420 10,446
Long-term THLB area 68,061 114,188 41,533 7,997 114,969 12,776 359,524
Figure 2 shows the present composition of forests within the THLB by leading species and site class, and whether old- or second-growth timber. The two species groups are modelled. The Douglas-fir group includes lodgepole pine and yellow-cedar stands, and the hemlock group includes spruce, balsam fir and western redcedar. Four site classes are defined in the models: high (SI 33+), good (SI 27-30), medium (SI 21-24), and poor (SI 12-18). The THLB is presently stocked 82% with hemlock and 18% with Douglas-fir. The THLB is 22% high site, 41% good site, 24% medium site, and only 12% poor site. Younger stands generally occur on the better growing sites within the THLB.
FIGURE 2. THLB area distribution by species and site index.
Figure 3 illustrates the distribution of area within the THLB by age class. The older forest (>130 years) occupies 43% of the THLB area and is 90% hemlock. Older second-growth (ages 33–130 years) occupies 25% of the THLB and is 68% hemlock. The youngest class of forest (less than 33 years old) occupies 31% of the THLB and is 84% hemlock. The Douglas-fir inventory mainly occurs (46%) in the 33–130 yr age class.
0 2 0 4 0 6 0 8 0 1 0 0 1 2 0 1 4 0 1 6 0 H ig h G o o d M e d iu m P o o r H ig h G o o d M e d iu m P o o r S p e c i e s a n d s it e i n d e x A r e a ( 0 0 0 h a ) H e m lo c k D o u g la s - f ir O ld e r th a n 1 3 0 Y e a r s Y o u n g e r t h a n 1 3 0 Y e a r s 0 1 0 2 0 3 0 4 0 5 0 6 0 7 0 8 0 9 0 1 0 0 0 5 0 1 0 0 1 5 0 2 0 0 2 5 0 3 0 0 3 5 0 A g e in Y e a r s A r e a ( 0 0 0 h a ) + D o u g la s - f ir H e m lo c k
1.2 Timber growth and yield
The Weyerhaeuser in-house growth and yield model Y-XENO was used to develop estimates of existing timber volumes, future regenerated volume development and responses to silviculture treatments. Y-XENO is calibrated to approximately 2,200 company growth and yield plots in coastal British Columbia, 900 of which are located within TFL 39. Most of the plots are located in Douglas-fir and hemlock stands. Y-XENO accepts inputs for species, growing site quality, establishment density, establishment site occupancy, planted and natural stand establishment, and thinning and spacing treatments. Y-XENO simulates growth of an individual stand according to the input parameters, and reports total and merchantable volumes, average stand diameters, height, basal area, and stocking over time.
Yield adjustments (reductions) applied to the Y-XENO yield tables include losses for decay, waste and breakage (Douglas-fir 5%, hemlock 6.5%), losses to insects (2%), and deductions for incomplete stocking (6% in Blocks 1 and 5, 4% elsewhere). The yield tables assigned to future regenerated stands are additionally reduced by 30% in the Old Growth zone, 11% in the Habitat zone, and 3% in the Timber zone to account for competition effects from in-block variable retention patches. For the base case, yields for future planted stands assume genetic gains of 13% for Douglas-fir and 6.5% for hemlock.
Stocking levels in stands regenerating after harvest are modelled according to a biological probability matrix. Weyerhaeuser has developed a set of assignment matrices that describe the probabilities of a regenerating stand developing along particular pathways. Each stand type (species and geographic location) may have up to 10 post-harvest development pathways. Using local knowledge and professional judgement, Weyerhaeuser has developed a grid of assignment probabilities for the proportion of each stand that would follow each pathway. Some pathways involve planting with varying degrees of natural in-seeding, while other pathways consist of varying degrees of low-, medium-, or high-density natural regeneration.
Timber stands must reach 350 m³/ha before being harvested in the timber supply model. This volume is achieved by 40 years of age on some high-site hemlock stands, and not until 200 years of age for lower-density poor-site Douglas-fir stands.
1.3 Base case harvest forecast
The TFL 39 harvest flow was modelled in five-year periods for the first 20 years and in decades for subsequent planning periods. Figure 4 shows the base case harvest forecast for TFL 39. An initial harvest level of 3.66 million m³/yr is maintained for the first 5-year period. This is followed by an orderly decline in the harvest level, to a long-term sustainable level of 3.33 million m³/yr, 9.1% lower than the starting level. The harvest level declines at an average rate of 1.3% per 5-year period. Unsalvaged losses to natural forces such as insects, fire, windthrow, and disease are
estimated to be 36,600 m³/yr (1% of the harvest level) and have been subtracted from all harvest forecasts shown in this report.
FIGURE 4. Base case harvest forecast for TFL 39.
Figure 4 also illustrates the transition from the harvest of old-growth timber stands to the harvest of managed second-growth stands. In the first period the harvest consists of 2.92 million m³/yr of old-growth timber and 0.74 million m³/yr of older second-growth timber. The ratio of old-growth harvesting to second-growth harvesting is 80:20. By 20 years from now the ratio becomes 53:47; thereafter second-growth harvesting contributes the majority of the cut.
Figure 5 illustrates the standing inventory (growing stock) and the changing composition of the future forest under the base case harvest flow. The categories in Figure 5 identify the forest according to stand ages now. For example, at year 50 in the planning horizon, the area identified as “N”, which then constitutes 50% of the TFL 39 growing stock, would be 50 to 83 years old. The volume of standing growing stock stabilizes at 117 million m³, down 23% from the current
standing volume of 151 million m³. The long-term growing stock divided by the long-term harvest level (117/3.33 = 35) indicates a conservative ratio of forest conditions in TFL 39 — on average, 35 year’s worth of harvest volume is standing in the forest at any time in the long term.
0 5 0 0 1 0 0 0 1 5 0 0 2 0 0 0 2 5 0 0 3 0 0 0 3 5 0 0 4 0 0 0 0 5 0 1 0 0 1 5 0 2 0 0 2 5 0 Y e a r s f r o m n o w V o lu m e ( 0 0 0 m 3 /y r ) K R Z N Z - O ld G r o w th K - S e c o n d G r o w t h > = 3 3 y r s N - S e c o n d G r o w t h < 3 3 y r s R - R e g e n e r a t e d 3 , 6 6 0 ,0 0 0 m 3 / y r 3 , 3 2 6 , 8 1 0 m 3 / y r
FIGURE 5. Growing stock levels over time for the base case.
Table 3 summarizes the MP#8 base case short- and long-term harvest flows for each supply block. Refer to Table 2 for land base area summaries. The MP#8 report contains graphs for each supply block similar to Figures 4, showing the transition of harvesting from old- to second-growth timber. These modelled harvest levels form the base case for the present analysis.
TABLE 3. Summary of short- and long-term base case harvest levels by block.
Supply First-period Long-term Difference:
block harvest level harvest level first-period vs.
(m³/yr) (m³/yr) long-term (%)
Block 1 550,000 668,316 21.51 Block 2 1,335,000 1,079,207 -19.16 Block 3|4 400,000 400,000 0.00 Block 5 95,000 72,397 -23.79 Block 6 1,150,000 1,029,702 -10.46 Block 7 130,000 77,189 -40.62 Total TFL 39 3,660,000 3,326,811 -9.10 0 2 0 0 0 0 4 0 0 0 0 6 0 0 0 0 8 0 0 0 0 1 0 0 0 0 0 1 2 0 0 0 0 1 4 0 0 0 0 1 6 0 0 0 0 0 5 0 1 0 0 1 5 0 2 0 0 2 5 0 Y e a r s fr o m n o w V o lu m e (0 0 0 m 3 ) Z K N R Z - O ld G r o w th K - S e c o n d G ro w th > = 3 3 y r s N - S e c o n d G r o w th < 3 3 y r s R - R e g e n e ra te d
1.4 Objectives of the silviculture program
1.4.1 TFL 39 objectives
The objective of Weyerhaeuser’s TFL 39 silviculture plan is to ease the transition to the long-term harvest level (LTHL) and to increase the LTHL. Weyerhaeuser also wants to provide employment opportunities that are related to silviculture activities.
Weyerhaeuser recognizes that silviculture activities can enhance habitat values. Treating areas otherwise reserved, according to the availability of government funding, can enhance habitat values while also being positive to timber supply.
1.4.2 Provincial goals
Government’s goals can be characterized as:
• sustainable use;
• community stability; and
• a strong forest sector.
1.4.3 Provincial objectives
Until provincial targets for timber quantity and quality are established, management unit strategies are to consider the following interim provincial strategic objectives (B.C. Ministry of Forests 1998a):
• To maintain current harvest levels as long as possible without disruptive shortfalls in future timber supply.
• To create a long-term timber supply capable of supporting a steady long-term provincial harvest level similar to current levels.
• To minimize the interim shortfall in provincial harvest anticipated before a steady long term supply is achieved.
• To create a long-term timber supply which will enable the timber quality of the future harvest to be the same or better than the current profile.
Not every management unit has the same capability to contribute to these interim objectives. Further, these objectives may not be attainable at current funding levels. Their purpose is to provide general guidance to the application of available funds.
1.4.4 Regional objectives
The objectives of the Vancouver Forest Region incremental silviculture strategy (B.C. Ministry of Forests 1998b) are to:
• Ensure a long-term sustainable harvest which approximates the current harvest value and volume levels and that produces a diversified mix of products necessary to create and maintain sustainable forest employment.
• Balance treatments that enhance growth and yield such as fertilizing and forest health activities, with those that increase the value and/or reduce harvest and processing costs of the wood such as spacing and pruning.
• Use incremental silviculture treatments to contribute to sustainable management of non-timber values at the landscape level.
2. Issues Affecting Timber Supply
2.1 Variable retention harvesting practices
Weyerhaeuser is adopting a variable retention (VR) harvesting system throughout its B.C. coastal forest operations. In VR, harvested units retain a portion of their mature forest cover within the block. Minimum retention levels are 10% for much of the Timber zone, 15% in the Habitat zone, and 20% in the harvested portion (33%) of the Old Growth zone. The base case assumed that at least half the Timber and Habitat zone retention would coincide with other netdowns listed in Table 2. Additional netdowns of 5% and 7.5% were applied to account for incremental retention because of VR in the Timber and Habitat stewardship zones, respectively. The Old Growth zone was heavily constrained for timber harvesting in the base case.
A survey of VR blocks harvested during 1999 showed that total retention averaged 19% of the gross harvested block area. This accounting included areas reserved in riparian areas, wildlife tree patches and other area netdowns as well as incremental areas reserved because of VR. An initial sample of year 2000 blocks shows a gross retention percentage of between 15% and 17%. The intention is to learn from these early experiences to fine tune retention procedures closer to the minimum requirements. In addition, survey procedures will be refined to differentiate the reasons for retention (e.g. riparian, wildlife tree patches, sensitive soils, additional VR).
Figure 6 illustrates the potential effects of VR on timber supply. The upper line shows the potential harvest level over time if VR is excluded from the base case. The VR assumptions reduced the potential by 15.8%. The lower line illustrates the effect on harvest levels of higher levels of in-block mature timber retention—resulting in a 10.1% further reduction in the LTHL.
FIGURE 6. Harvest level effect of increased and decreased levels of variable retention
The VR silviculture system improves habitat values, and generally improves viewer perception of the harvested unit. In combination with developing harvesting methods (e.g. single tree
harvesting by helicopter) VR provides opportunities for harvesting otherwise reserved areas without adverse impacts on important non-timber values. It also changes the nature of
regenerating stands, by providing a more abundant seed source, and providing local shade and root competition. This analysis does not inspect silviculture regimes tailored to VR systems. Through an adaptive management approach, the company is presently collecting information that will lead to the evolution of second growth management around and in preparation for future VR harvesting.
2.2 Visual quality forest cover requirements
Visual landscape constraints limit the amount of area in a management unit that may be younger than the age of visually effective green-up (VEG). In the base case, VEG is achieved at 5 m height in Blocks 1–5, and 6 m height in Blocks 6 and 7. The base case assumed management to the upper end of the permitted range for each visual quality objective (VQO) class. Figure 7 illustrates that if social preference shifted management toward the low end of the permitted range for each VQO class, there would be a steeper rate of decline in harvest levels, and a timber supply shortfall 40–60 years from now. Conversely, gains from improved visual design and the contribution from VR would shift the harvest levels upward. In addition, silviculture can help offset
0 5 0 0 1 0 0 0 1 5 0 0 2 0 0 0 2 5 0 0 3 0 0 0 3 5 0 0 4 0 0 0 4 5 0 0 0 5 0 1 0 0 1 5 0 2 0 0 2 5 0 Y e a r s f r o m n o w H a r v e s t V o lu m e (0 0 0 m 3 ) B a s e V a r ia b le r e te n tio n n e td o w n : 1 5 % in T im b e r z o n e 1 7 .5 % in H a b it a t z o n e 1 0 .1 % d e c r e a s e E x c lu d e s S te w a r d s h ip Z o n e s a n d V R 1 5 .8 % In c r e a s e
FIGURE 7. Harvest levels with more constraining visual quality requirements
2.3 Minimum harvest ages
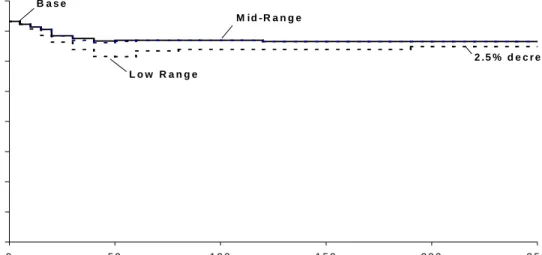
In the base case the minimum harvest age (MHA) is set to the age when a stand achieves 350 m³/ha. Minimum harvest ages range from approximately 45 years on high growing sites, to 80–120 years on poor growing sites. Figure 8 illustrates the impact of raising the MHA by 10 years. The rate of harvest level reduction must be increased, to reserve timber supply until second-growth stands are more mature. A low point, 3% below the base case level, is reached 40 years from now. The issue here is that incremental silviculture treatments that require longer rotations will have a negative impact during the period of tight supply, expected 40–60 years from now in TFL 39.
FIGURE 8. Harvest levels with minimum harvest ages increased 10 years. 0 5 0 0 1 0 0 0 1 5 0 0 2 0 0 0 2 5 0 0 3 0 0 0 3 5 0 0 4 0 0 0 0 5 0 1 0 0 1 5 0 2 0 0 2 5 0 Y e a r s f r o m n o w H a r v e s t V o lu m e (0 0 0 m 3 ) B a s e In c r e a s e M H A 0 5 0 0 1 0 0 0 1 5 0 0 2 0 0 0 2 5 0 0 3 0 0 0 3 5 0 0 4 0 0 0 0 5 0 1 0 0 1 5 0 2 0 0 2 5 0 Y e a r s fr o m n o w H a r v e s t V o lu m e (0 0 0 m 3 ) B a s e L o w R a n g e M i d -R a n g e 2 . 5 % d e c r e a s e
2.4 Second growth volumes
Figure 9 illustrates the effect on harvest levels of a ± 10% change in assumed volumes from second-growth stands. The LTHL is effected roughly in proportion to the changed volume assumption. However, note that the increased second-growth volume (upper line in the graph) does not flow back to the early planning periods. It is still necessary to gradually reduce forecast harvest levels for the next thirty years. To fill the dip shown in the upper line of Figure 9, it is necessary to consider silviculture treatments that accelerate the volume production of existing young stands, rather than relying on future regenerated stands.
FIGURE 9. Harvest levels with second-growth volumes changed ± 10%.
2.5 Genetic gain assumptions
In the base case for MP#8, all planted stands are assumed to use genetically improved stock. The assumed gain over Y-XENO volume projections is 13% for Douglas-fir and 6.5% for
hemlock. The terms of reference for this project specify that a scenario with only basic silviculture and no genetic gain be tested. Figure 10 illustrates the effect of removing the genetic gain
assumption from the base case. The effect of using wild seed becomes apparent 30 years from now, and long-term harvest levels are 4.8% lower than the base case.
0 5 0 0 1 0 0 0 1 5 0 0 2 0 0 0 2 5 0 0 3 0 0 0 3 5 0 0 4 0 0 0 0 5 0 1 0 0 1 5 0 2 0 0 2 5 0 Y e a r s f r o m n o w H a r v e s t V o lu m e ( 0 0 0 m 3 ) B a s e 1 0 % d e c r e a s e i n s e c o n d - g r o w t h v o lu m e s v o l u m e 1 0 % in c r e a s e i n s e c o n d - g r o w t h v o lu m e s 8 .2 % i n c r e a s e 9 . 9 % d e c r e a s e
FIGURE 10. Harvest levels with the genetic gain assumptions removed from the base case.
2.6 Methods of analysis of silviculture opportunities
The purpose of this analysis is to quantify the short- and long-term benefits that may be realized by applying incremental silviculture treatments within the TFL 39 forests. The same computer model that was used in the MP#8 timber supply analysis was used to test investment options in this analysis. The model uses the Forest Service Simulator (FSSIM), and accessory programs that track dollars spent, thinning yields, diameter responses and employment creation.
Being a simulation environment, the model is not conducive to conducting direct investment optimization analysis. Instead, each recommended treatment was applied to all identified suitable stands in the inventory, and costs and responses were recorded. The treatments and responses were then scaled back proportionately, in recognition of budget levels and to assess trade-offs between alternative investments.
TFL 39 contains seven timber supply blocks. Blocks 3 and 4 are combined into one model in the analysis, and all other blocks are modelled independently. Treatments to increase volume production, and multiple spacing treatments to increase harvested stand diameters, were tested in all blocks and summed for the TFL. Pruning treatments and species conversion (from hemlock to Douglas-fir) were tested only in Blocks 1 and 2, which are closest to markets and have
relatively better growing sites. Treatments to improve wildlife habitat were tested in Blocks 1, 2, and 3|4. 0 5 0 0 1 0 0 0 1 5 0 0 2 0 0 0 2 5 0 0 3 0 0 0 3 5 0 0 4 0 0 0 0 5 0 1 0 0 1 5 0 2 0 0 2 5 0 Y e a r s f r o m n o w H a r v e s t V o l u m e ( 0 0 0 m 3 ) B a s e N o G e n e t i c G a i n
3. Incremental silviculture history and current program priorities
3.1 Current incremental silviculture history
Table 4 lists the recent incremental silviculture activity in TFL 36. Recent annual budgets average approximately $3 million/yr. Table 4 provides information for 1998 – 2000. Note the shift in emphasis over the three years. Although the brushing program is relatively stable, investments in spacing and pruning are now being replaced with increased investments in fertilization.
TABLE 4. Historical spending levels for incremental silviculture.
Block Treatment
(ha) ($ 000s) (ha) ($ 000s) (ha) ($ 000s)
1&5 Brushing 122 $132 80 $77 110 $150 Spacing 218 $428 143 $262 87 $132 Pruning 15 $41 38 $80 19 $47 Surveys 1201 $65 2395 $80 1607 $96 2 Brushing 0 $0 147 $135 60 $63 Spacing 256 $399 215 $579 100 $196 Pruning 11 $30 58 $137 20 $50 Surveys 2362 $83 2716 $130 4530 $171 Fertilization 182 $49 1035 $248 1340 $304 3&4 Brushing 26 $25 82 $104 90 $100 Spacing 56 $145 23 $66 29 $53 Pruning 32 $78 0 $0 0 $0 Surveys 3491 $166 6275 $104 1400 $54 Fertilization 537 $280 388 $218 520 $260 6 Brushing 472 $715 568 $796 597 $758 Spacing 155 $286 68 $117 100 $170 Pruning 33 $126 0 $0 0 $0 Surveys 705 $13 3720 $49 3100 $83 Fertilization 0 $0 0 $0 60 $30 7 Spacing 30 $60 Surveys 1110 $26 100 $4 Total TFL 39 Brushing 620 $872 877 $1,112 857 $1,071 Spacing 685 $1,258 449 $1,024 346 $611 Pruning 91 $275 96 $217 39 $97 Surveys 8869 $353 15106 $363 10737 $408 Fertilization 719 $329 1423 $466 1920 $594
3.2 Workshops discussion sessions
The objective of this analysis is to help the TFL 39 silviculturalists and forest planners make rational investment decisions about their specific management objectives. This is in contrast to an analysis that seeks to identify the best silviculture treatments to achieve broad provincial goals. The management objectives studied in this analysis are based on company philosophy of forest management and the experience of company foresters.
Two workshops were held with foresters from the company, the Ministry of Forests, and Forest Renewal BC. The first workshop, held in Campbell River, discussed management objectives and resulted in a list of treatments to meet the objectives. Stand criteria suitable for each treatment were identified. A summary list of objectives and treatments was developed following the workshop, and circulated to participants for review. Table 5 briefly summarizes the inputs received at the first workshop. Later sections of this report discuss each objective in more detail.
TABLE 5. Summary of objectives, treatments and candidate stands modelled
Objective Treatment Candidate stands
Volume production 1. Fertilize pre-harvest Douglas-fir, SI 27+ 2. Fertilize (SCHIRP) sites at
establishment
Hemlock, Cedar, low and medium sites
Increase diameters 1. Multiple spacing Juvenile spacing
D-fir 3000&1200 sph, SI 27+ Hemlock 7000+ sph, SI 27+ 2. Pole thinning D-fir 3000 sph, SI 27+ 3. Commercial thinning D-fir 3000-9000 sph, SI 27+
Produce clear wood Space, prune and fertilize D-fir 3000&1200 sph, SI 27+
Grow valuable species Convert hemlock to D-fir and Cedar Hemlock, SI 27+
Enhance habitat Wide spacing in riparian D-fir & hemlock, SI 21+
SCHIRP = Salal-Cedar-Hemlock Integrated Resource Project; SI = site index; sph = stems per hectare
Stand responses to treatments were developed using the company growth and yield model Y-XENO. The stand responses for treated areas, and base case assumptions for untreated areas, were then incorporated as scenarios in the FSSIM models. Results were graphed and presented for discussion at a second workshop held in Nanaimo in the fall of 2000. The second workshop
resulted in further refinements to the modelling process, and clarification of issues. This report was developed following the second workshop.
4. Test of opportunities to increase volume production
Two regimes were tested. Both inspect assumed gains to fertilization treatments.
4.1 Fertilization of maturing Douglas-fir stands
The most direct way to increase tree and stand volumes is to provide the trees with optimal growing conditions. TFL 39 receives adequate rainfall for tree growth, so the limiting factors are soil depth and type, and the quantity of nutrients in the soil. Broadcast fertilization with urea adds nutrients which trees can readily absorb. Growth is accelerated for a period of 5 to 10 years.
The proposed practice is to give trees a three-time fertilizer boost before final harvest. Stands scheduled for harvest are fertilized 7, 14, and 21 years before the harvest date. Three fertilizer applications are assumed to increase stand volumes at harvest by 50 m³/ha. All Douglas-fir stands on high and good growing sites were assumed to be fertilized. Timber supply response was modelled by raising the LTHL while maintaining a growing stock level equal to the base case over the planning horizon (i.e. capturing all the growth increase as harvest). The result for TFL 39 is a 1.3% increase in the LTHL. The gains vary by supply block, as listed in Table 6.
TABLE 6. Potential gains in LTHL with pre-harvest fertilization of high and good site Douglas-fir
Supply block Short-term (10 year) Long-term Yield gain Yield gain
treatable area treatable area in LTHL (% of base
(ha) (ha/year) (m³/year) case LTHL)
Block 1 7,900 800 24,752 3.7 Block 2 4,519 700 14,851 1.4 Block 3|4 12 110 2,970 0.7 Block 5 0 30 672 0.9 Block 6 0 0 0 0.0 Block 7 0 5 77 0.1 Total TFL 39 12,431 1,645 43,322 1.3
The greatest potential gains occur in Blocks 1 and 2, since this is where most of the Douglas-fir stands occur in TFL 39. Figure 11 illustrates the area fertilized and effect on the LTHL for Block 1. In the long term, approximately 800 ha/yr are fertilized. Recall that each hectare is fertilized three times before harvest in the model, so the harvest level each year includes approximately 267 ha that were fertilized. Figure 11 represents fertilization of all candidate stands, and the actual area fertilized would possibly be less, depending on budget allocations (Section 13).
FIGURE 11. Block 1 areas aerial fertilized and yield gains with all candidate stands treated.
4.2 Fertilization of poor site cedar/hemlock stands at establishment
Cedar and hemlock stands on poor growing sites (generally wetter areas) are often slow to begin height growth. These sites also host salal, a woody shrub with evergreen leaves. Salal roots compete with the conifer roots, and dominate the uptake of the limited nutrient supply. The Salal-Cedar-Hemlock Integrated Research Project (SCHIRP) is a ten-year ongoing research project with Weyerhaeuser participation that is finding good response to fertilization with a mix of nitrogen and phosphorus.
SCHIRP fertilization was simulated on all hemlock poor sites. The treatment is expected to accelerate forest establishment by 20 years, which means that the stand matures 20 years earlier than it would have without the treatment. Minimum harvest ages were reduced by 20 years for treated sites. Diameters were also assumed to develop 20 years earlier. The cost of SCHIRP fertilization is at the date of establishment, which is the year after harvest. The result for TFL 39 is a 1.8% increase in mid-term harvest levels, and a 0.9% increase in the LTHL. Table 7 lists the gains by supply block.
0 1 0 0 2 0 0 3 0 0 4 0 0 5 0 0 6 0 0 7 0 0 8 0 0 0 5 0 1 0 0 1 5 0 2 0 0 Y e a r s f r o m n o w H a r v e s t L e v e l ( 0 0 0 m 3 / y r ) 0 5 0 0 1 0 0 0 1 5 0 0 2 0 0 0 2 5 0 0 3 0 0 0 A n n u a l A r e a F e r t i l i z e d ( h a ) B a s e C a s e A r e a F e r t ili z e d F e r t iliz e d C u r v e 3 . 7 % I n c r e a s e
TABLE 7. Potential gains in LTHL with SCHIRP fertilization of poor site hemlock
The greatest potential gains occur in Block 6, since this is where the majority of the poor site hemlock stands occur in TFL 39. Figure 12 illustrates the area fertilized and effect on the LTHL for Block 6.
FIGURE 12. Block 6 areas SCHIRP fertilized and yield gains with all candidate stands treated.
5. Comparison of potential volume production treatments
Two components of the TFL 39 inventory were modelled to assess the benefits of fertilization
Supply Block Short term (10 year) Long-term Yield gain Yield gain
treatable area treatable area in LTHL (% of base
(ha) (ha/year) (m3/year) case LTHL)
Block 1 60 15 1,733 0.3 Block 2 1,400 60 6,931 0.6 Block 3|4 350 20 1,980 0.5 Block 5 20 1 103 0.1 Block 6 8,200 200 15,446 1.5 Block 7 1,200 50 3,860 5.0 Total TFL 39 11,230 346 30,053 0.9 0 2 0 0 4 0 0 6 0 0 8 0 0 1 0 0 0 1 2 0 0 1 4 0 0 0 5 0 1 0 0 1 5 0 2 0 0 Y e a r s f r o m n o w H a r v e s t L e v e l ( 0 0 0 m 3 / y r ) 0 2 0 0 4 0 0 6 0 0 8 0 0 1 0 0 0 1 2 0 0 1 4 0 0 A n n u a l A r e a F e r t i l i z e d ( h a ) A r e a F e r t iliz e d F e r t iliz e d C u r v e B a s e C a s e 1 . 5 % I n c r e a s e
achieve maturity 20 years earlier with a SCHIRP fertilizer application at establishment. Which investment is superior?
Table 6 showed that pre-harvest fertilization of 1,645 ha/yr results in an increase in timber supply of 43,322 m³/yr. The cost of aerial fertilization (Appendix 1) is $231/ha. Annual investments of up to $380,000 in TFL 39 fertilizing Douglas-fir stands will therefore grow wood volume at a cost of $8.77/m³, with an average 14-year investment commitment.
Table 7 showed that SCHIRP fertilization of 346 ha/yr results in an increase in timber supply of 30,053 m³/yr. The cost of SCHIRP fertilization is $487/ha. Annual investments of up to $168,500 in TFL 39 fertilizing poor site hemlock stands will therefore grow wood volume at a cost of $5.61/m³, with approximately a 70 – 100 year investment commitment.
Comparing the investments, Douglas-fir fertilization is clearly superior. The wood volume produced is approximately 40% more valuable, and the money can be invested and returned six times during one cycle of the hemlock fertilization regime. If the future value of hemlock is $50/m³ and Douglas-fir is $80/m³, then the total return on investment, using gross log value and ignoring harvesting costs, to hemlock SCHIRP fertilization is 2.6% while the Douglas-fir pre-harvest investment returns 17.1%.
6. Volume production strategy
It is thought that three applications of fertilizer, on a seven year cycle, are necessary to achieve 50 m³/ha. Incremental growth diminishes with each application. The first application is thought to produce 25 m³/ha, the second application adds 15 m³/ha and the third application adds the final 10 m³/ha. With the TFL 39 harvest profile rapidly moving into second growth (Figure 4), short-term harvest levels would benefit from even one application of fertilizer. At the stand level, one fertilizer application produces wood at a cost of $9.24/m³, with a seven year investment commitment. In a Douglas-fir forest this implies a 36.1% compound annual rate of return.
The 20-year plan for TFL 39 identifies a schedule of second growth stands planned for harvest over the next two decades. Douglas-fir stands on high and good sites scheduled for harvest in the final year of the plan could receive a first fertilization this year, with two to follow. Stands
scheduled for harvest in year 14 of the plan could receive a first fertilization this year, with one to follow. Stands scheduled for harvest in year 7 could receive a single fertilization this year. The budget required would be approximately $290,000 - $380,000/year.
Fertilization is not an employment-intensive activity. A Douglas-fir fertilization program on the scale described here would create one full-time job in application. However, the added timber
supply would support 61 long-term jobs in harvesting and processing, assuming 1.4 jobs per each additional 1000 m³/yr harvested (Coast Forest Lumber Association, 2000).
7. Objectives to improve timber quality
Sections 4-6 discussed fertilization as a means to increase the volume of timber production. The following sections discuss treatments that increase the value of the timber produced.
Weyerhaeuser’s main emphasis is on volume production. The company believes that good timber quality will be ensured by maintaining full stocking. Trees in well-stocked stands typically have higher wood density, less juvenile wood, tighter grain, smaller knots and straighter form than trees in open stands. For most stands, adding value by juvenile spacing to increase piece size are viewed as unattractive. Costs are high, losses in volume production are thought likely, piece size gains appear less than previously estimated, and intrinsic wood quality factors are
compromised by significantly faster stem growth. The company expects that technology, both products and processes, will reduce the current value premiums due to larger piece sizes over time.
Timber quality (price) is also influenced by species and proportion of clearwood. Strategies to increase piece size, upgrade the species mix, and produce clearwood were examined.
8. Methods to improve timber quality
Three quality objectives were inspected in the modelling. This section discusses each objective in turn.
8.1 Increase stand diameters
Hugh Hamilton Ltd., as part of their Type 2 analysis of the Soo TSA (draft, December 2000), investigated trends in value response to increasing piece size. Using data from the Howe Sound log market, it found a roughly linear relationship between log diameter and value. The value of a log, all else being equal, increases $1.87/m³ per cm of diameter increment.
A juvenile spacing and thinning regime was developed at the workshops. The treatment regime for Douglas-fir consists of: fertilization at planting, juvenile spacing to 1200 stems per hectare (sph) at age 14, pole thinning to 400 sph at age 40, commercial thinning to 200 sph at age 60, and fertilization 21, 14, and 7 years prior to final clear felling. In the model the regime was tested
spaced to 1200 sph. Weyerhaeuser’s growth and yield model Y-XENO was used to model diameter and volume responses to the treatments.
Figures 13 and 14 illustrate a tradeoff between volume production and diameter increment in a forest stand. These illustrations represent the merchantable volume component for a Douglas-fir stand on site index 27, 1500 sph establishment density, as modelled in Y-XENO. The very low-density treatment is considered for riparian habitat enhancement in Section 11 of the report. The stand manipulations result in increases of up to 19% in average stand diameters at 100 years of age, but reduce stand volumes by up to 67% at that age for the riparian management. Spacing for a compromise between diameter increase and volume loss results in a diameter increase of approximately 12% and a volume loss of also approximately 12% (juvenile spacing to 400 stems in the figures). An important aspect of juvenile spacing is the ability to influence the species composition of the remaining stand, favouring in this case Douglas-fir and western redcedar. However, the potential for changed species composition was not quantifiable, and therefore not included in the modelling.
FIGURE 13. Y-XENO diameter comparisons for candidate treatments. (JS = juvenile spacing; CT = commercial thinning)
0 1 0 2 0 3 0 4 0 5 0 6 0 7 0 8 0 9 0 0 2 0 4 0 6 0 8 0 1 0 0 1 2 0 1 4 0 1 6 0 1 8 0 2 0 0 Y e a rs DBH (c m ) N o T re a tm e n t C T 4 0 0 s te m s J S 8 0 0 s te m s J S 4 0 0 s te m s J S 1 5 0 s te m s & C T 8 0 s s te m s
FIGURE 14. Y-XENO volume comparisons for candidate treatments. (JS = juvenile spacing; CT = commercial thinning)
Note in Figure 14 that stand volumes following spacing projected by Y-XENO do not recover to the volume of an untreated stand. Some growth and yields models (i.e. TASS) do show volume catch-up following spacing.
The timber supply and diameter responses to multiple-entry spacing were tested for all blocks in TFL 39. The effects vary between blocks, due to relatively greater or lesser quantities of
candidate stands. Individual block responses are included on the data CD (Appendix 4). Figure 15 illustrates the overall effect on TFL 39 harvest levels. The clear-felled harvest component declines 9.3% in the long term. The base case harvest level is maintained for only five years. Volumes removed in the thinnings compensate for half of the loss in clear felled timber. Reduced harvest levels are most pronounced in Block 1, which has the greatest proportion of high and good site Douglas-fir.
0 5 00 10 00 15 00 20 00 25 00 0 20 40 6 0 8 0 1 00 1 20 14 0 16 0 18 0 2 00 Y e ars Volume (m3/ha) N o T re a tm en ts J S 8 0 0 s te m s C T 4 0 0 ste m s JS 4 0 0 S te m s
FIGURE 15. TFL 39 harvest levels with a spacing and thinning program applied in all suitable stands.
Figure 16 illustrates the gain in average harvested stand diameter at breast height. The first 40 years represent a majority of harvesting in existing old growth stands. After that time, the spacing and thinning program increases the average diameter by approximately 2.0 cm. The average diameter in the treated stands increases by approximately 20%, from 35 cm to 42 cm.
FIGURE 16. TFL 39 gain in average harvested diameters with a spacing and thinning program in all suitable stands.
8.1.1 Pole thinning and commercial thinning
Weyerhaeuser is developing expertise in the utilization of very small wood, and requested a test of opportunities for a pole thinning treatment in natural-origin Douglas-fir stands at approximately
0 5 0 0 1 0 0 0 1 5 0 0 2 0 0 0 2 5 0 0 3 0 0 0 3 5 0 0 4 0 0 0 0 5 0 1 0 0 1 5 0 2 0 0 Y e a r s f r o m n o w H a r v e s t L e v e l ( 0 0 0 m 3 /y r ) B a s e C a s e N e w H a rv e s t L e v e l 9 .3 % lo w e r V o lu m e R e m o v e d fro m T r e a tm e n ts 0 1 0 2 0 3 0 4 0 5 0 6 0 7 0 0 5 0 1 0 0 1 5 0 2 0 0 Y e a r s f r o m n o w D i a m e t e r ( c m ) T r e a t e d C u r v e B a s e C a s e
40 years of age. The effect on sustainable harvest levels is almost nil. The volumes recovered in the pole thinning compensate for a small loss in clear-felled volume. Treated stands show gains of approximately 3 cm dbh, but when averaged over the complete harvest the diameter gain is less than 0.5 cm. This treatment is applied to approximately 200 ha/yr in the model, with yields of 100 – 150 m³/yr (Appendix 2).
Stillwater Division (Block 1) also requested a test of opportunities for commercial thinning in Douglas-fir stands about 60 years of age. This test produced similar results to the pole thinning test, with a slightly (1.5%) depressed LTHL that was made up for by the volumes removed from the thinnings. Approximately the same diameter effect was produced as well, with negligible improvement overall, but gains of approximately 3 cm in the treated stands. . Both these regimes were modelled using custom-made Y-XENO yield tables.
8.2 Pruning for clear volume production
Government wants future timber harvests to supply a range of products similar to those presently harvested. However, forests managed on relatively short rotations do not have an opportunity to naturally shed understorey branches, occlude the stub, and grow a knot-free outer shell. To ensure a clearwood component in the product mix from future forests, pruning the lower branches from young trees is necessary.
Pruning occurs in two lifts totaling 5.5 m when trees are 10 – 18 years old. The pruning treatment produces a 16-foot butt log with a clearwood shell. Work by Forest Practices Branch using TASS and current market prices for clear and knotty lumber suggests that a pruned stand will be 40% at least more valuable than an unpruned stand at final harvest. Pruned butt logs presently sell for twice the price of similar sized unpruned logs in New Zealand
The discussions at the workshop recommended that pruning might be considered in Douglas-fir stands on high and good growing sites. Pruning is done in conjunction with juvenile spacing, to 400 or 800 sph, to accelerate diameter increment following the treatment. Pruned stands would be fertilized on a seven-year cycle.
The pruning regime was modelled for Blocks 1 and 2 only, since they contain most of the Douglas-fir stands in TFL 39. Figures 17 and 18 illustrate harvest level effects of the pruning regime for spacing to 400 and 800 sph, respectively. The lower density regime has a significant impact on the future volume harvested, due to lower site occupancy, as discussed in the preceding section. Figures 13 and 14 (Y-XENO diameter and volumes) illustrated the increased
FIGURE 17. Block 1 harvest levels and pruned log volumes with a spacing, pruning and fertilization regime at 400 sph.
FIGURE 18. Block 1 harvest levels and pruned log volumes with a spacing, pruning and fertilization regime at 800 sph. 0 1 0 0 2 0 0 3 0 0 4 0 0 5 0 0 6 0 0 7 0 0 8 0 0 0 5 0 1 0 0 1 5 0 2 0 0 Y e a r s f r o m n o w H a r v e s t L e v e l ( 0 0 0 m 3 / y r ) B a s e N e w H a r v e s t L e v e l P r u n e d lo g v o lu m e 0 1 0 0 2 0 0 3 0 0 4 0 0 5 0 0 6 0 0 7 0 0 8 0 0 0 5 0 1 0 0 1 5 0 2 0 0 Y e a r s f r o m n o w H a r v e s t L e v e l ( 0 0 0 m 3 / y r ) B a s e N e w H a r v e s t L e v e l P r u n e d lo g v o lu m e
Pruning is the most labour-intensive and expensive treatment regime considered in this analysis. At a density of 400 sph, the pruning lifts cost $3913/ha, the spacing costs $2485/ha, and three aerial fertilizations with urea cost $693/ha. The result of this expenditure is a significantly reduced harvest level. Pruning 800 sph is estimated to cost an additional $3000/ha.
A pruning program in suitable stands would create approximately 18 full-time silviculture jobs for the 400 sph option in each of Blocks 1 and 2. However, the combined impact of the 400 sph regime on the LTHL is a reduction of 141,000 m³/yr, or a loss of 197 future jobs in harvesting and processing. The 800 sph regime results in a loss of 48 long-term jobs.
8.3 Conversion of natural hemlock regeneration to planted Douglas-fir stands
A third activity identified at the workshops to improve the quality of future harvested timber is the conversion of naturally regenerated hemlock stands to become Douglas-fir leading stands. Douglas-fir timber is presently worth approximately 40% more than equivalent grades of hemlock timber.
To convert species, genetically improved Douglas-fir is planted, and fertilized at planting. Usually a brushing treatment is needed to help the fir become established on natural hemlock sites. At approximately 14 years of age, the plantation is juvenile spaced to remove the hemlock trees that have seeded in. Species conversion was modelled in Blocks 1 and 2. These are the most
southerly blocks in TFL 39, located in a generally warmer and drier climate, conditions preferred by Douglas-fir.
Figure 19 illustrates the different volume development pathways for hemlock and Douglas-fir on good growing sites (site index 29) for each species. Hemlock grows faster initially, and then slows and is overtaken by Douglas-fir. Hemlock grown at lower densities (1500 or 3000 sph) shows the same, although lesser, bulge of early volume development relative to Douglas-fir. Figure 19 highlights the age when the species reaches 95% of culmination age. Short-rotation forestry will produce significantly greater volume growing high-density hemlock than growing Douglas-fir. However, on the same piece of ground Douglas-fir often grows at 2 – 4 m higher apparent site index, which would reduce but not eliminate the volume lead of hemlock in this example.
FIGURE 19. Hemlock versus Douglas-fir volume development on site index 29 for each species.
Modelling tested conversion to Douglas-fir of 50% of the high and good growing site stands expected to naturally regenerate to hemlock. Harvest levels in Blocks 1 and 2 were effected differently. In Block 1, the base case harvest levels were achieved for 90 years, followed by a 3.5% rise in the LTHL above the base case. In Block 2, shortfalls started in the second planning period and continuing until 40 years from now. After that time, the base case LTHL was achieved. The volume shortfall in Block 2 averaged 59,000 m³/yr (5% harvest level reduction) over the 35-year period.
The reason for the different responses in the model is that the TSR2 base case harvest flow for Block 1 does not push forest harvesting to the potential upper limit in the early periods. Figure 11 in the TSR2 report shows that the average age harvested over time from Block 1 is approximately 95 years, compared with approximately 75 years in Block 2. Thus Block 1 stands are harvested farther to the right in Figure 19, where Douglas-fir yields are rising above hemlock yields. In Block 2, a short-term lower-harvest adjustment period would be necessary to permit the new Douglas-fir stands to gain a bit more maturity.
Figures 20 and 21 illustrate the harvest flow, and the Douglas-fir component of the harvest for the test of species conversion for Blocks 1 and 2. In Block 1, converting half the candidate areas (areas that would naturally regenerate to hemlock and with site index greater than 27) to
Douglas-fir will shift approximately 130,000 m³/yr (20% of the LTHL) from hemlock to Douglas-fir, and increase the overall value of timber harvested by 8%. In Block 2 the gain is approximately 275,000 m³/yr (25% of the LTHL) and an overall value gain of 10%.
0 2 0 0 4 0 0 6 0 0 8 0 0 1 0 0 0 1 2 0 0 1 4 0 0 1 6 0 0 1 8 0 0 0 5 0 1 0 0 1 5 0 2 0 0 2 5 0 Y e a rs V o lum e ( m 3 /ha ) 9 5 % a t 5 5 y rs 9 5 % a t 9 0 y rs D o u g la s -fir, P la n te d 1 2 0 0 s te m s , 5 0 0 s te m s in fill, g o o d s ite . H e m lo c k , 6 0 0 0 s te m s n a tu ra l, g o o d s ite .
FIGURE 20. Block 1 long-term increase in Douglas-fir representation in the harvested profile.
FIGURE 21. Block 2 long-term increase in Douglas-fir representation in the harvested profile.
Appendix 2 of the report Site Series Estimates by Site Series (B.C. Ministry of Forests 1997) lists site index conversions between hemlock and Douglas-fir. A hemlock SI 24 site would grow
0 1 0 0 2 0 0 3 0 0 4 0 0 5 0 0 6 0 0 7 0 0 8 0 0 0 5 0 1 0 0 1 5 0 2 0 0 2 5 0 Y e a r s f r o m n o w H a r v e s t L e v e l ( 0 0 0 m 3 / y r ) B a s e C a s e H a r v e s t L e v e l B a s e c a s e D o u g la s - f i r h a r v e s t S t a n d c o n v e r s i o n D o u g l a s - f i r h a r v e s t N e w H a r v e s t L e v e l 0 2 0 0 4 0 0 6 0 0 8 0 0 1 0 0 0 1 2 0 0 1 4 0 0 1 6 0 0 0 5 0 1 0 0 1 5 0 2 0 0 2 5 0 Y e a r s f r o m n o w H a r v e s t L e v e l ( 0 0 0 m 3 / y r ) B a s e C a s e H a r v e s t L e v e l D o u g la s - f ir h a r v e s t w it h s t a n d c o n v e r s io n B a s e c a s e D o u g l a s - f ir h a r v e s t N e w H a r v e s t L e v e l
The site index values used to generate Y-XENO volume tables were 29.0 and 35.5 for good and high site Douglas-fir, and 28.5 and 33.5 for good and high site hemlock, respectively. The results reported above thus include a site index lift of only 0.5 m for good sites and 2.0 m for high sites.
To test the impact of a larger site index lift on species conversion, half the treated good-site hemlock was converted to high-site Douglas-fir. This resulted in a LTHL 7.6% higher than the base case in Block 1, and 5.5% higher than the base case in Block 2. With this site index lift assumption, the species conversion raises the overall TFL 39 LTHL by 110,000 m³/yr.
9. Preferred timber quality strategies
As discussed in Section 7, Weyerhaeuser’s main emphasis is on volume production, relying on full stocking to achieve volume targets and to control timber quality. The company believes that as technology advances, present premiums for large log sizes will diminish.
Large scale programs of juvenile spacing to increase piece size are unattractive as treatment costs are high, volume losses may occur and gains in piece size tend to be offset by reduced wood quality (increased size of juvenile core, larger branches, and wider rings). Similarly, a large scale pruning program for clearwood is risky because it relies on premiums from clearwood to offset large up-front costs and reduced timber yields.
It is, however, recognized that treatments such as juvenile spacing and pruning may apply to specific sites. Examples include species conversion and the development of windfirm stand boundaries and specific habitat conditions.
The analysis uses broad assumptions to explore the potential gains from species conversion. Figure 22 illustrates the costs of converting half the candidate regenerating hemlock stands to Douglas-fir for Blocks 1 and 2. The modelling system used for this project, FSSIM, enabled only a one-time conversion of the species. By 100 years from now essentially all stands have been harvested and regenerated. The graph shows the first 100 years of the planning horizon for both blocks together.
FIGURE 22. Species conversion costs for Blocks 1 and 2.
Block 2, which is larger than Block 1, has a higher percentage of hemlock in the natural forest so it can absorb a larger species conversion budget. Costs per hectare are held fixed over the planning horizon. The rise in expenditure reflects increasing area of species conversions over time, until all stands have been converted.
In the first 10 years, costs are approximately $205,000 in Block 1 and $780,000 in Block 2. In the mid term costs rise to $400,000 and $1.2 million respectively as stands develop and need the subsequent juvenile spacing treatment.
10. Returns to timber quality investments
Table 8 summarizes the modelling results for the three objectives of increased diameters, clearwood, and more valuable species. The budget is what is required on a sustained basis to treat all candidate stands within TFL 39. Changes in the long-term harvest level (LTHL) are expressed as a percentage of the base case LTHL. Silviculture jobs include commercial thinning for the spacing regime. Harvest and milling employment is estimated at one job per 1000 m³/yr harvested and includes jobs from processing thinnings. Net employment is the sum of silviculture and harvest and milling jobs. Wood value is estimated using $80/m³ for Douglas-fir and $50/m³ for hemlock, $1.87/cm for increased diameter, and pruned logs worth double the value of un-pruned logs, The reported value is net of losses in the LTHL where applicable. Time to maturity is
0 2 0 0 4 0 0 6 0 0 8 0 0 1 0 0 0 1 2 0 0 1 4 0 0 1 6 0 0 1 8 0 0 0 5 0 1 0 0 1 5 0 2 0 0 2 5 0 Y e a r s f r o m n o w T r e a t m e n t C o s t ( 0 0 0 $ /y r ) J u v e n ile S p a c in g C o s t P re p a n d P la n tin g C o s t J u v e n ile S p a c in g C o s t P r e p a n d P la n tin g C o s t B lo c k 1 B lo c k 2 0 5 0 1 0 0
TABLE 8. Summary comparison of outputs for the three quality regimes.
In Table 8 the value increases shown are gross timber values, and the picture may look different if harvesting costs were subtracted to arrive at net profit on the investment.
Net returns are negative for several treatment regimes in Table 8. Spacing for larger diameters increases the value of future harvests by $11.3 million/yr and provides $7.4 million/yr in small wood from thinnings. However, these gains are offset by reduced harvest levels, estimated at $20.1 million/yr of timber value foregone. Pruning 400 sph adds $8.6 million/yr future clear log value, but causes a harvest level loss of $11.1 million/yr.
Among the treatments with a positive return, pruning 800 sph adds $10.8 million/yr in clear log value, which is partially offset by $3.1 million/yr of foregone harvest level. Conversion of hemlock to Douglas-fir without lifting the site index creates value in two ways. Increased harvest levels add $1.5 million/yr and the more valuable species adds $10.7 million/yr. Including the site index lift assumption increases the harvest level gain by $7.1 million/yr.
The modelling system used in the analysis did not have the flexibility to seek subsets of the candidate stands, to test alternative budget levels for individual treatments. By treating all stands, the above results represent the average results to be expected in TFL 39. With budget limitations and alternative investment opportunities such as fertilization, only selected stands would be treated. Stand-level economic analysis will assist in selecting stands for treatment to provide returns that exceed the averages.
Annual Silviculture Harvest & Mill Net Employment Wood value Time to Investment
Treatment Regime Budget LTHL Employment Employment created created maturity return
($ millions) (+/- %) (FTE jobs) (FTE jobs) (FTE jobs) ($ millions) (years) (% interest)
Spacing for larger diameters 2.5 -9.3 103 -217 -114 -1.4 45 n/a
Pruning for clear wood (400 sph) 3.1 -4.2 36 -197 -161 -2.6 65 n/a
Pruning for clear wood (800 sph) 4.4 -1.0 53 -48 5 7.7 65 0.86
Conversion of hemlock to D-fir 1.6 0.7 14 32 46 12.2 80 2.57
(without site index lift)
Conversion of hemlock to D-fir 1.6 4.0 14 186 200 19.3 70 3.62
11. Wildlife habitat enhancement
Weyerhaeuser manages the forests of TFL 39 with due consideration for wildlife habitat now and into the future. Harvest rates and locations maintain large reserves of environmentally sensitive forest, riparian forest, and wildlife tree patches (Table 2). Additionally, Weyerhaeuser has zoned approximated 35% of the TFL 39 commercial forest as Habitat or Old Growth forests, with additional protection and mature tree retention. The new variable retention (VR) silviculture system reserves patches of trees in all harvest units. The base case includes incremental
netdowns of 5%, 7.5% and 70% for Timber, Habitat and Old Growth zones, respectively. Figure 6 illustrated that harvest levels are significantly impacted by the VR silviculture system.
Recently, the company has considered the benefits of accelerating the development of old growth characteristics in second growth stands. Past harvesting has resulted in areas of dense hemlock regeneration along creeks and rivers, and in upland areas. Biologists and ecologists believe that opening up these stands will provide landscape diversity, and improve access and forage values for wildlife species. Treatments being considered include thinning stands to very low density, and creation of 0.1 – 0.4 ha openings in the second-growth stands. Treatments would mainly be targeted at reserved areas, particularly along riparian zones, although some consideration is also given to using the treatments in upland areas.
The stands considered for treatment are presently about 40 years old. The treatments would be a one-time entry, with the stands left to develop old-growth characteristics afterwards. Some small wood might be salvaged from the operations, providing a short-term gain in timber supply. As these stands subsequently develop, they are expected to contribute to meeting old seral forest cover requirements by, on average, 110 years of age, and potentially free some existing old growth stands for harvest.
Three aspects of the foregoing were tested in the models.
1. What would be the impact of reduced old seral forest cover constraints? 2. What is the short-term gain in timber supply from treatments in riparian areas? 3. What is the timber supply impact of treatments in natural-origin upland THLB stands?
These effects were tested in Blocks 1, 2, and 3|4. Results for Block 1 are illustrated in the following figures.
years. The LTHL for Block 1 rises by 2.5%. Results for the other blocks were a rise of 0.5% (Block 2) and 2.7% (Block 3|4). The increases result in a 1.5% rise in the LTHL for TFL 39.
FIGURE 23. Block 1 harvest flow with the old seral age requirement reduced to 110 years
Figure 24 illustrates the effect on harvest levels of small-wood salvage from the variable density treatments in the riparian zones for Block 1. Blocks 2 and 3|4 show a similar increase in harvests 30 to 80 years from now. The total increase in the TFL 39 harvest level for the period is <