This document is the author’s post-print version of this
arti-1
cle, i.e. the final draft version after review. The final document
2
will be printed in
Nuclear Instruments and Methods in Physics
Re-3
search Section A: Accelerators, Spectrometers, Detectors and
As-4
sociated Equipment
and can be viewed online by using the DOI
5
10.1016/j.nima.2011.09.046. We also refer to this URL for citing
6
details.
Secondary radiation in transmission-type X-ray tubes:
8simulation, practical issues and solution in the context
9of X-ray microtomography
10Matthieu N. Boonea, Jelle Vlassenbroeckb, Steven Peetermansc, Denis Van
11
Looa,d, Manuel Diericka, Luc Van Hoorebekea
12
aGhent University, Dept. Physics and Astronomy 13
Proeftuinstraat 86; B-9000 Gent, Belgium
14
binCT 15
Technologiepark 3; B-9052 Zwijnaarde, Belgium
16
cNeutron Imaging and Activation Group 17
Paul Scherrer Institut; Villigen, Switzerland
18
dGhent University, Dept. Soil Management and Soil Care 19
Coupure Links 653; B-9000 Gent, Belgium
20
Abstract
21
In laboratory-based X-ray radiography and computed
tomogra-phy, the X-rays are assumed to originate from one single focal spot
with a finite spot size, which is generated by focussing accelerated
electrons on the target material. However, apart from this focal
spot, X-rays can also be produced elsewhere in the tube system. A
major contribution of this parasitic radiation originates from
elec-trons that are backscattered from the target material, into the
X-ray tube system, where they can produce so-called
off-focus
or
sec-ondary
X-rays. This phenomenon has been widely studied for
ro-tating anode X-ray tubes in medical imaging systems, but not for
transmission-type microfocus X-ray tubes. This paper presents a
study on the origin of secondary radiation in this kind of X-ray
tubes, which is performed by Monte Carlo simulations and by
ex-perimental measurements. The impact of this phenomenon on the
imaging process is studied, and two correction methods are
pro-posed, both on the hardware and on the software level.
Keywords: X-ray tube, focal spot, Monte Carlo simulation, secondary
22
radiation, off-focal radiation, BEAMnrc
23
PACS:87.59.B-, 07.85.Fv
1. Introduction
25
In laboratory-based X-ray radiography and tomography, X-rays are usually
26
produced by an X-ray tube. In such a system, electrons emitted from the
27
cathode are accelerated and focussed on the target, which consists of a high-Z
28
material where Z is the atomic number, usually tungsten or molybdenum. The
29
electrons are decelerated in this target material, producing bremsstrahlung and
30
characteristic rays. However, some electrons are backscattered into the
X-31
ray tube system. In high-power rotating anode X-ray tubes, these electrons are
32
accelerated back towards the anode under the influence of the electric field,
inter-33
acting again with the target material and thus generating additional radiation,
34
usually originating outside the primary focal spot. This effect has previously
35
been called secondary, parasitic, extrafocal or off-focal radiation and can often
36
be recognised by the presence of some sort of secondary image in the
radio-37
graphs. Although it has often been ignored in spectrum calculations[1], it has
38
been shown that the contribution of the effect cannot be neglected[2].
39
In contrast to high-power rotating anode X-ray tubes, transmission-type
mi-40
crofocus X-ray tubes usually consist of a separate acceleration module and
fo-41
cussing module. Due to this modular design, the electric field and the electron
42
acceleration near the target is negligible. The backscattered electrons are not
43
accelerated towards the target, but instead they interact with the tube
hous-44
ing material, creating additional X-rays inside this structure. Depending on
45
the tube design and used materials, the origin, shape and spectrum of this
sec-46
ondary radiation can vary. Although several studies have been published on
47
the topic of the secondary radiation in rotating anode X-ray tubes[2, 3, 4, 5, 6]
48
including several patents for reduction (e.g. patent #6052434, patent #4905268
49
and patent #5493599), the effect is almost undocumented for transmission-type
50
microfocus tubes[7].
51
This paper presents a study of the secondary radiation effect in a
transmission-52
type microfocus X-ray tube, which has been observed at the the high-resolution
53
micro-CT (µCT) setup of the Ghent University Center for X-ray Tomography
54
(UGCT –http://www.ugct.ugent.be)[8]. This effect became evident inµCT
55
scans where unrealistic density profiles appeared. The total X-ray source was
56
simulated using BEAMnrc[9, 10, 11], which is based on the EGSnrc[12] code
57
system, and secondary radiation was shown to be caused by the internal
de-58
sign of the tube. Both a hardware and a software correction for this effect are
59
presented, along with their results.
60
2. Materials and methods
61
2.1. Experimental setup
62
All experiments were carried out using a FeinFocus X-ray tube with the
63
FXE160.51 transmission head. The target is a 5µm thick tungsten layer on a
64
diamond backing (thickness 250µm). Tube voltage was set to 80 kV at a tube
65
current of 62.5µA. This resulted in a primary spot size of approximately 3µm.
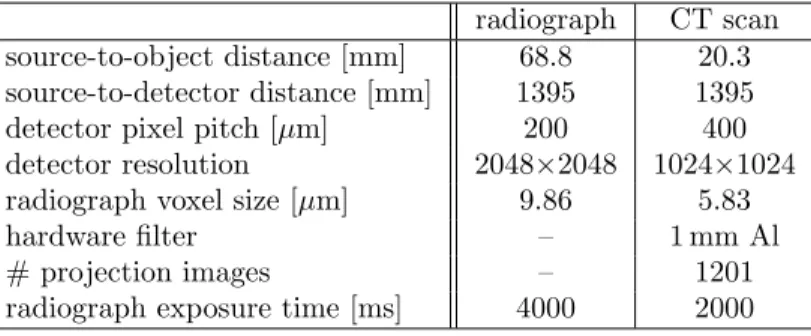
Table 1: Experimental parameters for both radiographs and CT scan
radiograph CT scan
source-to-object distance [mm] 68.8 20.3
source-to-detector distance [mm] 1395 1395
detector pixel pitch [µm] 200 400
detector resolution 2048×2048 1024×1024
radiograph voxel size [µm] 9.86 5.83
hardware filter – 1 mm Al
# projection images – 1201
radiograph exposure time [ms] 4000 2000
Images were acquired using a PerkinElmer XRD 1620 CN3 CS flat-panel
de-67
tector (pixel size: 200×200µm2) with CsI scintillator. The secondary radiation
68
effect was studied using both radiography and tomography (CT) data. The
sam-69
ple used for radiography was a graphite cylinder (diameter 0.9 mm) with a small
70
lead drop. This small drop acts approximately as an ”‘impulse function”’, to
71
visualise the source distribution. AµCT scan of a sandstone (diameter 4.8 mm)
72
was used to illustrate the effect of the corrections on CT reconstruction. The
73
experimental parameters of both radiography and CT scan are given in Table 1.
74
The software package Octopus[13] was used for the tomographic reconstruction.
75
A simple beam-hardening correction was applied on the data[13].
76
2.2. Monte Carlo simulations
77
Simulations of the X-ray tube were carried out using BEAMnrc. It has
78
been shown that the EGSnrc/BEAMnrc system performs well in the
calcula-79
tion of charged particle backscattering for the energy range of interest[14, 15].
80
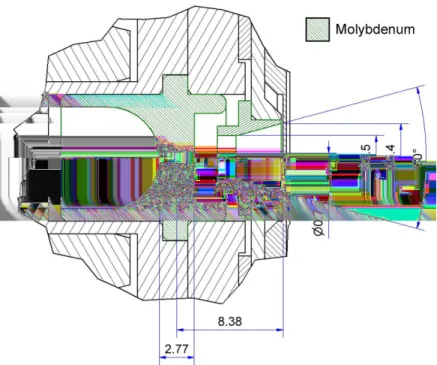
Detailed design plans of the X-ray tube were provided by the manufacturer of
81
the system (Figure 1). The electrons originate from the left-hand side of the
82
figure, following the dotted central line, passing the aperture in the middle of
83
the figure. The electrons hit the target at the right-hand side of the figure,
cre-84
ating X-rays. Some of these electrons are backscattered into the tube system.
85
Due to the large aspect ratio of the aperture (a length of 2.77 mm at a
diam-86
eter of 0.7 mm), the fraction of backscattered electrons passing this aperture
87
can be neglected. For this reason, simulations were limited to the final 1 cm
88
of the tube head, neglecting the radiation originating from behind the
aper-89
ture. The electron beam was simulated as a pencil beam with a finite diameter
90
of 3µm, exactly on the symmetry axis. Several acceleration voltages (40 kV,
91
80 kV and 120 kV) were simulated. For each simulation 10 runs of 5000000
92
electrons were used, each with a different random number seed to minimize
ac-93
cidental correlations. Uniform bremsstrahlung splitting (splitting factor 1000)
94
was applied for variance reduction[9]. Cutoff energies were set to 0. Electron
95
impact ionization (Kawrakow) and atomic relaxations were turned on to obtain
96
characteristic radiation. Photon cross-sections were imported from the NIST
Figure 1: Schematic drawing of the X-ray tube head. The tungsten target is at the right-hand side of the drawing. Structures made in molybdenum are indicated. All distances are given in millimeter.
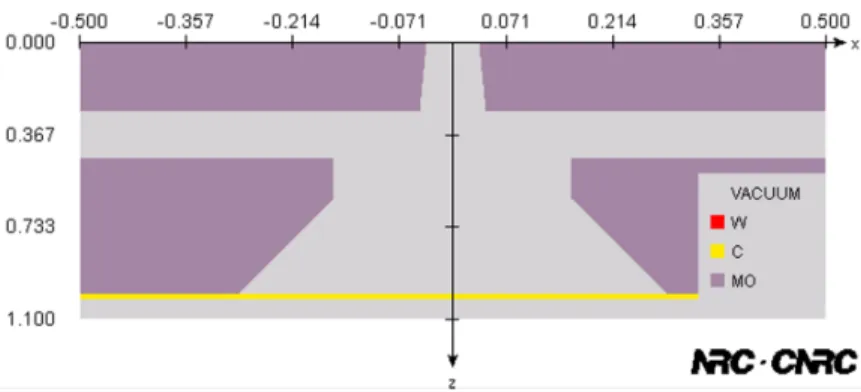
XCOM library. The simulated geometry can be seen in Figure 2, where the
98
pencil beam follows thez-axis fromz = 0.000 cm to z = 1.000 cm, where the
99
target material begins. Only X-rays registered at the scoring planez= 5.000 cm
100
and −0.500 cm≤x, y ≤0.500 cm are tallied, corresponding to a cone angle of
101
11.3◦, which is a realistic value for CT. The attenuation in air between target
102
and detector is not included by assuming vacuum conditions inside and outside
103
the tube. For each tallied X-ray, thex,y and zposition of the creation of this
104
X-ray as well as its energy is logged. For the analysis of the X-ray spectrum,
105
simulations at an acceleration voltage of 80 kV were performed for both the
com-106
plete tube system and the system with the molybdenum structures replaced by
107
vacuum. All other simulation parameters were kept unchanged.
108 109
2.3. Correction methods
110
A software correction was implemented in LabViewR 8.6 to reduce the
sec-111
ondary radiation artifacts. It is derived from the assumption that the measured
112
image Imeas is composed of two separate contributions: one projection image
113
IF S created by the primary focal spot, and one projection image ISS created
Figure 2: Simulated geometry of the FeinFocus design. Thez-axis is also the symmetry axis. Electrons originate from|x, y| ≤ 0.0003 cm, z = 0.0000 cm. The thin tungsten target is not visible on the diamond backing. All distances are indicated in centimeter.
by the secondary source:
115
Imeas =IF S+ISS (1)
in which both IF S andISS are a convolution of the ideal image Iideal and
116
the distribution of each source. The primary spot Sprim has a very narrow
117
distribution around|x, y|= 0 cm, while the secondary source has a distribution
118
Ssecwhich comprises all photons not included inSprim:
119
Imeas=Iideal∗Sprim+Iideal∗Ssec (2)
The distribution Sprim is assumed to be very narrow and is approximated
120
by an ideal Diracδfunction. When the measured intensity is convolved with a
121
functionSsec0 approximating the secondary sourceSsecand second-order
contri-122
butions are neglected, the contribution of the secondary source can be
approxi-123
mated:
124
Imeas∗Ssec0 =Iideal∗(Sprim∗Ssec0 ) +Iideal∗(Ssec∗Ssec0 )
≈Iideal∗Ssec0 +Iideal∗(Ssec∗Ssec0 ) (3)
≈Iideal∗Ssec0 (4)
≈ISS
This contribution is then substracted from the measured image, resulting in
125
an approximation of the image made by the primary focal spot.
126 127
The hardware correction consists of a thin lead collimator with a diameter of
128
approximately 1 mm that can be mounted on the X-ray tube. Special care must
129
be taken to position the opening of the collimator well aligned relative to the
130
electron beam axis, and close enough to the X-ray tube. However, as it hinders
131
the heat transfer from the target material and target backing, it should remain
at a certain distance. A typical working distance of approximately 2 mm was 133 used. 134 3. Results 135 3.1. Simulation 136
Taking advantage of the cylindrical symmetry of the setup, the radial
dis-137
tribution of the origin of the tallied X-rays is plotted in Figure 3. The intensity
138
axis depicts the number of tallied photons and has been clipped for scaling
rea-139
sons. Figure 4 shows the cumulative normalised intensity as a function of the
140
distance r from the symmetry axis. Depending on the tube voltage,
approx-141
imately 85% to 90% of the radiation originates from the primary focal spot
142
(r≈0 in Figure 4). It can be clearly seen that most of the secondary radiation
143
for this specific geometry originates from a ring (inner radius ≈ 0.16 cm and
144
outer radius≈0.28 cm) around the primary focal spot, which can be associated
145
with the oblique structure closest to the target. The peak atr= 0.16 cm can
146
be associated with the edge of this structure perpendicular to the target plane.
147
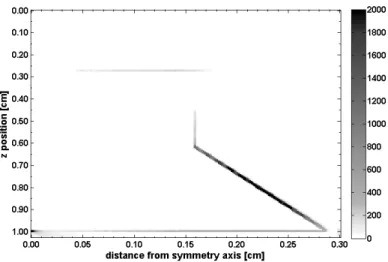
This can also be verified in the 2D distribution of the generated X-rays, as a
148
function of both thezposition and the distancerfrom the symmetry axis
(Fig-149
ure 5), wherez = 1.000 corresponds to the W target. The geometry depicted
150
in Figure 2 can be easily recognized in this distribution. It must be noted here
151
that a part of the off-focal radiation originates from the target material itself.
152
This radiation can originate from electrons that are backscattered twice, and
153
fluorescent radiation from the target after absorption of X-rays created mainly
154
in the tube system.
155
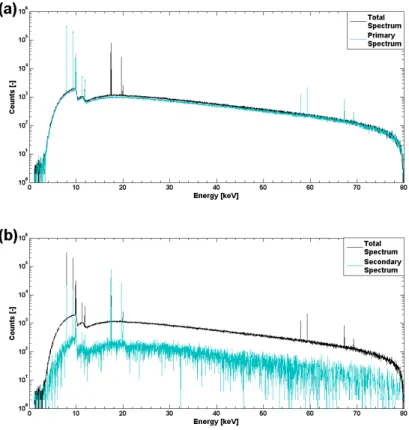
The energy spectrum of radiation with and without the molybdenum structures
156
is shown in Figure 6(a). The difference between both spectra, i.e. the
contri-157
bution of the secondary radiation, is shown together with the total spectrum in
158
Figure 6(b). The difference between primary and secondary spectrum can be
159
mostly found in the characteristic radiation of tungsten and molybdenum, while
160
the bremsstrahlung spectrum remains similar. Additionally, some characteristic
161
radiation from tungsten is present in the secondary radiation, originating from
162
the target plane as discussed earlier.
163
3.2. Correction methods
164
Both correction methods have been applied to the radiograph of the lead
165
dot. It can be seen in Figure 7(a) that the total X-ray source (primary focal
166
spot and secondary radiation source) is imaged, and the contribution of the
sec-167
ondary radiation is clearly recognised as a ring-shaped structure. The results
168
of the software correction can be seen in Figure 7(b). The estimated secondary
169
sourceSsec0 is a ring structure of which the geometric parameters are derived
170
directly from the simulation (outer radius: 2.75 mm; inner radius: 1.7 mm) and
171
the magnification geometry. The magnitude of the contribution is obtained by
172
trial and error. The result of the hardware correction can be seen in Figure 7(c).
173
It is clear that the secondary radiation effect is removed almost completely.
Figure 3: Radial intensity distribution of the origin of the X-rays tallied at the scoring plane for different tube voltages.
Figure 4: Cumulative radial intensity distribution of the origin of the X-rays tallied at the scoring plane for different tube voltages.
Figure 5: Distribution of the origin of the X-rays at a tube voltage of 80 kVp as a function of thezposition in the simulation and the distance from the symmetry axis. The gray scale has been clipped to improve visibility.
175
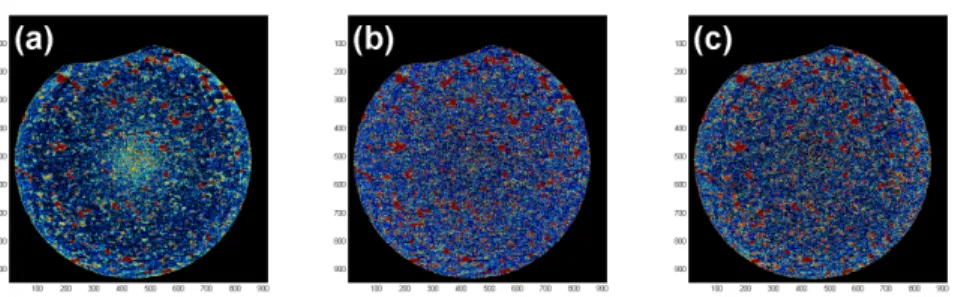
The effect of the secondary radiation on a reconstructed CT slice can be seen in
176
false color in Figure 8(a). The overlap of the primary attenuation image with
177
the secondary attenuation image results in an increased reconstructed
attenu-178
ation coefficient at the bulk of the sample, giving rise to an inverted cupping
179
effect in the CT slice. Although this effect is very small and hard to visualize,
180
it can still hinder good image analysis. The software correction, again using
181
theoretically derived parameters except for the magnitude of the contribution,
182
removes almost completely this artifact (Figure 8(b)). A similar result is
ob-183
tained with the hardware correction (Figure 8(c)). It must be noted that the
184
scaling in the reconstructed slices varies slightly, caused by the magnitude of
185
the secondary radiation effect.
186
4. Discussion
187
The simulation of the secondary radiation effect yields results that
corre-188
spond well with the experimental observation. The effect can be easily
asso-189
ciated with design features inside the tube head. Nevertheless, the secondary
190
radiation effect in general can not be removed by alteration of the design. This
191
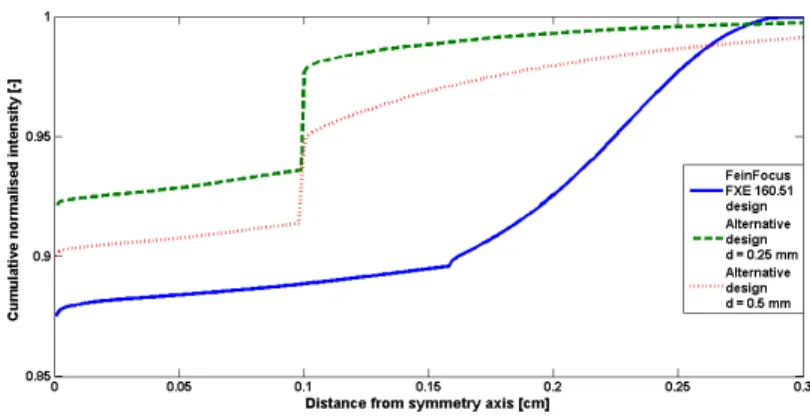
can be verified by the simulation of an alternative design of the tube system,
192
where the inclined structure close to the target material is not present. A simple
193
design, consisting of a slab with only an aperture is shown in Figure 9. The
194
simulation of this design (Figure 10) shows a similar ring-shaped profile, with a
195
high intensity at the edge of the aperture (perpendicular to the target material)
196
and a low intensity on the face of the aperture (parallel to the target). The
Figure 6: (a) The X-ray spectrum of the tube system and the tube system without molybdenum structures, corresponding to the spectrum of the primary focal spot. (b) The X-ray spectrum of the tube system and the difference between the total spectrum and the primary spectrum, corresponding to the spectrum of the secondary radiation.
Figure 7: Radiograph of a small lead drop. (a) Radiograph without collimator (b) Post-processed radiograph (c) Radiograph with collimator
Figure 8: Reconstructed CT slice of a sandstone in false color. (a) Data acquired without collimator (b) use of post-processed projection data (c) Data acquired with collimator
Figure 9: Simulated geometry of the alternative design with distancedbetween aperture and targetd= 0.25 mm. Thez-axis is also the symmetry axis. Electrons originate from
kx, y| ≤0.0003 cm,z= 0.0000 cm. The thin tungsten target is not visible on the diamond backing. All distances are indicated in centimeter.
intensity of the latter is highly dependant on the distance between the target
198
material and the aperture. This distance should ideally be zero, but as contact
199
between both structures should be avoided this is practically not possible. It
200
must also be noted that a large aperture can be benificial in order to allow the
201
usage of a collimator with a large diameter, which is more practical.
202
Although software correction of the secondary radiation yields a well-corrected
203
image and CT reconstruction, it fails to remove the effect completely
(Fig-204
ure 7(b)). This can be due to several reasons. As the secondary radiation is
205
not originating from the target, the distance from X-ray source to sample and
206
detector is slightly different for this radiation. As a consequence, the geometric
207
magnification of the effect is not exactly determined. Additionally, the shape
208
of the secondary focal spot is approximated by a uniform ring-structure. It can
209
be seen in Figure 3 that this uniformity is not consistent with the simulations.
210
Another reason can be found in equation (4), where |Ssec∗Ssec0 | is neglected.
211
Simulations have shown this contributionSsecto be of the order of 10%
(Fig-212
ure 4), which makes this assumption questionable.
213 214
Figure 10: Normalised cumulative counts for the geometry shown in Figure 9 with dis-tancedbetween aperture and targetd= 0.5 mm andd= 0.25 mm, and the FXE160.51 design as discussed in previous sections
As mentioned before, the intensity of Ssec0 varies depending on the
experi-215
mental conditions and is to be set by trial and error based on the projection
216
data. This induces operator-dependant results. A realistic a-priori estimation
217
of this intensity is not possible, due to the non-uniformity of the secondary
ra-218
diation and the spectrum of the created X-rays. In this case, a tungsten target
219
is used, while the inner structure of the tube is made of molybdenum.
Fur-220
thermore, the X-rays originating from the inner structure are attenuated by
221
the target material. Both effects will often result in a different average X-ray
222
energy from the inner structure and thusa different relative contribution of the
223
secondary radiation.
224
A third limitation of the software correction is the presence of highly
at-225
tenuating structures outside the field of view. Due to the very large size of
226
the secondary source compared to the primary spot, these structures can have
227
secondary projections inside the field of view. However, as their primary
projec-228
tion is not imaged, they can not be corrected. This effect is commonly caused
229
by sample holders, creating a vertical change of the reconstructed attenuation
230
coefficient inside the sample.
231 232
5. Conclusion
233
In this work, we have shown that secondary or off-focal radiation arises from
234
electron back-scattering in transmission-type microfocus X-ray tubes. This
ef-235
fect can be successfully simulated using Monte Carlo simulations, from which
236
the shape and the intensity of this secondary source can be derived. For the
237
experimental setup at UGCT, this effect has a non-negligible contribution of
238
approximately 10% to the X-ray flux at the detector plane. Consequently,
ar-239
tifacts can be seen on X-ray radiographs and tomographic reconstructions. To
minimize these artifacts, two separate correction methods have been proposed.
241
A post-processing software filter can be applied to estimate and correct for the
242
contribution of the secondary source in the measured image. Although this
243
works well in some cases, it has several limitations such as the limited field of
244
view of the detector plane. A hardware solution, consisting of a simple
collima-245
tor, can also be used to minimize these artifacts.
246
6. Acknowledgements
247
The authors are very grateful to Thorsten Froeba from X-RAY WorX GmbH
248
for the detailed description of the X-ray tube and the fruitful discussions on this
249
topic. The Fund for Scientific Research Flanders(FWO-Vlaanderen)is greatfully
250
acknowledged for their financial support(project G.0100.08).
251
References
252
[1] G. G. Poludniowski, Calculation of x-ray spectra emerging from an x-ray
253
tube. Part II. X-ray production and filtration in x-ray targets, Med. Phys.
254
34 (6) (2007) 2175–2186.
255
[2] R. Birch, The spectrum and intensity of extra-focal (off-focus) radiation,
256
Br. J. Radiol. 49 (1976) 951–955.
257
[3] R. H. Miettunen, Measurement of extrafocal radiation by computed
radio-258
graphy, Br. J. Radiol. 65 (1992) 238–241.
259
[4] J. Hsieh, Computed tomography : principles, design, artifacts, and recent
260
advances, SPIE Optical Engineering Press, 2003.
261
[5] Z. Wen, N. K. Pelc, W. R. Nelson, R. Fahrig, Study of increased radiation
262
when an x-ray tube is placed in a strong magnetic field, Med. Phys. 34 (2)
263
(2007) 408–418.
264
[6] E. S. M. Ali, D. W. O. Rogers, Quantifying the effect of off-focal radiation
265
on the output of kilovoltage x-ray systems, Med. Phys. 35 (9) (2008) 4149–
266
4160.
267
[7] J. Vlassenbroeck, Advances in laboratory-based X-ray microtomography,
268
Ph.D. thesis, Ghent University, 2009.
269
[8] B. Masschaele, V. Cnudde, M. Dierick, P. Jacobs, L. Van Hoorebeke,
270
J. Vlassenbroeck, UGCT: New x-ray radiography and tomography
facil-271
ity, Nucl. Instrum. Meth. Phys. Res. A 580 (1) (2007) 266–269.
272
[9] D. W. O. Rogers, B. A. Faddegon, G. X. Ding, C. M. MA, J. WE, T. R.
273
Mackie, BEAM - A Monte-Carlo code to simulate radiotherapy treatment
274
units, Med. Phys. 22 (5) (1995) 503–524.
[10] E. Mainegra-Hing, I. Kawrakow, Efficient x-ray tube simulations, Med.
276
Phys. 33 (8) (2006) 2683–2690.
277
[11] M. Fragoso, I. Kawrakow, B. A. Faddegon, T. D. Solberg, I. J. Chetty, Fast,
278
accurate photon beam accelerator modeling using BEAMnrc: a systematic
279
investigation of efficiency enhancing methods and cross-section data, Med.
280
Phys. 36 (12) (2009) 5451–5466.
281
[12] I. Kawrakow, Accurate condensed history Monte Carlo simulation of
elec-282
tron transport. I. EGSnrc, the new EGS4 version, Med. Phys. 27 (3) (2000)
283
485–498.
284
[13] J. Vlassenbroeck, M. Dierick, B. Masschaele, V. Cnudde, L. Van
Hoore-285
beke, P. Jacobs, Software tools for quantification of X-ray
microtomogra-286
phy, Nucl. Instrum. Meth. Phys. Res. A 580 (1) (2007) 442–445.
287
[14] E. S. M. Ali, D. Rogers, Benchmarking EGSnrc in the kilovoltage energy
288
range against experimental measurements of charged particle backscatter
289
coefficients, Phys. Med. Biol. 53 (2008) 1527–1543.
290
[15] E. S. M. Ali, D. Rogers, Energy spectra and angular distributions of charged
291
particles backscattered from solid targets, J. Phys. D: Appl. Phys. 41 (2008)
292
055505 (9pp).