ISSN: 2347-1921
Volume: 14 Issue: 01
Journal of Advances in Mathematics
7503
Median Double Ranked Set Sampling Method
Nuran Medhat Al-Mawan1, 3, El-Houssainy A. Rady1 and Nasr I. Rashwan2
Department of Applied Statistics and Econometric, Institute of Statistical Studies and Research, Cairo University, Cairo, Egypt - Department of Basic Science, Faculty of Engineering, Modern Academy, Cairo, Egypt
Department of Applied Statistics and Econometric, Institute of Statistical Studies and Research, Cairo University, Cairo, Egypt;
Department of Applied Statistics and Econometric, Institute of Statistical Studies and Research, Cairo University, Cairo, Egypt;
Abstract:
In environmental monitoring and assessment, the main focus is to achieve observational economy and to collect data with unbiased, efficient and cost-effective sampling methods. Ranked set sampling (RSS) is one traditional method that is mostly used for accomplishing observational economy. In this article, we sugge sted new sampling method called median double ranked set sampling (MDRSS). The newly suggested sampling method MDRSS is compare to the simple random sampling (SRS), RSS, double ranked set sampling (DRSS), median ranked set sampling (MRSS). When the underlying distributions are symmetric and asymmetric, it is shown that, the variance of the mean estimator under MDRSS is always less than the variance of the mean estimator based on SRS and the other methods.
Indexing Terms/Keywords: Ranked set sampling; Median ranked set sampling; Double ranked set sampling; Relative precision. Language: English Date of Submission: 2018-03-06 Date of Acceptance: 2018-03-20 Date of Publication: 2018-03-30 ISSN: 2347-1921 Volume: 14 Issue: 01
Journal: Journal of Advances in Mathematics Website: https://cirworld.com
ISSN: 2347-1921
Volume: 14 Issue: 01
Journal of Advances in Mathematics
7504
1. Introduction
There are many sampling methods that can be used in surveys of natural resources in Agriculture, Biology, Environmental Management, Forestry, etc. The main objective of whatever sampling method is used is to obtain precise estimates of population parameters with minimum cost and expenditure. One method is ranked set sampling (RSS). RSS becomes an efficient alternative to simple random sampling (SRS) when taking exact measurements of selected units is very costly whereas ranking a small set of selected units is cheap. Ranking may be visually with respect to the study variable or by any inexpensive method. McIntyre (1952) was the first to suggest the RSS method for estimation of pasture and forage yields. McIntyre’s goal was to maintain the unbiased of SRS while effectively incorporating into the estimates the outside information provided by visual inspection. Takahasi and Wakimoto (1968) developed the theory of RSS procedure under the assumption of perfect ranking. Dell and Clutter (1972) showed that the mean estimator under imperfect RSS remains an unbiased estimator of population mean. Muttlak (1997) suggested using median ranked set sampling method (MRSS) to estimate the population mean and he showed that it is more efficiently than the usual RSS method. Al-Saleh and Al-Kadiri (2000) suggested double ranked set sampling method (DRSS) for estimating the population mean and they showed that the sample mean based on DRSS is more efficient than the sample mean with RSS.
In this paper, modification for the RSS method is considered, namely median double ranked sampling. The newly suggested sampling method (MDRSS) is compared with RSS, MRSS and DRSS. It is shown that for the probability distributions considered in this study, MDRSS unbiased estimator has less variance than all the other methods. Computer simulation results are given to compare the efficiency for the es timators based on SRS with its counterparts RSS, MRSS, DRSS and MDRSS.
2. Ranked Set Sampling Methods
This section is concern with methods of ranked set sampling given a definition of each method and defined the mean and the variance of each case in the methods. Let X1, X2, Xn be a random sample with probability density
function f(x) with mean μ and variance σ2. Let X11, X12, X1n; X21, X22, ..., X2n; ..., Xn1, Xn2, ..., Xnn be independent random variables all with the same cumulative distribution function F(x). Let X (i: n) denotes the ith order statistic
from the ith sample of size n (i =1, 2, ..., n). The cycle may be repeated m times to get nm units. Let X (i: n) j
denotes the jth cycle of size m (j= 1, 2, ..., m). The variance or the mean square error of the sample means for
the RSS, DRSS, MRSS and MDRSS were calculated using the moments of the order statistics for the distributions considered in the study (see Harter and Balakrishnan (1996) and Balakrishnan and Chen (1997)). The relative efficiency (RE) of estimating the population mean using any of the RSS based methods with respect to the usual estimator SRS is defined as
𝑅𝐸(𝑋̅𝑆𝑅𝑆, 𝑋̅𝑅𝑆𝑆,𝑆) = 𝑉𝑎𝑟(𝑋̅𝑆𝑅𝑆)
𝑉𝑎𝑟(𝑋̅𝑅𝑆𝑆,𝑆)
Here XSRS and XRSS, s is both unbiased estimators. In case of biased estimator, the variance is replaced by the
MSE of the estimator where
MSE (𝑋̅RSS, s) = Var (𝑋̅RSS, s) + [E (𝑋̅RSS, s − μ)]2.
2.1. Ranked Set Sampling
The RSS scheme can be described as follows: In order to draw a sample of size n, identify n2 units from the target population. The n units in each sample are ranked visually or by any inexpensive method with respect to the variable of interest. From the first set of n units, the smallest ranked unit is measured. From the second set of n units, the second smallest ranked unit is measured. The process is continued until from the 𝑛𝑡ℎ set of n units the largest ranked until is measured. The estimator of the population mean for RSS of size n is given by
ISSN: 2347-1921
Volume: 14 Issue: 01
Journal of Advances in Mathematics
7505
with varianceVar(𝑋̅RSS) = 𝑛21𝑚∑𝑛𝑖=1𝜎2(𝑖:𝑛), where 𝜎2(𝑖:𝑛)= 𝐸(𝑋(𝑖:𝑛) − 𝜇(𝑖:𝑛))2 = σ2 − ∑𝑛𝑖=1(𝜇(𝑖:𝑛)− 𝜇)2.
The RE for the symmetric and asymmetric distributions are
𝑅𝐸(𝑋̅𝑆𝑅𝑆, 𝑋̅𝑅𝑆𝑆) =𝑉𝑎𝑟(𝑋̅𝑉𝑎𝑟(𝑋̅𝑆𝑅𝑆) 𝑅𝑆𝑆).
2.2. Median Ranked Set Sampling
Muttlak (1997) introduced Median ranked set sampling (MRSS) procedure for estimating the population mean. MRSS procedure is explained as follows: for even sample size n, identify n2 units from the target population. Each sample is ranked in itself as in ranked set sampling design. Select the (𝑛
2)
𝑡ℎ smallest rank from the first 𝑛 2
sets and select the (𝑛+2
2 )
𝑡ℎ smallest rank from the other 𝑛
2 sets. Similarly, for odd sample size n, select the ( 𝑛+1
2 ) 𝑡ℎ
smallest rank from all sets. The sample means under MRSS for even and odd n are given below:
𝑋̅MRSSE = 1 𝑛𝑚∑ (∑ 𝑋𝑖 (𝑛2:𝑛)𝑗+ ∑𝑛𝑖=2𝑛+1𝑋𝑖 (𝑛+22 :𝑛)𝑗) 𝑛 2 𝑖=1 𝑚 𝑗=1 and 𝑋̅MRSSO = 1 𝑛𝑚∑𝑚𝑗=1(∑𝑛𝑖=1𝑋𝑖 (𝑛+12 :𝑛)𝑗),
Both 𝑋̅MRSSE and 𝑋̅MRSSO are unbiased estimators. The variances of Var(𝑋̅MRSSE) and Var(𝑋̅MRSSO) respectively, are
Var(𝑋̅MRSSE) = 1 𝑛2𝑚(∑ 𝑉𝑎𝑟 (𝑋𝑖(𝑛2:𝑛 )) + ∑ 𝑉𝑎𝑟 (𝑋𝑖(𝑛+22 :𝑛)) 𝑛 𝑖=𝑛2+1 𝑛 2 𝑖=1 , Var (𝑋̅MRSSO) = 1 𝑛2𝑚(∑ 𝑉𝑎𝑟(𝑋𝑖 (𝑛+12 :𝑛) 𝑛 𝑖=1 ).
The RE for the symmetric distribution is
𝑅𝐸(𝑋̅𝑆𝑅𝑆, 𝑋̅𝑀𝑅𝑆𝑆) = 𝑉𝑎𝑟(𝑋̅𝑆𝑅𝑆) 𝑉𝑎𝑟(𝑋̅𝑀𝑅𝑆𝑆) ,
and 𝑅𝐸(𝑋̅𝑆𝑅𝑆, 𝑋̅𝑀𝑅𝑆𝑆) = 𝑉𝑎𝑟(𝑋̅𝑆𝑅𝑆)
𝑀𝑆𝐸 (𝑋̅𝑀𝑅𝑆𝑆) for asymmetric distribution.
2.3. Double Ranked Set Sampling
Al-Saleh and Al-Kadiri (2000) introduced double ranked set sampling (DRSS) procedure for estimating the population mean. In order to select a double ranked set sample of size n, the experimenter needs to identify n3 units from the target population. This may be difficult when an epidemic breaks out in some area or in queuing problems when data arrive in batches of varying sizes. Moreover, there may be a shortage of experimental units or ranking is difficult, time consuming and costly, see Samawi (2011) and Haq et al. (2013). In all such situations, the balanced DRSS cannot be conducted with full confidence or it is costly. The DRSS scheme can be described as follows: In order to draw a sample of size n, identify n3 units from the target population. Randomly allocate these units ton sets each of size n2. Apply RSS procedure to n sets in order to obtain n ranked set samples each of size n. Again, apply the RSS procedure to these n ranked sets, each of size n, to obtain a double ranked set sample of size n. The estimator of the population mean for DRSS of size n is given by
𝑋̅DRSS = 𝑛𝑚1 ∑𝑚𝑗=1∑𝑛𝑖=1𝑋∗(𝑖:𝑛 )𝑗, with variance Var(𝑋̅DRSS) = 1 𝑛2𝑚∑ 𝜎 ∗2 (𝑖:𝑛 ) 𝑛 𝑖=1 , where 𝜎∗2(𝑖:𝑛) = E (X (i: n) − μ (i: n))2.
ISSN: 2347-1921
Volume: 14 Issue: 01
Journal of Advances in Mathematics
7506
𝑅𝐸(𝑋̅𝑆𝑅𝑆, 𝑋̅𝐷𝑅𝑆𝑆) = 𝑉𝑎𝑟 (𝑋̅𝑆𝑅𝑆) 𝑉𝑎𝑟 (𝑋̅𝐷𝑅𝑆𝑆) ,
and 𝑅𝐸(𝑋̅𝑆𝑅𝑆, 𝑋̅𝐷𝑅𝑆𝑆) = 𝑉𝑎𝑟 (𝑋̅𝑆𝑅𝑆)
𝑀𝑆𝐸 (𝑋̅𝐷𝑅𝑆𝑆) for asymmetric distribution.
3. Median Double Ranked Set Sampling Method
The MDRSS scheme can be described as follows: In order to draw a sample of size n, we identify n3 units from the target population. Randomly allocate these units to n sets each of size n2. Apply RSS procedure to n sets in order to obtain n ranked set samples each of size n. Apply the MRSS procedure to these n ranked sets, each of size n, to obtain a median double ranked set sample of size n. Let 𝑋∗
1(𝑛2:𝑛),𝑋∗2(𝑛2:𝑛 ),...,𝑋∗2𝑛(𝑛2:𝑛),𝑋∗𝑛+22 (𝑛+22 :𝑛),... ,
𝑋∗
𝑛(𝑛+22 :𝑛)denote the MDRSSE. For odd sample size, let 𝑋∗𝑖(𝑛+12 :𝑛)be the median of the ith sample of the rank 𝑛+1
2
(i = 1, 2, ..., n). And 𝑋∗
1(𝑛+12 :𝑛) , 𝑋∗2(𝑛+12 :𝑛),..., 𝑋∗𝑛(𝑛+12 :𝑛) denote the measured MDRSSO. The sample means under
MDRSS for even and odd n are given below:
𝑋̅MDRSSE = 1 𝑛𝑚∑ (∑ 𝑋 ∗ 𝑖(𝑛2:𝑛 )𝑗+ ∑ 𝑋∗𝑖(𝑛+22 :𝑛)𝑗) 𝑛 𝑖=𝑛2+1 𝑛 2 𝑖=1 𝑚 𝑗=1 and 𝑋̅MDRSSO = 1 𝑛𝑚∑ (∑ 𝑋 ∗ 𝑖(𝑛+12 :𝑛)𝑗) 𝑛 𝑖=1 𝑚 𝑗=1
The variances of Var(XMDRSSE) and Var(XMDRSSO) respectively, are
Var(𝑋̅MDRSSE) = 𝑛21𝑚(∑ 𝑉𝑎𝑟 (𝑋∗𝑖(𝑛 2:𝑛)) + ∑ 𝑉𝑎𝑟(𝑋 ∗ 𝑖(𝑛+22 :𝑛))) 𝑛 𝑖=𝑛2+1 𝑛 2 𝑖=1 , Var(𝑋̅MDRSSO) = 𝑛21𝑚(∑ 𝑉𝑎𝑟 (𝑋∗𝑖(𝑛+1 2 :𝑛))) 𝑛 𝑖=1 .
It is important to note that, using MDRSSE method when n is even, the measured units 𝑋∗
1(𝑛2:𝑛), 𝑋∗2(𝑛2:𝑛),..., 𝑋∗𝑛2(𝑛2:𝑛)
are iid, also, 𝑋∗𝑛 2( 𝑛 2:𝑛) , 𝑋∗𝑛+2 2 ( 𝑛+2 2 :𝑛) ,..., 𝑋∗
𝑛(𝑛+22 :𝑛) are iid and using MDRSSO when n is odd, the measured units
𝑋∗
1(𝑛+12 :𝑛) , 𝑋∗2(𝑛+12 :𝑛),..., 𝑋∗𝑛(𝑛+12 :𝑛) are iid.
The RE for the symmetric distribution is
𝑅𝐸(𝑋̅𝑆𝑅𝑆, 𝑋̅𝑀𝐷𝑅𝑆𝑆) = 𝑉𝑎𝑟(𝑋̅𝑆𝑅𝑆) 𝑉𝑎𝑟(𝑋̅𝑀𝐷𝑅𝑆𝑆) ,
and 𝑅𝐸(𝑋̅𝑆𝑅𝑆, 𝑋̅𝑀𝐷𝑅 𝑆𝑆) = 𝑉𝑎𝑟(𝑋̅𝑆𝑅𝑆)
𝑀𝑆𝐸(𝑋̅𝑀𝐷𝑅𝑆𝑆) for asymmetric distribution.
Lemma (i) 𝑿̅M D R S S E and 𝑿̅M D RS SO are unbiased estimators.
(ii) Var(𝑋̅MDRSSE), Var(𝑋̅MDRSSO) ≺ Var (𝑋̅SRS).
(iii) If the distribution is not symmetric about μ, then the mean square error (MSE) of 𝑋̅MDRSSO is less than the
variance of Var(𝑋̅S R S).
Proof. To prove (i), if n is odd, we have
E(𝑋̅MDRSSO) = 1 𝑛𝑚∑ (∑ 𝐸(𝑋 ∗ 𝑖(𝑛+12 :𝑛)𝑗)) 𝑛 𝑖=1 𝑚 𝑗=1 , = 1 𝑛𝑚∑ (∑ 𝜇 ∗ (𝑛+12 :𝑛)) 𝑛 𝑖=1 𝑚 𝑗=1 = 1 𝑛𝑚(𝑛𝑚 𝜇 ∗ (𝑛+1 2 )) = 𝜇 ∗ (𝑛+1 2 ) ,
ISSN: 2347-1921
Volume: 14 Issue: 01
Journal of Advances in Mathematics
7507
Since the distribution is symmetric about μ, then median = mean, which implies 𝜇∗ (𝑛+1 2 )= 𝜇( 𝑛+1 2 )= 𝜇. Therefore: E(𝑋̅MDRSSO) = μ. If n is even, then E(𝑋̅MDRSSE) = 1 𝑛𝑚∑ (∑ 𝐸(𝑋 ∗ 𝑖(2𝑛:𝑛)𝑗) + ∑𝑛𝑖=2𝑛+1𝐸(𝑋∗𝑖(𝑛+22 :𝑛)𝑗)) 𝑛 2 𝑖=1 𝑚 𝑗=1 , = 1 𝑛𝑚∑ (∑ 𝜇 ∗ (2𝑛:𝑛)+ ∑𝑛𝑖=2𝑛+1𝜇∗(𝑛+22 :𝑛)) 𝑛 2 𝑖=1 𝑚 𝑗=1 = 1 𝑛𝑚( 𝑛𝑚 2 𝜇 ∗ (𝑛 2)+ 𝑛𝑚 2 𝜇 ∗ (𝑛+2 2 )) = 1 2( 𝜇 ∗ (𝑛 2)+ 𝜇 ∗ (𝑛+2 2 ))
Since the distribution is symmetric about μ, then 𝜇∗ (𝑛 2)+ 𝜇 ∗ (𝑛+2 2 )= 2𝜇 ∗= 2μ. Therefore: E(𝑋̅MDRSSE) = 12 (2μ) = μ.
To prove (ii), If n is even, then
Var(𝑋̅MDRSSE) = 1 𝑛2𝑚(∑ 𝑉𝑎𝑟 (𝑋 ∗ 𝑖(2𝑛:𝑛)) + ∑𝑛𝑖=2𝑛+1𝑉𝑎𝑟(𝑋∗𝑖(𝑛+22 :𝑛))) 𝑛 2 𝑖=1 = 1 𝑛2𝑚(∑ 𝜎∗2𝑖(𝑛2:𝑛 )+ ∑𝑛𝑖=2𝑛+1𝜎∗2𝑖(𝑛+22 :𝑛)) 𝑛 2 𝑖=1 = 1 𝑛2𝑚( 𝑛 2𝜎 ∗2 (𝑛 2:𝑛)+ 𝑛 2𝜎 ∗2 (𝑛+2 2 :𝑛)) Nevertheless, 𝜎∗2𝑛 2 < 𝜎
2 for each i, this implies
Var(𝑋̅MDRSSE) = 1 2𝑛𝑚(𝜎 ∗2𝑛 2+ 𝑛 2𝜎 ∗2𝑛+2 2 ) < 𝜎2 𝑛𝑚 = Var(𝑋̅SRS)
Therefore: Var(𝑋̅MDRSSO) < Var(𝑋̅SRS), similarly when n is odd and similarly prove (iii).
4. Simulation Study
Based on 30000 replications, a computer simulation is conduced to study the behavior of the efficiency of the sample mean using RSS, MRSS, DRSS and MDRSS with respect to SRS. The sample size n should be kept very small so that visual ranking errors will not destroy the gain in efficiency. Random observations are generated from (1) Standard normal distribution with (μ = 0, σ2 = 1) (2) Beta distribution with (α = 3, β = 3) (3) Logistic distribution with (α = − 1, β = 1)
(4) Exponential distribution with (λ = 1) (5) Gamma distribution with (α = 1, β = 1
2) (6) Weibull distribution with
(λ = 1, k = 2), were generated by the (MATHEMTICA) package. Samawi and Muttlak (1996) used 5000 replications in their paper because of that the replications were extended to be more than 5000.
The simulation results are summarized in a table and list of figures for the performance of the samples means with sample sizes n = 6, 9, 11 and one cycle (m = 1). The results of the table and these figures show the relative efficiency (the ratio of the variances) of the estimators of the mean relative to SRS.
ISSN: 2347-1921
Volume: 14 Issue: 01
Journal of Advances in Mathematics
7508
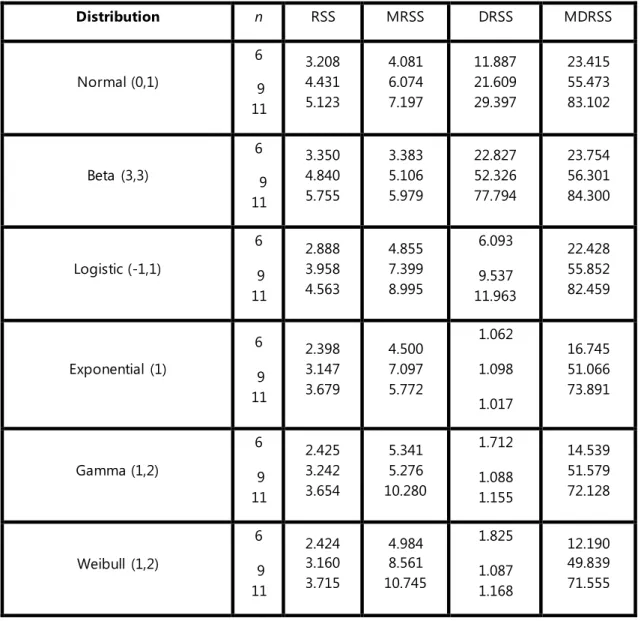
Table 1 Exact relative efficiency relative to SRS, RSS, MRSS, DRSS and MDRSS under symmetric and asymmetric distributions with different sample sizes of n.
• Table 1 shows that estimating the population mean using MDRSS is more efficient than RSS, MRSS and DRSS.
• Regarding the sample size n, the efficiency of the mean estimators using MDRSS relative to the other methods increases for almost results.
• Underlying the symmetric distributions, the population mean estimator using DRSS is more efficient than RSS and MRSS.
• Underlying the asymmetric distributions, the population mean estimator using MRSS is more efficient than DRSS and RSS.
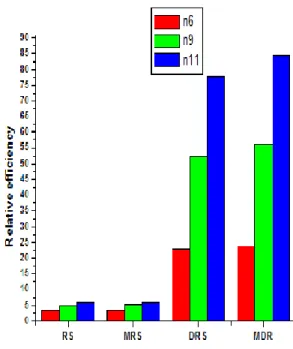
To represent more about the distributions, the simulation results are summarized by list of figures from Figure 1 to Figure 3. The figures show more about the methods with discuss the better and the worst methods in each distribution. Distribution n RSS MRSS DRSS MDRSS Normal (0,1) 6 9 11 3.208 4.431 5.123 4.081 6.074 7.197 11.887 21.609 29.397 23.415 55.473 83.102 Beta (3,3) 6 9 11 3.350 4.840 5.755 3.383 5.106 5.979 22.827 52.326 77.794 23.754 56.301 84.300 Logistic (-1,1) 6 9 11 2.888 3.958 4.563 4.855 7.399 8.995 6.093 9.537 11.963 22.428 55.852 82.459 Exponential (1) 6 9 11 2.398 3.147 3.679 4.500 7.097 5.772 1.062 1.098 1.017 16.745 51.066 73.891 Gamma (1,2) 6 9 11 2.425 3.242 3.654 5.341 5.276 10.280 1.712 1.088 1.155 14.539 51.579 72.128 Weibull (1,2) 6 9 11 2.424 3.160 3.715 4.984 8.561 10.745 1.825 1.087 1.168 12.190 49.839 71.555
ISSN: 2347-1921
Volume: 14 Issue: 01
Journal of Advances in Mathematics
7509
a) Standard Normal Distribution b) Beta Distribution
c) Logistic Distribution
Figure 1 RE for symmetric distributions.
• For symmetric distributions in this study, the results for RSS and MRSS are close more than the results from DRSS and MDRSS.
ISSN: 2347-1921
Volume: 14 Issue: 01
Journal of Advances in Mathematics
7510
• For beta distribution, the results for RSS and MRSS are look constantly for all the sample sizes.
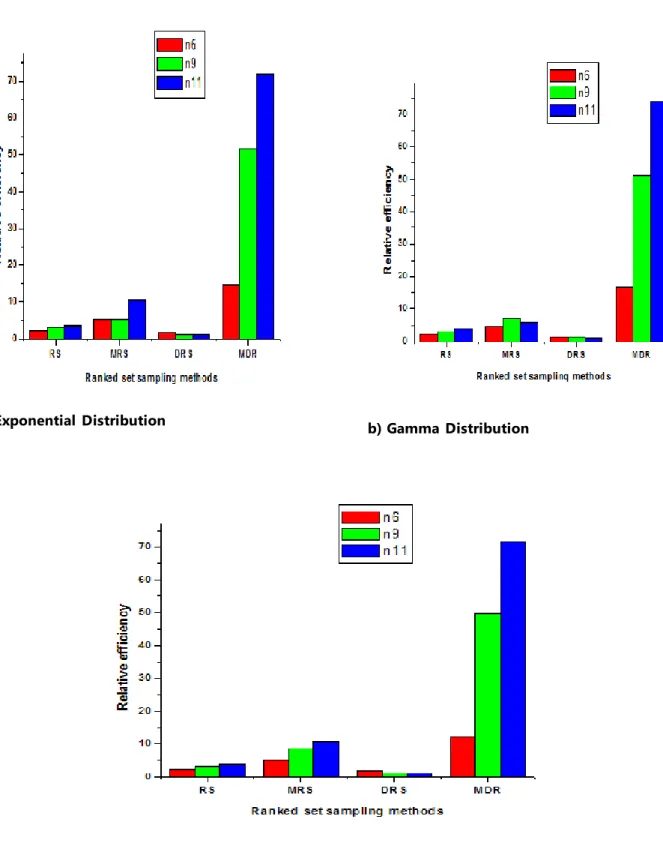
a) Exponential Distribution b) Gamma Distribution
c) Weibull Distribution
ISSN: 2347-1921
Volume: 14 Issue: 01
Journal of Advances in Mathematics
7511
• The figures a, b and c have the same behavior for all the methods. Weibull (1, k) random variable is an exponential random variable with mean k. Gamma distribution with shape parameter α =1 and scale parameter β is an exponential (β) distribution. Both the gamma and weibull distributions can be seen as generalizations of the exponential distribution.
5. Summary and Conclusions
From the simulation results given in the tables the following can be concluded:
1. The MDRSS method is asymptotically more efficient than all the methods in the study.
2. Regarding the sample size n, the efficiency of the mean estimators using the ranked set sampling methods increase when the sample size increases for almost results.
3. Underlying the symmetric distributions, the population mean estimator using DRSS is more efficient than RSS and MRSS.
4. Underlying the asymmetric distributions, the population mean estimator using MRSS is more efficient than DRSS and RSS.
References
1. Al-Saleh, M. F., and Al- Kadiri, M. A. 2000. Double ranked set sampling. Statistics and Probability Letters 48, 205 -212.
2. Balakrishnan, N., and Chen, W.W. 1997. CRC Handbook of Tables for Order Statistics from Inverse Gussian Distributions with Applications, CRC Press, Boca Raton.
3. Dell, T. R. and Clutter, J. L. 1972. Ranked set sampling theory with order statistics background. Biometrics 28, 545 -555.
4. Haq, A., Brown, J., Moltchanova, E., and Al-Omari, A. I. 2013. Partial ranked set sampling design. Environ metrics 24, 201-207.
5. Haq, A., Brown, J., Moltchanova, E., and Al-Omari, A. I. 2016. Paired double-ranked set sampling. Communications in Statistics - Theory and Methods 10, 2873-2889.
6. Harter, H. L. and Balakrishnan, N. 1996.CRC Handbook of Tables for the use of Order Statistics in Estimation. CRC Press, Boca Raton.
7. McIntyre, G. A. 1952. A method of unbiased selective sampling, using ranked sets. Australian J. Agricultural Research 3, 385-390.
8. Muttlak, H. A. 1997. Median ranked set sampling. Journal of Applied Statistical Sciences 6, 245-255. 9. Muttlak, H. A. 1998. Median ranked set sampling with concomitant variables and a comparison with
ranked set sampling and regression estimator. Environmetrics 9, 255-267.
10. Patil, G. P., Sinha, A. K., Taillie, C. 1993. Relative precision of ranked set sampling: Compariso n with the regression estimator. Environmetrics 4, 399-412.
11. Richard, S. L., Dennis, W.,and William, M. 2008. Mathematical Statistics with Applications. 7𝑡ℎed.
Thomson Higher Education. USE.
12. Samawi, H. M. 2011. Varied set size ranked set sampling with applications to mean and ratio estimation. The International Journal of Simulation Modeling 31, 6–13.
13. Samawi, H. M., and Muttlak, H. A. 1996. Estimation of Ratio Using Rank Set Sampling. Biometrical Journal 38, 753 -764.
14. Takahasi, K. and Wakimoto, K. 1968. On unbiased estimates of the population mean based on the sample stratified by means of ordering. Annals of the Institute of Statistical Mathematics 20, 1-31.