Article
Deep Neural Network for Predicting Diabetic
Retinopathy from Risk Factors
Ganjar Alfian1 , Muhammad Syafrudin2,* , Norma Latif Fitriyani2 , Muhammad Anshari3, Pavel Stasa4 , Jiri Svub4 and Jongtae Rhee2
1 Industrial Artificial Intelligence (AI) Research Center, Nano Information Technology Academy, Dongguk University, Seoul 04626, Korea; ganjar@dongguk.edu
2 Department of Industrial and Systems Engineering, Dongguk University, Seoul 04620, Korea; norma@dongguk.edu (N.L.F.); jtrhee@dongguk.edu (J.R.)
3 School of Business & Economics, Universiti Brunei Darussalam, Gadong BE1410, Brunei; anshari.ali@ubd.edu.bn
4 Department of Economics and Control Systems, Faculty of Mining and Geology,
VSB–Technical University of Ostrava, 70800 Ostrava-Poruba, Czech Republic; pavel.stasa@vsb.cz (P.S.); jiri.svub@vsb.cz (J.S.)
* Correspondence: udin@dongguk.edu
Received: 21 August 2020; Accepted: 17 September 2020; Published: 19 September 2020 Abstract:Extracting information from individual risk factors provides an effective way to identify diabetes risk and associated complications, such as retinopathy, at an early stage. Deep learning and machine learning algorithms are being utilized to extract information from individual risk factors to improve early-stage diagnosis. This study proposes a deep neural network (DNN) combined with recursive feature elimination (RFE) to provide early prediction of diabetic retinopathy (DR) based on individual risk factors. The proposed model uses RFE to remove irrelevant features and DNN to classify the diseases. A publicly available dataset was utilized to predict DR during initial stages, for the proposed and several current best-practice models. The proposed model achieved 82.033% prediction accuracy, which was a significantly better performance than the current models. Thus, important risk factors for retinopathy can be successfully extracted using RFE. In addition, to evaluate the proposed prediction model robustness and generalization, we compared it with other machine learning models and datasets (nephropathy and hypertension–diabetes). The proposed prediction model will help improve early-stage retinopathy diagnosis based on individual risk factors.
Keywords: retinopathy; risk factor; machine learning; deep neural network; recursive feature elimination; deep learning
1. Introduction
Diabetes is a chronic disease associated with abnormal blood glucose (BG) levels. Patients with type 1 diabetes (T1D) cannot control their BG naturally due to lacking insulin secretion, while for type 2 diabetes (T2D), the body cannot utilize its produced insulin [1,2]. Thus, T1D patients must administer insulin via injection or an insulin pump to achieve a near-normal glucose metabolism [3]. For T2D patients, a healthy diet, physical exercise, and drug administration are suggested to control BG levels and prevent many complications. Diabetes patients commonly develop acute complications, such as hypoglycemia (BG<70 mg/dL) and hyperglycemia (BG>180 mg/dL) if they fail to carefully self-manage BG levels [4]. Excessive BG (hyperglycemia) can result in long-term complications, e.g., retinopathy [5,6], nephropathy or kidney disease [7,8], and cardiovascular disease [9,10]. Diabetic retinopathy (DR) is the most common ocular complication from diabetes and the leading cause of visual impairment among
Mathematics2020,8, 1620 2 of 19
patients [11]. Thus, it is important to accurately predict related complications to help prevent their progression [12], and individual significant risk factors can be utilized as input features to improve prediction model performance.
Considerable research effort has recently focused on developing of retinopathy prediction models using machine learning based on individual risk factors, aiming for high accuracy and good generalization. Pre-diagnosis models have been used for different populations and have shown significant performance predicting diabetic retinopathy [13–17]. Deep neural networks (DNNs) are machine learning systems that incorporate many layers to learn more complex patterns, achieving exceptional prediction accuracy for many applications. In particular, DNNs have shown excellent performance by improving classification accuracy compared with conventional models [18–23]. DNNs have also been trained to successfully predict diabetic retinopathy based on retinal fundus images [24–29]. Furthermore, previous studies have established positive impacts from support vector machine–recursive feature elimination (SVM-RFE) as the feature selection algorithm on improving classification accuracy [30–37], especially for DNNs [38,39].
However, none of these previous studies included DNNs with RFE for retinopathy prediction based on individual risk factors. Therefore, the current study integrated DNN and SVM-RFE for retinopathy to improve prediction accuracy. We employed SVM-RFE to extract significant risk factors and DNN to subsequently generate higher accuracy prediction models. Utilizing the identified significant retinopathy predictors (risk factors) provides optimized prediction models. Thus, this study will help diabetic patients to reduce diabetic retinopathy risk, the major cause of blindness in such patients.
The remainder of this paper is organized as follows. Section2discusses related works for retinopathy prediction, including related DNN and RFE applications for healthcare. Section3details the proposed retinopathy prediction model, and Section4discusses experimental results for the proposed model. Section5
summarizes and concludes the paper, including discussing study limitations and future research directions. 2. Literature Review
This section discusses previously proposed machine learning models for retinopathy pre-diagnosis, with particular attention regarding DNN and RFE for health-related datasets.
2.1. Diabetic Retinopathy Prediction
Prediction models based on machine learning and employing individuals’ risk factors as input features helped improve retinopathy pre-diagnosis for Iran, Korea, US, and Taiwan populations. Hosseini et al. [13] used a logistic regression (LR) model to predict retinopathy for 3734 T2D patients from the Isfahan Endocrinology and Metabolism Research Center, Iran. The model achieved AUC= 0.704, sensitivity =60%, and specificity= 69%. Oh et al. [14] proposed retinopathy risk prediction based on Lasso. They used a dataset from the Korea National Health and Nutrition Examination Surveys (KNHANES) V-1, with 327 patients randomly selected as training data and 163 as validation. The proposed model achieved AUC=0.81, accuracy=73.6%, sensitivity=77.4%, and specificity=72.7%.
Retinopathy prediction has also been applied for US patients. Ogunyemi and Kermah [15] investigated machine learning models for predicting retinopathy from six health centers in South Los Angeles, comprising 513 T2D patients. The dataset was split into approximately 80% for training and the remainder for testing. They compared RUSBoost ensemble and AdaBoost model predictions and showed that RUSBoost ensemble was superior to AdaBoost, achieving accuracy=73.5%, AUC=0.72, sensitivity=69.2%, and specificity=55.9%. LR, support vector machine (SVM), and artificial neural network (ANN) models also helped improve retinopathy prediction performance for the overall US population [16] using an updated dataset comprising 27,116 T1D and T2D patients from the Los Angeles County Department of Health Services. Combining ANN and the synthetic minority oversampling technique (SMOTE) achieved superior results with AUC=0.754, sensitivity=58%, and specificity=80%. Tsao et al. [17] proposed SVM-, decision tree (DT)-, ANN-, and LR-based models
to predict DR based on several risk factors for T2D patients. The dataset was gathered from a private hospital in Northern Taiwan, incorporating 430 normal and 106 DR patients. The SVM based model was superior to the other algorithms considered, achieving accuracy=79.5% and AUC=0.839. 2.2. Deep Neural Network
Deep neural network models have been used in many previous studies to the improve prediction accuracy compared with other models. For diabetes prediction-related issues, DNNs have only been applied to predict T2D. Kim et al. [22] used phenotype and genotype data from the Nurses’ Health Study (NHS) with data from the Health Professionals Follow-up Study (HPFS) to evaluate the prediction model performance. The proposed DNN outperformed LR, with AUC=0.931 and 0.928 for male and female patients. Stacked autoencoders in DNN were also applied for T2D diabetes classification [23]. Their model was applied to a Pima Indian dataset and achieved classification accuracy=86.26%.
Diabetic retinopathy is a complication of diabetes that causes damage to the blood vessels in the retina and leading to vision impairment. Therefore, an accurate prediction model for pre-diagnosis retinopathy would be very useful to improve patient health outcomes. DNN have shown good performance diagnosing retinopathy from retinal fundus images, including datasets from Otago and Messidor [24], and three clinical departments in Sichuan Provincial People’s Hospital [25]. Parmar et al. [26] employed a convolutional neural network to detect DR from retinal images and their model outperformed others considered. Furthermore, the ResNet architecture model was utilized to detect DR from fundus images achieving an excellent classification accuracy [27,28]. Finally, Gadekallu et al. [29] employed a DNN with grey wolf optimization (GWO) and principle components analysis (PCA) to optimize the parameters and reduce dimensionality, respectively, to predict DR based on extracted features from retinal imaging. However, these studies only diagnosed retinopathy from retinal fundus images, and to our best knowledge, no previous study considered DNNs for retinopathy based on risk factors.
2.3. Recursive Feature Elimination
Many previous studies employed feature selection to improve the model prediction accuracy. Guyon et al. [30] introduced RFE to select the most significant gene(s) for cancer classification and, hence, improve classification model accuracy. The algorithm calculates a rank score and eliminates the lowest-ranking features. Previous studies showed significant performance improvements by employing RFE, including predicting mental states (brain activity) [31,32], Parkinson [33], skin disease [34], autism [35], Alzheimer [36], and T2D [37]. They showed that SVM-RFE achieved superior performance than several comparison methods. In addition, previous studies demonstrated DNN accuracy improvement by integrating RFE as the feature selection algorithm [38,39]. The experimental results showed that integration of SVM-RFE to DNN algorithms achieved best prediction accuracy as compared to other methods.
To our best knowledge, only Kumar et al. [37] considered RFE for diabetes prediction. Kumar et al. used SVM-RFE to identify the most discriminatory gene target for T2D. These identified significant genes could then be focused on as potential drug targets. However, although SVM-RFE was employed to extract significant features for T2D, this was not applied to the DR dataset. Similarly, previous DR studies used DNNs to classify disease from retinal fundus images only, and risk factors were not utilized as DNN input features. Therefore, the current study proposed SVM-RFE and DNN to improve DR prediction accuracy from individual risk factors. To our best knowledge, this is the first time SVM-RFE and DNN using individual risk factors were employed to improve DR prediction accuracy.
Mathematics2020,8, 1620 4 of 19
3. Methodology 3.1. Datasets
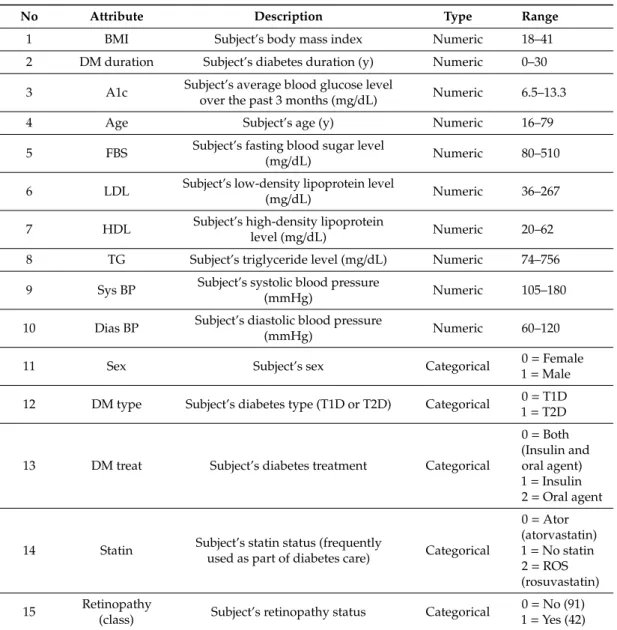
Previous studies established that T1D or T2D patients tend to develop complications, such as retinopathy, nephropathy, cardiovascular disease (CVD), etc. Therefore, we proposed a DNN-based model to predict whether T1D or T2D patients will later develop DR. The dataset was collected by Khodadadi et al. [40] and related with diabetes complications in Lur and Lak populations of Iran. Informed consent was obtained from patients, and the dataset was made publicly available by previous authors (https://data.mendeley.com/datasets/k62fdsnwkg/1). The dataset was gathered from 133 diabetic patients covering known risk factors for neuropathy, nephropathy, diabetic retinopathy (DR), peripheral vessel disease (PVD), CVD, food ulcer history, and dawn effect. Originally, the dataset consisted of 24 information gathered from diabetic patients (T1D and T2D). We removed irrelevant features, leaving 14 potentially DR-relevant risk factors, as shown in Table1. The class label (retinopathy) was assigned when the subject had symptomatic cases with a history of laser or surgical therapy. The objective of our study was to classify whether a diabetic patient will develop diabetic retinopathy (DR) in the future.
3.2. Design of Proposed Model
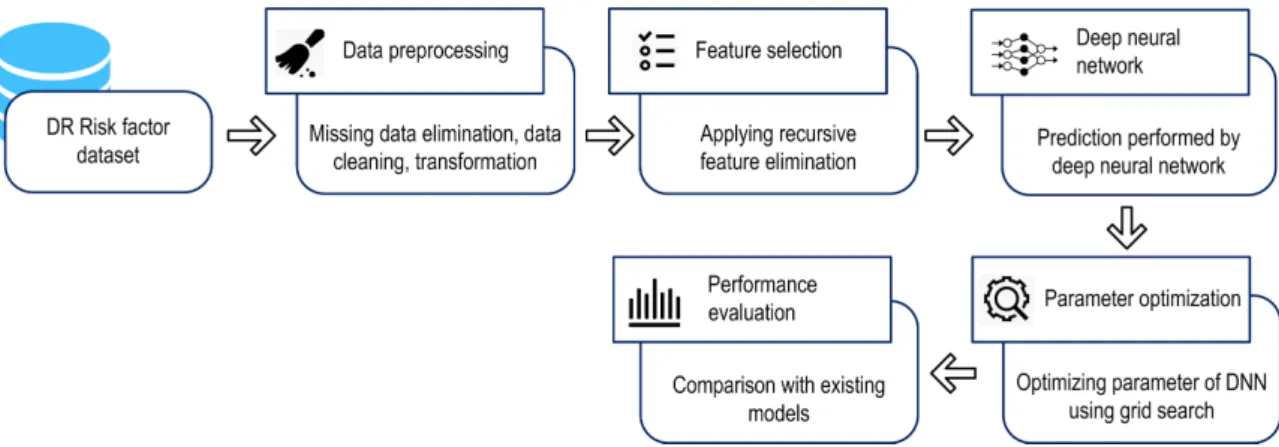
Figure1shows the proposed DNN model to predict DR diagnosis from several risk factors, based on a public DR dataset. Data pre-processing removed inappropriate and inconsistent data. During the pre-processing stage, data normalization was applied by rescaling real valued numeric attributes into [0, 1]. Missing values in the numeric and nominal attributes were replaced by mean and mode, respectively. Then RFE removed irrelevant features, and a DNN-based prediction was developed using the grid search algorithm to optimize the model hyperparameter and, hence, maximize DNN performance. Performance was evaluated by comparing the proposed and other best-practice machine learning models from previous studies.
Mathematics 2020, 8, x FOR PEER REVIEW 5 of 19
Figure 1 shows the proposed DNN model to predict DR diagnosis from several risk factors, based on a public DR dataset. Data pre-processing removed inappropriate and inconsistent data. During the pre-processing stage, data normalization was applied by rescaling real valued numeric attributes into [0, 1]. Missing values in the numeric and nominal attributes were replaced by mean and mode, respectively. Then RFE removed irrelevant features, and a DNN-based prediction was developed using the grid search algorithm to optimize the model hyperparameter and, hence, maximize DNN performance. Performance was evaluated by comparing the proposed and other best-practice machine learning models from previous studies.
Figure 1. Proposed deep neural network model for diabetic retinopathy (DR) prediction.
We used stratified 10-fold cross-validation (CV), a variation of k-fold CV for the proposed and comparison machine learning models. In k-fold CV, the dataset is split into k subsets of equal size and the instances for each subset or fold are randomly selected. Each subset, in turn, is used for testing and the remainder for the training set. The model is evaluated k times such that each subset is used once as the test set. However, in stratified k-fold cross-validation, each subset is stratified so that they contain approximately the same proportion of class labels as the original dataset. By this procedure, the variance among the estimates are reduced and the average error estimate is reliable. Furthermore, our dataset is imbalanced, with 32% of subjects classified as DR patients. A previous study demonstrated that stratified k-fold CV is generally considered superior to regular CV, particularly for unbalanced datasets [41]. Figure 2 shows the overview of the model validation based on CV and stratified CV applied to the two-class dataset.
(a)
Figure 1.Proposed deep neural network model for diabetic retinopathy (DR) prediction.
We used stratified 10-fold cross-validation (CV), a variation of k-fold CV for the proposed and comparison machine learning models. In k-fold CV, the dataset is split into k subsets of equal size and the instances for each subset or fold are randomly selected. Each subset, in turn, is used for testing and the remainder for the training set. The model is evaluated k times such that each subset is used once as the test set. However, in stratified k-fold cross-validation, each subset is stratified so that they contain approximately the same proportion of class labels as the original dataset. By this procedure, the variance among the estimates are reduced and the average error estimate is reliable. Furthermore, our dataset is imbalanced, with 32% of subjects classified as DR patients. A previous study demonstrated that stratified k-fold CV is generally considered superior to regular CV, particularly
for unbalanced datasets [41]. Figure2shows the overview of the model validation based on CV and stratified CV applied to the two-class dataset.
Table 1.Diabetic retinopathy dataset.
No Attribute Description Type Range
1 BMI Subject’s body mass index Numeric 18–41
2 DM duration Subject’s diabetes duration (y) Numeric 0–30 3 A1c Subject’s average blood glucose level
over the past 3 months (mg/dL) Numeric 6.5–13.3
4 Age Subject’s age (y) Numeric 16–79
5 FBS Subject’s fasting blood sugar level
(mg/dL) Numeric 80–510
6 LDL Subject’s low-density lipoprotein level
(mg/dL) Numeric 36–267
7 HDL Subject’s high-density lipoprotein
level (mg/dL) Numeric 20–62
8 TG Subject’s triglyceride level (mg/dL) Numeric 74–756 9 Sys BP Subject’s systolic blood pressure
(mmHg) Numeric 105–180
10 Dias BP Subject’s diastolic blood pressure
(mmHg) Numeric 60–120
11 Sex Subject’s sex Categorical 0=Female
1=Male 12 DM type Subject’s diabetes type (T1D or T2D) Categorical 0=T1D
1=T2D
13 DM treat Subject’s diabetes treatment Categorical
0=Both (Insulin and oral agent) 1=Insulin 2=Oral agent
14 Statin Subject’s statin status (frequentlyused as part of diabetes care) Categorical
0=Ator (atorvastatin) 1=No statin 2=ROS (rosuvastatin) 15 Retinopathy
(class) Subject’s retinopathy status Categorical
0=No (91) 1=Yes (42) 3.3. Recursive Feature Elimination (RFE)
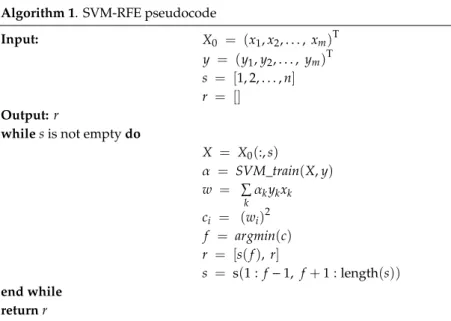
Feature selection removes redundant and irrelevant features to improve machine learning quality and efficiency. This study applied RFE with SVM kernels, i.e., linear function, to evaluate feature significances for DR dataset [30]. SVM-RFE works first by training the dataset with the SVM classifier. Next, the ranking weights for all features are computed. Finally, the feature with smallest weight is deleted. This process is repeated until no features are left, with later eliminated features having higher ranks. The bottom ranked ones are the least informative and removed in the first iteration. Thus, irrelevant features are gradually eliminated and important features retained for classification. The process is summarized in Algorithm 1.
Mathematics2020,8, 1620 6 of 19
Mathematics 2020, 8, x FOR PEER REVIEW 5 of 19
Figure 1 shows the proposed DNN model to predict DR diagnosis from several risk factors, based on a public DR dataset. Data pre-processing removed inappropriate and inconsistent data. During the pre-processing stage, data normalization was applied by rescaling real valued numeric attributes into [0, 1]. Missing values in the numeric and nominal attributes were replaced by mean and mode, respectively. Then RFE removed irrelevant features, and a DNN-based prediction was developed using the grid search algorithm to optimize the model hyperparameter and, hence, maximize DNN performance. Performance was evaluated by comparing the proposed and other best-practice machine learning models from previous studies.
Figure 1. Proposed deep neural network model for diabetic retinopathy (DR) prediction.
We used stratified 10-fold cross-validation (CV), a variation of k-fold CV for the proposed and comparison machine learning models. In k-fold CV, the dataset is split into k subsets of equal size and the instances for each subset or fold are randomly selected. Each subset, in turn, is used for testing and the remainder for the training set. The model is evaluated k times such that each subset is used once as the test set. However, in stratified k-fold cross-validation, each subset is stratified so that they contain approximately the same proportion of class labels as the original dataset. By this procedure, the variance among the estimates are reduced and the average error estimate is reliable. Furthermore, our dataset is imbalanced, with 32% of subjects classified as DR patients. A previous study demonstrated that stratified k-fold CV is generally considered superior to regular CV, particularly for unbalanced datasets [41]. Figure 2 shows the overview of the model validation based on CV and stratified CV applied to the two-class dataset.
(a)
Mathematics 2020, 8, x FOR PEER REVIEW 6 of 19
(b)
Figure 2. Model validation (a) 10-fold cross-validation (CV) and (b) stratified 10-fold CV.
3.3. Recursive Feature Elimination (RFE)
Feature selection removes redundant and irrelevant features to improve machine learning quality and efficiency. This study applied RFE with SVM kernels, i.e., linear function, to evaluate feature significances for DR dataset [30]. SVM-RFE works first by training the dataset with the SVM classifier. Next, the ranking weights for all features are computed. Finally, the feature with smallest weight is deleted. This process is repeated until no features are left, with later eliminated features having higher ranks. The bottom ranked ones are the least informative and removed in the first iteration. Thus, irrelevant features are gradually eliminated and important features retained for classification. The process is summarized in Algorithm 1.
Algorithm 1. SVM-RFE pseudocode Input: 𝑋 = (𝑥 , 𝑥 , … , 𝑥 )
𝑦 = (𝑦 , 𝑦 , … , 𝑦 ) 𝑠 = [1,2, … , 𝑛] 𝑟 = []
Output: r
whiles is not empty do
𝑋 = 𝑋 (: , 𝑠) 𝛼 = 𝑆𝑉𝑀_𝑡𝑟𝑎𝑖𝑛(𝑋, 𝑦) 𝑤 = 𝛼 𝑦 𝑥 𝑐 = (𝑤 ) 𝑓 = 𝑎𝑟𝑔𝑚𝑖𝑛(𝑐) 𝑟 = [𝑠(𝑓), 𝑟] 𝑠 = s(1: 𝑓 − 1, 𝑓 + 1: length(𝑠)) end while returnr
The SVM-RFE algorithm can be divided into three steps, which are input, calculation of the weight of each feature, and removing the lowest ranked feature. In Algorithm 1, during the input stage, 𝑋 is defined as the training sample, 𝑦 is class labels, 𝑠 is subset of remaining features, and 𝑟 is feature sorted list. In the next process, the weight calculation of each feature is conducted where the algorithm repeats the process until the list of 𝑠 is empty. The new training sample 𝑋 is defined according to the remaining features 𝑠. The set of paired inputs and outputs is used by training the classifier 𝛼. The calculation of the weight vector 𝑤 and ranking criteria 𝑐 is conducted at this stage.
Figure 2.Model validation (a) 10-fold cross-validation (CV) and (b) stratified 10-fold CV.
Algorithm 1. SVM-RFE pseudocode
Input: X0 = (x1,x2,. . ., xm)T y = (y1,y2,. . ., ym)T s = [1, 2,. . .,n]
r = []
Output:r
whilesis not emptydo
X = X0(:,s) α = SVM_train(X,y) w = P k αkykxk ci = (wi)2 f = argmin(c) r = [s(f), r] s = s(1 : f−1, f+1 : length(s)) end while returnr
The SVM-RFE algorithm can be divided into three steps, which are input, calculation of the weight of each feature, and removing the lowest ranked feature. In Algorithm 1, during the input stage,X0is
defined as the training sample,yis class labels,sis subset of remaining features, andris feature sorted list. In the next process, the weight calculation of each feature is conducted where the algorithm repeats the process until the list ofsis empty. The new training sampleXis defined according to the remaining featuress. The set of paired inputs and outputs is used by training the classifierα. The calculation of the weight vectorwand ranking criteriaciis conducted at this stage. When the lowest ranking feature f was obtained, the feature sorted listrcan be updated. At the last stage, the feature with the smallest ranking criterion is removed andsis updated. The users can stop the iteration when the list ofsis not empty, so that desired number of features can be obtained.
In Algorithm 1,SVM_train(linear SVM) is utilized to learn from the set of paired inputsXand outputsy. The linear SVM classifies training data by mapping the original data onto a high dimensional feature space and finding the linear optimal hyperplane to separate instances of each class from the others [42]; for the case of separating training vectors belonging to two linearly separable classes:
(xi,yi), xi∈ Rn, yi ∈ {+1,−1}, i = 1,. . .,n (1)
wherexiis a real valuedn-dimensional input vector andyiis the class label associated with the training vector. The separating hyperplane is determined by an orthogonal vectorwand biasb, which identify points that satisfy
w.x+ b = 0 (2)
Thus, the classification mechanism for linear SVM can be expressed as maxα Xn i=1αi − 1 2 Xn i,j=1αiαjyiyj xi.xj (3) with constraints Xn i=1αiyj = 0, 0≤αi≤C, i = 1, 2,. . ..,n (4)
whereαis the parameter vector for the classifier hyperplane, andCis a penalty parameter to control the number of misclassifications.
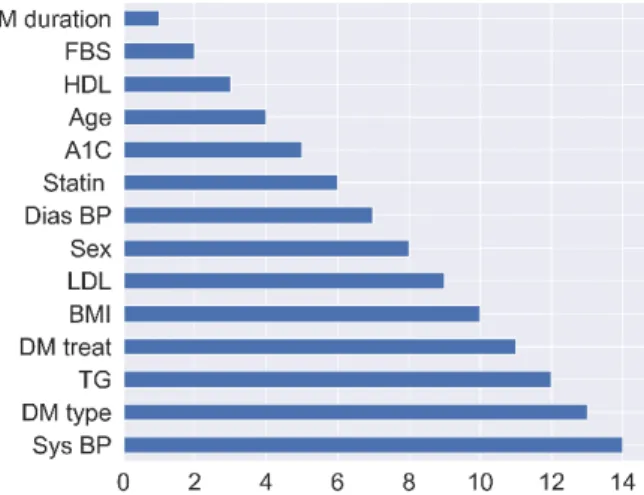
Figure3shows the attribute ranking for the DR dataset. We investigated the impact of the topk features for DNN accuracy. The SVM-RFE was executed to remove irrelevant features, and important features (k) are utilized as the input for the DNN. This process is repeated for all possiblekfeatures. Finally, we found that the first (top) 13 DR features is the optimal number of features that can maximize DNN accuracy. Hence only systolic blood pressure (Sys BP) was removed from the DR dataset. Section4.2discusses optimizing the number of features for the dataset.
Mathematics 2020, 8, x FOR PEER REVIEW 7 of 19
When the lowest ranking feature 𝑓 was obtained, the feature sorted list 𝑟 can be updated. At the last stage, the feature with the smallest ranking criterion is removed and 𝑠 is updated. The users can stop the iteration when the list of s is not empty, so that desired number of features can be obtained. In Algorithm 1, SVM_train (linear SVM) is utilized to learn from the set of paired inputs 𝑋 and outputs 𝑦. The linear SVM classifies training data by mapping the original data onto a high dimensional feature space and finding the linear optimal hyperplane to separate instances of each class from the others [42]; for the case of separating training vectors belonging to two linearly separable classes:
(𝐱 , 𝑦 ), 𝐱 ∈ 𝑅 , 𝑦 ∈ {+1, −1}, 𝑖 = 1, … , 𝑛 (1) where 𝐱 is a real valued n-dimensional input vector and 𝑦 is the class label associated with the training vector. The separating hyperplane is determined by an orthogonal vector 𝐰 and bias b, which identify points that satisfy
𝐰. 𝐱 + 𝑏 = 0 (2)
Thus, the classification mechanism for linear SVM can be expressed as
𝑚𝑎𝑥 ∑ 𝛼 − ∑, 𝛼 𝛼 𝑦 𝑦 (𝐱 . 𝐱 ) (3)
with constraints
∑ 𝛼 𝑦 = 0, 0 ≤ α ≤ 𝐶, 𝑖 = 1,2, … . , 𝑛 (4) where 𝛼 is the parameter vector for the classifier hyperplane, and C is a penalty parameter to control the number of misclassifications.
Figure 3 shows the attribute ranking for the DR dataset. We investigated the impact of the top k
features for DNN accuracy. The SVM-RFE was executed to remove irrelevant features, and important features (k)are utilized as the input for the DNN. This process is repeated for all possible k features. Finally, we found that the first (top) 13 DR features is the optimal number of features that can maximize DNN accuracy. Hence only systolic blood pressure (Sys BP) was removed from the DR dataset. Section 4.2 discusses optimizing the number of features for the dataset.
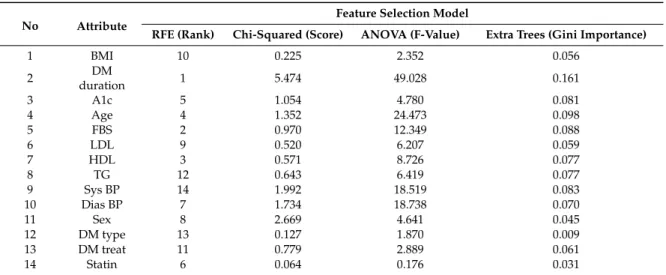
We also compared the performance of SVM-RFE with other feature selection methods on improving DNN accuracy, such as chi-squared, ANOVA, and extra trees. The result of feature selection execution for the dataset as shown in Table 2. The feature selection methods showed different results in terms of extracting the most important features. A higher value of score, f-value, and gini importance indicate the importance of the features. The impact of a different feature selection on DNN accuracy is presented in Section 4.2.
Figure 3. Attribute ranking for diabetes retinopathy (DR) datasets. Table 2. Feature selection results for the diabetes retinopathy (DR) dataset.
Mathematics2020,8, 1620 8 of 19
We also compared the performance of SVM-RFE with other feature selection methods on improving DNN accuracy, such as chi-squared, ANOVA, and extra trees. The result of feature selection execution for the dataset as shown in Table2. The feature selection methods showed different results in terms of extracting the most important features. A higher value of score, f-value, and gini importance indicate the importance of the features. The impact of a different feature selection on DNN accuracy is presented in Section4.2.
Table 2.Feature selection results for the diabetes retinopathy (DR) dataset.
No Attribute
Feature Selection Model
RFE (Rank) Chi-Squared (Score) ANOVA (F-Value) Extra Trees (Gini Importance)
1 BMI 10 0.225 2.352 0.056 2 DM duration 1 5.474 49.028 0.161 3 A1c 5 1.054 4.780 0.081 4 Age 4 1.352 24.473 0.098 5 FBS 2 0.970 12.349 0.088 6 LDL 9 0.520 6.207 0.059 7 HDL 3 0.571 8.726 0.077 8 TG 12 0.643 6.419 0.077 9 Sys BP 14 1.992 18.519 0.083 10 Dias BP 7 1.734 18.738 0.070 11 Sex 8 2.669 4.641 0.045 12 DM type 13 0.127 1.870 0.009 13 DM treat 11 0.779 2.889 0.061 14 Statin 6 0.064 0.176 0.031
The proposed SVM-RFE generated the top five features, i.e., DM duration, FBS, HDL, Age, and A1c as significant risk factors for retinopathy. Other feature selection methods, such as chi-squared, ANOVA, and extra trees, generated a different subset of important features. In chi-squared, the attributes DM duration, Sex, Sys BP, Dias BP, and Age were identified as the top five features. Furthermore, the attributes DM duration, Age, Dias BP, Sys BP, and FBS were identified as the top five features in ANOVA, while in extra trees, the result is similar to ANOVA except that A1C was included in the top five features instead of the attribute Dias BP. These top five features generated by the feature selection methods can be utilized as the input features for the deep neural network to improve classification accuracy.
Finally, the SVM-RFE identified the attribute Sys BP as an irrelevant feature, while the attribute Statin was recognized by chi-squared and ANOVA as a less important feature. The attribute DM type was discovered by extra trees as an unimportant feature; therefore, these irrelevant features generated by feature selection must be removed as input for the classifier. Excluding these irrelevant features is expected to improve DNN performance. A more detailed discussion regarding our significant risk factors for retinopathy and a comparison with the results from previous studies are presented in Section4.3.
3.4. Proposed Deep Neural Network
We employed a DNN model to predict DR from the risk factors dataset. A DNN is an ANN class with multiple hidden layers between input and output layers and has recently become highly successful for classification. A DNN is fully connected; hence, each unit receives connections from all units in the previous layer. Thus, each unit has its own bias and a weight for every pair of units in two consecutive layers. The net input was calculated by multiplying each input with its corresponding
weight and then summing. Each unit in the hidden layer took the net input and applied an activation function. Thus, network computation with three hidden layers can be expressed as
h(i1) = ϕ(1) X j w(i j1)xj+ bi(1) (5) h(i2) = ϕ(2) X j w(i j2)h(j1)+ b(i2) (6) h(i3) = ϕ(3) X j w(i j3)h(j2)+ b(i3) (7) and yi = ϕ(4) X j wi j(4)h(j3)+ b(i4) (8)
wherexjis the input units,wis weight,bis bias,yis output units,h(il)is units in thelth hidden layer, andϕis the activation function. In our study, we used and evaluated several activation functions, such as sigmoid, hyperbolic tangent, and rectified linear unit (ReLU), which are presented in detail in Equations (9)–(11), respectively. ϕ(v) = 1 1+e−v (9) ϕ(v) = e 2v − 1 e2v + 1 (10) ϕ(v) = max{v, 0} (11)
The DNNs were trained using the back propagation (BP) algorithm [43], which compares the prediction result with the target value and modifies each training tuple’s weights to minimize error between prediction and target values. In measuring a good prediction model to predict the expected outcome, a loss function is required. Our study focused on binary classification, where the number of classes is two. The cross-entropy loss function can be calculated as
Loss = −X i y0i log(yi) + 1−y0 i log(1−yi) (12) wherey0
iis true probability andyiis predicted probability value. This process was iterated to produce optimal weights, providing optimal predictions for the test data. Figure4shows the proposed DNN model to predict DR from individuals’ risk factors.
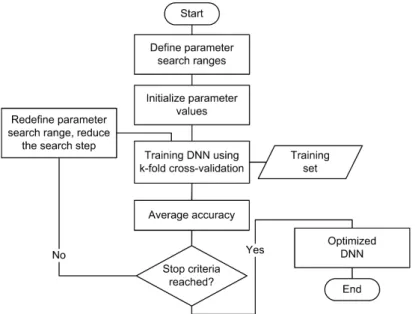
We utilized the grid search algorithm [44] to automatically select the best parameters for the proposed deep neural network (DNN) model. We then applied a grid search for the training set and measured cross-validation to obtain the best prediction model, as shown in Figure5. The objective for this method was to select the best hyperparameter for the proposed DNN model to achieve the highest accuracy for DR. We found a five-hidden-layers network with different neurons each, ReLU as activation function, and SGD as weight optimization were the best parameters for the DNN. Table3
shows optimized hyperparameter details for the proposed DNN for DR. Finally, we applied these parameters to the proposed DNN model.
Mathematics2020,8, 1620 10 of 19
Mathematics 2020, 8, x FOR PEER REVIEW 9 of 19
𝑦 = 𝜑( ) ∑ 𝑤( )
ℎ( )+ 𝑏( ) (8)
where 𝑥 is the input units, w is weight, b is bias, y is output units, ℎ( ) is units in the lth hidden layer, and 𝜑 is the activation function. In our study, we used and evaluated several activation functions, such as sigmoid, hyperbolic tangent, and rectified linear unit (ReLU), which are presented in detail in Equations (9)–(11), respectively.
𝜑(𝑣) = (9)
𝜑(𝑣) = (10)
𝜑(𝑣) = 𝑚𝑎𝑥{𝑣, 0} (11)
The DNNs were trained using the back propagation (BP) algorithm [43], which compares the prediction result with the target value and modifies each training tuple’s weights to minimize error between prediction and target values. In measuring a good prediction model to predict the expected outcome, a loss function is required. Our study focused on binary classification, where the number of classes is two. The cross-entropy loss function can be calculated as
Loss = ‒ (𝑦 𝑙𝑜𝑔(𝑦 ) + (1‒ 𝑦 ) 𝑙𝑜𝑔(1‒ 𝑦 )) (12)
where 𝑦 is true probability and 𝑦 is predicted probability value. This process was iterated to produce optimal weights, providing optimal predictions for the test data. Figure 4 shows the proposed DNN model to predict DR from individuals’ risk factors.
We utilized the grid search algorithm [44] to automatically select the best parameters for the proposed deep neural network (DNN) model. We then applied a grid search for the training set and measured cross-validation to obtain the best prediction model, as shown in Figure 5. The objective for this method was to select the best hyperparameter for the proposed DNN model to achieve the highest accuracy for DR. We found a five-hidden-layers network with different neurons each, ReLU as activation function, and SGD as weight optimization were the best parameters for the DNN. Table 3 shows optimized hyperparameter details for the proposed DNN for DR. Finally, we applied these parameters to the proposed DNN model.
Figure 4. Proposed deep neural network (DNN) for diabetes retinopathy (DR) prediction. Figure 4.Proposed deep neural network (DNN) for diabetes retinopathy (DR) prediction.
Mathematics 2020, 8, x FOR PEER REVIEW 10 of 19
Figure 5. Grid search algorithm for deep neural network (DNN) hyper-parameter optimization. Table 3. Optimized hyperparameter using grid search.
Hyperparameter Optimized Value Hidden layer size 100, 64, 128, 64, 32 Activation function ReLU
Alpha 0.0001 Initial learning rate 0.01
Maximum iteration 500 Optimization algorithm SGD
Notes: ReLU = rectified linear unit, SGD = stochastic gradient descent.
3.5. Experimental Setup
Machine-learning models were applied to distinguish DR from the public dataset. Classification and feature selection methods were implemented in Python V3.7.3, utilizing the Scikit-learn V0.22.2 library [45]. We used Scikit-learn default parameters to simplify implementing other models. We performed the experiments on an Intel Core i5-4590 computer with 8 GB RAM running Windows 7 64 bit. Average performance metrics, such as accuracy (%), precision (%), sensitivity or recall (%), specificity (%), F1 score (%), and AUC were obtained by conducting 10 runs of stratified 10-fold CV. 4. Results and Discussion
This section considers the proposed DNN model performance and feature selection model impacts and discusses DR risk factors. We also verified a good generalization capability by applying our results to other public datasets (nephropathy and hypertension–diabetes).
4.1. Prediction Model Performances
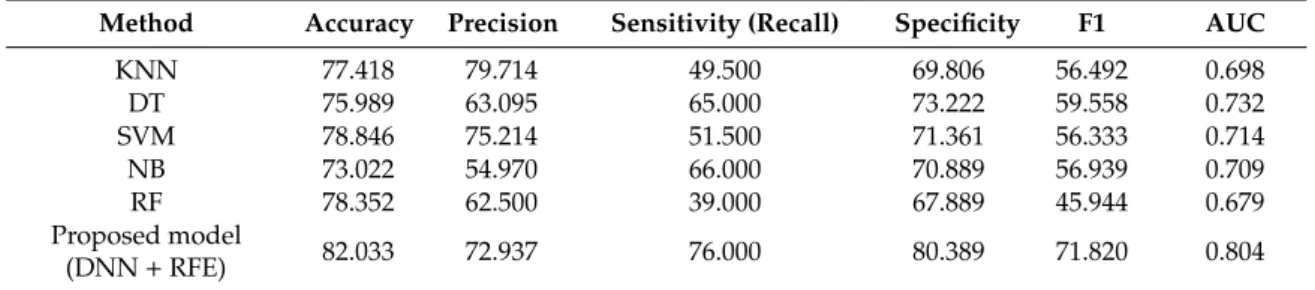
We applied the proposed DNN with RFE model to predict DR using known risk factors and compared the outcomes with several current best-practice data-driven models that have wide acceptance and a proven track record for accuracy and efficiency: k-nearest neighbor (KNN), C4.5 decision tree (DT), support vector machine (SVM), naïve Bayes (NB), and random forest (RF). Table 4 compares model performance metrics, averaged from 10 runs of stratified 10-fold CV. The proposed DNN with RFE model was superior to the traditional models with respect to accuracy, sensitivity, specificity, F1 score, and AUC, achieving 82.033%, 76.000%, 80.389%, 71.820%, and 0.804, respectively. In terms of detecting the positive cases, the KNN model achieved the highest precision (79.714%); however, our proposed model generated the highest recall (76.000%). The precision is the ratio of
Figure 5.Grid search algorithm for deep neural network (DNN) hyper-parameter optimization. Table 3.Optimized hyperparameter using grid search.
Hyperparameter Optimized Value
Hidden layer size 100, 64, 128, 64, 32
Activation function ReLU
Alpha 0.0001
Initial learning rate 0.01
Maximum iteration 500
Optimization algorithm SGD
Notes: ReLU=rectified linear unit, SGD=stochastic gradient descent.
3.5. Experimental Setup
Machine-learning models were applied to distinguish DR from the public dataset. Classification and feature selection methods were implemented in Python V3.7.3, utilizing the Scikit-learn V0.22.2 library [45]. We used Scikit-learn default parameters to simplify implementing other models. We performed the experiments on an Intel Core i5-4590 computer with 8 GB RAM running Windows
7 64 bit. Average performance metrics, such as accuracy (%), precision (%), sensitivity or recall (%), specificity (%), F1 score (%), and AUC were obtained by conducting 10 runs of stratified 10-fold CV. 4. Results and Discussion
This section considers the proposed DNN model performance and feature selection model impacts and discusses DR risk factors. We also verified a good generalization capability by applying our results to other public datasets (nephropathy and hypertension–diabetes).
4.1. Prediction Model Performances
We applied the proposed DNN with RFE model to predict DR using known risk factors and compared the outcomes with several current best-practice data-driven models that have wide acceptance and a proven track record for accuracy and efficiency: k-nearest neighbor (KNN), C4.5 decision tree (DT), support vector machine (SVM), naïve Bayes (NB), and random forest (RF). Table4compares model performance metrics, averaged from 10 runs of stratified 10-fold CV. The proposed DNN with RFE model was superior to the traditional models with respect to accuracy, sensitivity, specificity, F1 score, and AUC, achieving 82.033%, 76.000%, 80.389%, 71.820%, and 0.804, respectively. In terms of detecting the positive cases, the KNN model achieved the highest precision (79.714%); however, our proposed model generated the highest recall (76.000%). The precision is the ratio of correctly predicted positive cases to the total predicted positive cases. On other hand, the recall indicates the accuracy of a model in predicting the positive cases for the cases where the actual condition is positive. Therefore, to identify prediction of positive cases (retinopathy) accurately, the model should focus more on recall rather than precision. In the medical area, it is common to focus more on sensitivity (recall) and specificity to evaluate medical tests [46]. Furthermore, it is also important to detect positive cases accurately, since when the model fails to detect the retinopathy, it will lead to blindness in such patients. Finally, the proposed model achieved 5.308% accuracy improvement compared with the current best-practice DR models.
Table 4.Performance metrics for diabetes retinopathy prediction.
Method Accuracy Precision Sensitivity (Recall) Specificity F1 AUC
KNN 77.418 79.714 49.500 69.806 56.492 0.698 DT 75.989 63.095 65.000 73.222 59.558 0.732 SVM 78.846 75.214 51.500 71.361 56.333 0.714 NB 73.022 54.970 66.000 70.889 56.939 0.709 RF 78.352 62.500 39.000 67.889 45.944 0.679 Proposed model (DNN+RFE) 82.033 72.937 76.000 80.389 71.820 0.804
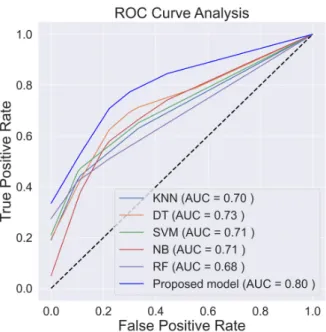
Accuracy rate is the most common metric for classifier performance. However, class distribution must be considered for unbalanced datasets using specific classifier metrics. ROC is a useful tool to provide evaluation criteria for unbalanced datasets [47]. The ROC curve contrasts false positive and false negative outcomes, as shown in Figure6, where AUC indicates overall classification performance [48], with the best model having AUC≈1. Figure6shows ROC curves analysis for the proposed and other considered classification models for DR dataset. The proposed model achieved the highest AUC=0.80.
Mathematics2020,8, 1620 12 of 19
Mathematics 2020, 8, x FOR PEER REVIEW 11 of 19
correctly predicted positive cases to the total predicted positive cases. On other hand, the recall indicates the accuracy of a model in predicting the positive cases for the cases where the actual condition is positive. Therefore, to identify prediction of positive cases (retinopathy) accurately, the model should focus more on recall rather than precision. In the medical area, it is common to focus more on sensitivity (recall) and specificity to evaluate medical tests [46]. Furthermore, it is also important to detect positive cases accurately, since when the model fails to detect the retinopathy, it will lead to blindness in such patients. Finally, the proposed model achieved 5.308% accuracy improvement compared with the current best-practice DR models.
Table 4. Performance metrics for diabetes retinopathy prediction.
Method Accuracy Precision Sensitivity (Recall) Specificity F1 AUC
KNN 77.418 79.714 49.500 69.806 56.492 0.698
DT 75.989 63.095 65.000 73.222 59.558 0.732
SVM 78.846 75.214 51.500 71.361 56.333 0.714
NB 73.022 54.970 66.000 70.889 56.939 0.709
RF 78.352 62.500 39.000 67.889 45.944 0.679
Proposed model (DNN + RFE) 82.033 72.937 76.000 80.389 71.820 0.804 Accuracy rate is the most common metric for classifier performance. However, class distribution must be considered for unbalanced datasets using specific classifier metrics. ROC is a useful tool to provide evaluation criteria for unbalanced datasets [47]. The ROC curve contrasts false positive and false negative outcomes, as shown in Figure 6, where AUC indicates overall classification performance [48], with the best model having AUC ≈ 1. Figure 6 shows ROC curves analysis for the proposed and other considered classification models for DR dataset. The proposed model achieved the highest AUC = 0.80.
Figure 6. ROC curves for the diabetes retinopathy (DR) dataset.
Thus, the proposed model achieved significantly improved metrics compared with current best practice classification methods. Specific impacts for RFE and other feature selection methods on performance accuracy are presented in Section 4.2.
4.2. Feature Selection Impacts
The optimal number of features is required to implement RFE. Therefore, we investigated the impact of top k features on DNN accuracy. The full dataset included 14 features, and RFE expected
Figure 6.ROC curves for the diabetes retinopathy (DR) dataset.
Thus, the proposed model achieved significantly improved metrics compared with current best practice classification methods. Specific impacts for RFE and other feature selection methods on performance accuracy are presented in Section4.2.
4.2. Feature Selection Impacts
The optimal number of features is required to implement RFE. Therefore, we investigated the impact of topkfeatures on DNN accuracy. The full dataset included 14 features, and RFE expected to remove irrelevant features. Figure7a shows the impact of the bestkfeatures as defined by RFE on DNN model accuracy. Optimal,k=13 for DR dataset, and maximum DNN model accuracy are achieved when including only these defined optimal features. The result showed that removing high number of features leads to the reduction of accuracy; therefore, the highest accuracy can be achieved by removing a small number of features.
Mathematics 2020, 8, x FOR PEER REVIEW 12 of 19
to remove irrelevant features. Figure 7a shows the impact of the best k features as defined by RFE on DNN model accuracy. Optimal, k = 13 for DR dataset, and maximum DNN model accuracy are achieved when including only these defined optimal features. The result showed that removing high number of features leads to the reduction of accuracy; therefore, the highest accuracy can be achieved by removing a small number of features.
Based on the strategy of searching, the feature selection can be categorized into three methods, such as wrapper, filter, and embedded methods [49,50]. Filter methods measure the relevance of features by their correlation with the target variable, while wrapper methods utilize a learning machine to measure the usefulness of a subset of features according to their predictive power. Embedded methods perform feature selection in the process of training based on specific learning machines. In our study, we used SVM-RFE as an application of wrapper methods, while for filter methods, ANOVA and chi-squared were utilized. For embedded methods, we utilized the extra trees algorithm to extract relevant features [51]. Figure 7b shows the impact of the feature selection method on DNN model accuracy. The feature selection based on extra trees automatically selected the optimal number of features = 7. We also investigated and found that the optimal number of features for ANOVA and chi-squared are same (13 features). RFE generated superior accuracy, up to 9.07% for DR dataset compared to outcomes without feature selection. However, the other considered feature selection methods performed poorly, with only slight accuracy improvements for the DR dataset using chi-squared, ANOVA, and extra trees. Thus, RFE was the best choice for the DNN, providing the maximum DR prediction accuracy.
(a) (b)
Figure 7. Proposed DNN model accuracy (a) with respect to number of top k features defined from recursive feature elimination (RFE) and (b) other feature selection models for the diabetes retinopathy (DR) dataset.
4.3. Risk Factors and Previous Studies
Table 5 compares the proposed and previous models for DR. Previous prediction models with different input variables were applied to various populations, including Iran, South Korea, US, and Taiwan. To our best knowledge, no previous study considered DNN with RFE for DR prediction. The proposed DNN and RFE model achieved superior performance compared with all previous models in terms of model accuracy. However, SVM [17] and Lasso [14] achieved superior AUC for DR. Most of the previous studies used holdout for model validation, whereas we used stratified 10-fold CV to avoid overfitting.
Risk factors and their relative importance vary across the world and the previous studies showed that important predictors could be retrieved for DR. Hosseini et al. [13] used age, BMI, sex, diabetes duration, and HbA1c; whereas Oh et al. [14] identified fasting BG, triglyceride, low BMI, and insulin therapy as strong predictors. Other studies also identified insulin use [17] and A1C [16]
Figure 7.Proposed DNN model accuracy (a) with respect to number of topkfeatures defined from recursive feature elimination (RFE) and (b) other feature selection models for the diabetes retinopathy (DR) dataset.
Based on the strategy of searching, the feature selection can be categorized into three methods, such as wrapper, filter, and embedded methods [49,50]. Filter methods measure the relevance of features by their correlation with the target variable, while wrapper methods utilize a learning machine to measure the usefulness of a subset of features according to their predictive power. Embedded methods perform feature selection in the process of training based on specific learning machines. In our study, we used SVM-RFE as an application of wrapper methods, while for filter methods, ANOVA and chi-squared were utilized. For embedded methods, we utilized the extra trees algorithm to extract relevant features [51]. Figure7b shows the impact of the feature selection method on DNN model accuracy. The feature selection based on extra trees automatically selected the optimal number of features=7. We also investigated and found that the optimal number of features for ANOVA and chi-squared are same (13 features). RFE generated superior accuracy, up to 9.07% for DR dataset compared to outcomes without feature selection. However, the other considered feature selection methods performed poorly, with only slight accuracy improvements for the DR dataset using chi-squared, ANOVA, and extra trees. Thus, RFE was the best choice for the DNN, providing the maximum DR prediction accuracy.
4.3. Risk Factors and Previous Studies
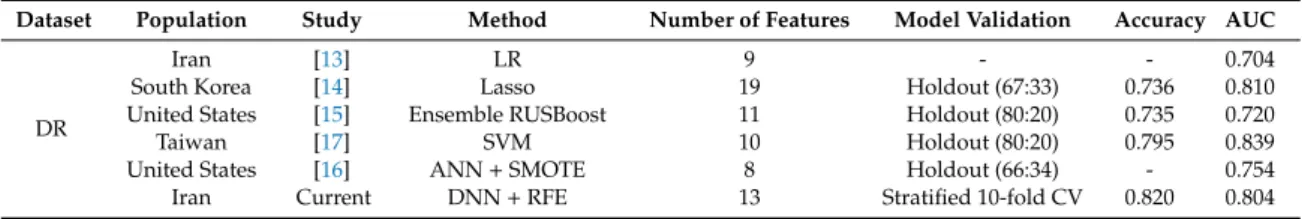
Table5compares the proposed and previous models for DR. Previous prediction models with different input variables were applied to various populations, including Iran, South Korea, US, and Taiwan. To our best knowledge, no previous study considered DNN with RFE for DR prediction. The proposed DNN and RFE model achieved superior performance compared with all previous models in terms of model accuracy. However, SVM [17] and Lasso [14] achieved superior AUC for DR. Most of the previous studies used holdout for model validation, whereas we used stratified 10-fold CV to avoid overfitting.
Table 5.Comparison with previous studies for predicting diabetes retinopathy (DR).
Dataset Population Study Method Number of Features Model Validation Accuracy AUC
DR
Iran [13] LR 9 - - 0.704
South Korea [14] Lasso 19 Holdout (67:33) 0.736 0.810
United States [15] Ensemble RUSBoost 11 Holdout (80:20) 0.735 0.720
Taiwan [17] SVM 10 Holdout (80:20) 0.795 0.839
United States [16] ANN+SMOTE 8 Holdout (66:34) - 0.754
Iran Current DNN+RFE 13 Stratified 10-fold CV 0.820 0.804
Notes: DNN=deep neural network; RFE=recursive feature elimination; LR=logistic regression; SVM=support vector machine; ANN=artificial neural network; SMOTE=synthetic minority oversampling technique.
Risk factors and their relative importance vary across the world and the previous studies showed that important predictors could be retrieved for DR. Hosseini et al. [13] used age, BMI, sex, diabetes duration, and HbA1c; whereas Oh et al. [14] identified fasting BG, triglyceride, low BMI, and insulin therapy as strong predictors. Other studies also identified insulin use [17] and A1C [16] as important risk factors. Our proposed study used RFE to select the best variables and identified the top five risk as diabetes duration, fasting BG, HDL, Age, and A1c; which are largely consistent with selected risk factors from previous studies.
Directly comparing these results is inappropriate, since they were derived from different datasets, pre-processing methods, and validation methods. Therefore, Table5should not be considered as strong evidence regarding model performance, but it provides a general comparison and allows discussions regarding the proposed model and previous approaches. We used a public dataset for the current study, which was limited to small populations in Iran. Benchmarking machine learning models will become somewhat fairer as other datasets become publicly available.
Mathematics2020,8, 1620 14 of 19
4.4. Another Diabetes Dataset
To evaluate the proposed prediction model robustness and generalization, we compared it with other machine learning models and datasets (diabetic nephropathy and hypertension–diabetes). Diabetic nephropathy (DN) is a serious kidney-related complication (kidney disease) relatively commonly developed by T1D and T2D patients. The DN dataset we employed was related to DR (Table1), provided by Khodadadi et al. [40]. The dataset was gathered from 133 diabetic patients with 73 among them developing DN. Thus, we used the same 14 input features as in Table1but with a different output class, i.e., DN. The description of DN dataset can be seen in AppendixA(see TableA1). The objective for this dataset was to classify whether the diabetic patient would develop DN.
We also gathered a dataset from the National Health Insurance Sharing Service (NHISS) Korea comprising applicant’s general health data 2013–2014 [52]. The original input variables were age group (BTH_G), systolic blood pressure (BP), diastolic BP, fasting BG, BMI, and sex. The dataset included four classes, where the subject was diagnosed to have hypertension, diabetes (T1D or T2D), hypertension and diabetes, or healthy (no diabetes or hypertension history). We converted this multiclass into a binary classification problem, transforming it into healthy or disease (hypertension, diabetes), and removed fasting BG, since this variable is closely related with diabetes diagnosis. We randomly selected 1000 individuals from approximately 1 million, and hence, the final dataset comprised 761 healthy and 239 disease (hypertension, diabetes) patients. The description of NHISS dataset can be seen in AppendixA(see TableA2). The objective for this dataset was to classify whether the subject would develop disease (i.e., hypertension or diabetes).
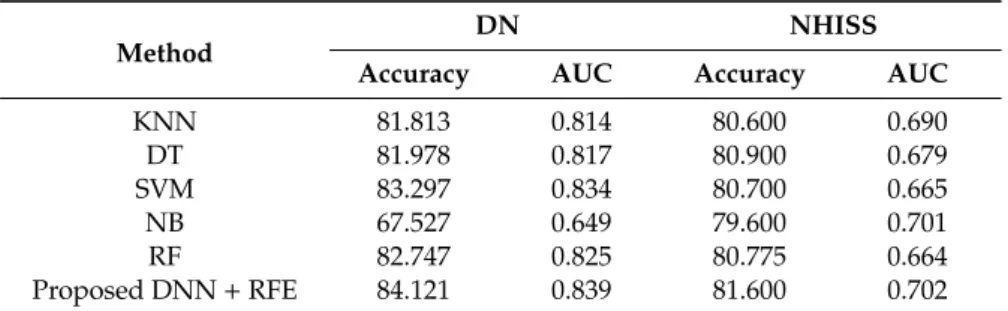
Table6compares classification performance for the proposed DNN+RFE model with other machine learning models (KNN, DT, SVM, NB, and RF). Average accuracy and AUC were calculated from 10 runs of stratified 10-fold CV. The proposed model achieved superior accuracy and AUC for both datasets: 84.121% and 0.839 for the DN and 81.600% and 0.702 for the NHISS datasets, respectively.
Table 6.Proposed prediction model performance compared with other models for public datasets.
Method
DN NHISS
Accuracy AUC Accuracy AUC
KNN 81.813 0.814 80.600 0.690 DT 81.978 0.817 80.900 0.679 SVM 83.297 0.834 80.700 0.665 NB 67.527 0.649 79.600 0.701 RF 82.747 0.825 80.775 0.664 Proposed DNN+RFE 84.121 0.839 81.600 0.702
Notes: DN = diabetes nephropathy dataset, NHISS = hypertension–diabetes dataset from NHISS, Korea. RF=random forest; DNN=deep neural network; RFE=recursive feature elimination; KNN =k-nearest neighbor; SVM=support vector machine; DT=decision tree; NB=naïve Bayes.
Applying RFE, we selected 13 features for the DN dataset and 3 for the NHISS dataset (BTH_G, Systolic BP, and BMI), and we used grid search to optimize the DNN hyperparameter. Thus, we found the optimal DNN design for the DN dataset to be five hidden layers (100, 64, 128, 64, 32), ReLU activation function, and a maximum of 100 iterations. For NHISS dataset, DNN with five hidden layers (100, 64, 128, 64, 32) and tanh activation function has achieved highest accuracy. The best optimization algorithms were identified as LBFGS (limited-memory Broyden–Fletcher–Goldfarb–Shanno) and Adam for the DN and NHISS datasets, respectively. These additional experiments confirmed the proposed model robustness toward different healthcare domains.
5. Conclusions and Future Work
The current study combined DNN with RFE to predict DR. The model is expected to help individuals foresee DR danger based on risk factors during initial disease phases. A public dataset
incorporating DR risk factors was utilized, and the proposed model performance was compared with previous best-practice KNN, DT, SVM, NB, and RF models. The proposed model outperformed conventional classification models and most other previous models, achieving accuracy=82.033%.
We applied RFE to identify significant features from all datasets, i.e., extracting the highest DR risk factors. Combining RFE and DNN improved the prediction accuracy as compared with all other considered feature selection methods (chi-squared, ANOVA, and extra trees). The proposed DNN+RFE model improved the accuracy (9.07%) compared with DNN without feature selection. Thus, machine learning combined with feature selection can effectively detect DR. This offers increased cost-effectiveness for health care systems, where decision support based on the proposed prediction model could provide decision opinions. We hope this study will help reduce the DR risk for diabetic patients, which is the major cause of blindness.
The dataset used here was from a relatively small and quite specific population; hence, the prediction model outcomes cannot not be simply generalized for broader application. Similarly, the identified important risk factors might not be appropriate for other populations. Thus, as it stands, the proposed model would be unsuitable for clinical trials due to dataset limitations. Therefore, the proposed approach should be extended to other clinical datasets and compared widely with other prediction and feature selection models. Once model validation is extended to broader datasets, other risk factors affecting DR could be identified.
Author Contributions: Conceptualization, G.A. and P.S.; data curation, G.A. and J.S.; formal analysis, N.L.F.; methodology, G.A. and M.S.; project administration, J.R.; resources, P.S. and J.S.; software, G.A. and M.S.; validation, M.A.; visualization, N.L.F.; writing—original draft, G.A.; writing—review & editing, M.S. and M.A. All authors have read and agreed to the published version of the manuscript.
Funding:This paper receives no external funding.
Conflicts of Interest:The authors declare no conflict of interest. Abbreviations
The following abbreviations are used in this manuscript. ANN Artificial Neural Network
ANOVA Analysis of Variance AUC Area under the ROC Curve
BG Blood Glucose
BMI Body Mass Index
CV Cross Validation
CVD Cardiovascular Disease DBP Diastolic Blood Pressure Dias BP Diastolic Blood Pressure
DM Diabetes Mellitus
DN Diabetic Nephropathy
DNN Deep Neural Network
DR Diabetic Retinopathy
DT Decision Tree
FBS Fasting Blood Sugar
GWO Grey Wolf Optimization
HbA1c Hemoglobin A1c
HDL High-density Lipoproteins KNN K-Nearest Neighbor LBFGS Limited-memory Broyden–Fletcher–Goldfarb–Shanno LDL Low-density Lipoprotein LR Logistic Regression NB Naïve Bayes
NHISS National Health Insurance Sharing Service PCA Principal Components Analysis
Mathematics2020,8, 1620 16 of 19
PVD Peripheral Vessel Disease ReLU Rectified Linear Units
RF Random Forest
RFE Recursive Feature Elimination ROC Receiver Operating Characteristic SBP Systolic Blood Pressure
SGD Stochastic Gradient Descent
SMOTE Synthetic Minority Over-sampling Technique SVM Support Vector Machine
SVM-RFE Support Vector Machine–Recursive Feature Elimination Sys BP Systolic Blood Pressure
T1D Type 1 Diabetes
T2D Type 2 Diabetes
TG Triglyceride
Appendix A
TableA1describes the diabetes nephropathy (DN) dataset, comprises residents’ risk factors from 133 diabetic patients with 73 among them developing DN (Khodadadi et al. [40]). The dataset is made publicly available by previous authors (https://data.mendeley.com/datasets/k62fdsnwkg/1).
Table A1.Diabetic nephropathy (DN) dataset.
No Attribute Description Type Range
1 BMI Subject’s body mass index Numeric 18–41
2 DM duration Subject’s diabetes duration (y) Numeric 0–30
3 A1c Subject’s average blood glucose level
over the past 3 months (mg/dL) Numeric 6.5–13.3
4 Age Subject’s age (y) Numeric 16–79
5 FBS Subject’s fasting blood sugar level
(mg/dL) Numeric 80–510
6 LDL Subject’s low-density lipoprotein level
(mg/dL) Numeric 36–267
7 HDL Subject’s high-density lipoprotein
level (mg/dL) Numeric 20–62
8 TG Subject’s triglyceride level (mg/dL) Numeric 74–756
9 Sys BP Subject’s systolic blood pressure
(mmHg) Numeric 105–180
10 Dias BP Subject’s diastolic blood pressure
(mmHg) Numeric 60–120
11 Sex Subject’s sex Categorical 0=Female
1=Male
12 DM type Subject’s diabetes type Categorical 0=T1D
1=T2D
13 DM treat Subject’s diabetes treatment Categorical
0=Both (Insulin and oral agent) 1=Insulin 2=Oral agent
14 Statin Subject’s statin status (frequently
used as part of diabetes care) Categorical
0=Ator (atorvastatin) 1=No statin 2=ROS (rosuvastatin) 15 Nephropathy (class) Subject’s nephropathy status Categorical 0=No (60)
TableA2describes the NHISS Korea dataset, comprises residents’ risk factors from 1000 individuals with 239 among them developing disease (hypertension, diabetes) [50]. The NHISS Korea dataset is available online (https://nhiss.nhis.or.kr/bd/ab/bdabf003cv.do).
Table A2.National Health Insurance Sharing Service (NHISS) Korea dataset.
No Attribute Description Type Range
1 BTH_G Age group of a subject Categorical
0=20–24 1=25–26 2=27–28 . . .
26=greater than 75 2 SBP Subject’s systolic blood pressure
(mmHg) Numeric 84–190
3 DBP Subject’s diastolic blood pressure
(mmHg) Numeric 50–120
4 BMI Subject’s body mass index Numeric 15.6–39.9
5 SEX Subject’s sex Categorical 0=Male
1=Female 6 DIS (class) Subject’s disease (hypertension,
diabetes) status Categorical
0=No (761) 1=Yes (239)
References
1. American Diabetes Association. Standards of medical care in diabetes. Diabetes Care2006,29(Suppl. 1), S4–S42.
2. American Diabetes Association. Introduction: Standards of Medical Care in Diabetes.Diabetes Care2018,41, S1–S2. [CrossRef] [PubMed]
3. Silverstein, J.; Klingensmith, G.; Copeland, K.; Plotnick, L.; Kaufman, F.; Laffel, L.; Deeb, L.; Grey, M.; Anderson, B.; Holzmeister, L.A.; et al. Care of Children and Adolescents with Type 1 Diabetes: A statement of the American Diabetes Association.Diabetes Care2005,28, 186–212. [CrossRef] [PubMed]
4. Goldstein, D.E.; Little, R.R.; Lorenz, R.A.; Malone, J.I.; Nathan, D.; Peterson, C.M.; Sacks, D.B. Tests of Glycemia in Diabetes.Diabetes Care2004,27, 1761–1773. [CrossRef] [PubMed]
5. Klein, R. Relationship of Hyperglycemia to the Long-term Incidence and Progression of Diabetic Retinopathy. Arch. Intern. Med.1994,154, 2169. [CrossRef]
6. Mohamed, S.; Murray, J.C.; Dagle, J.M.; Colaizy, T. Hyperglycemia as a risk factor for the development of retinopathy of prematurity.BMC Pediatr.2013,13, 78. [CrossRef]
7. Schrijvers, B.F.; De Vriese, A.S.; Flyvbjerg, A. From Hyperglycemia to Diabetic Kidney Disease: The Role of Metabolic, Hemodynamic, Intracellular Factors and Growth Factors/Cytokines.Endocr. Rev. 2004,25, 971–1010. [CrossRef]
8. Alicic, R.Z.; Rooney, M.T.; Tuttle, K.R. Diabetic Kidney Disease: Challenges, Progress, and Possibilities. Clin. J. Am. Soc. Nephrol.2017,12, 2032–2045. [CrossRef]
9. Selvin, E.; Marinopoulos, S.; Berkenblit, G.; Rami, T.; Brancati, F.L.; Powe, N.R.; Golden, S.H. Meta-Analysis: Glycosylated Hemoglobin and Cardiovascular Disease in Diabetes Mellitus.Ann. Intern. Med.2004,141, 421. [CrossRef]
10. Ormazabal, V.; Nair, S.; Elfeky, O.; Aguayo, C.; Salomon, C.; Zuñiga, F.A. Association between insulin resistance and the development of cardiovascular disease.Cardiovasc. Diabetol.2018,17, 122. [CrossRef] 11. Cheung, N.; Mitchell, P.; Wong, T.Y. Diabetic retinopathy.Lancet2010,376, 124–136. [CrossRef]
12. Golubnitschaja, O. Advanced Diabetes Care: Three Levels of Prediction, Prevention & Personalized Treatment. Curr. Diabetes Rev.2010,6, 42–51. [CrossRef] [PubMed]
13. Hosseini, S.M.; Maracy, M.R.; Amini, M.; Baradaran, H.R. A risk score development for diabetic retinopathy screening in Isfahan-Iran.J. Res. Med. Sci.2009,14, 105–110. [PubMed]
14. Oh, E.; Yoo, T.K.; Park, E.-C. Diabetic retinopathy risk prediction for fundus examination using sparse learning: A cross-sectional study.BMC Med. Inform. Decis. Mak.2013,13, 106. [CrossRef]
Mathematics2020,8, 1620 18 of 19
15. Ogunyemi, O.; Kermah, D. Machine Learning Approaches for Detecting Diabetic Retinopathy from Clinical and Public Health Records.AMIA Annu. Symp. Proc.2015,2015, 983–990.
16. Ogunyemi, O.I.; Gandhi, M.; Tayek, C. Predictive Models for Diabetic Retinopathy from Non-Image Teleretinal Screening Data.AMIA Jt. Summits Transl. Sci. Proc.2019,2019, 472–477.
17. Tsao, H.-Y.; Chan, P.-Y.; Su, E.C.-Y. Predicting diabetic retinopathy and identifying interpretable biomedical features using machine learning algorithms.BMC Bioinform.2018,19, 283. [CrossRef]
18. Mallick, P.K.; Ryu, S.H.; Satapathy, S.K.; Mishra, S.; Nguyen, G.N.; Tiwari, P. Brain MRI Image Classification for Cancer Detection Using Deep Wavelet Autoencoder-Based Deep Neural Network.IEEE Access2019,7, 46278–46287. [CrossRef]
19. Akyol, K. Comparing of deep neural networks and extreme learning machines based on growing and pruning approach.Expert Syst. Appl.2020,140, 112875. [CrossRef]
20. De Falco, I.; De Pietro, G.; Della Cioppa, A.; Sannino, G.; Scafuri, U.; Tarantino, E. Evolution-based configuration optimization of a Deep Neural Network for the classification of Obstructive Sleep Apnea episodes.Future Gener. Comput. Syst.2019,98, 377–391. [CrossRef]
21. Koshimizu, H.; Kojima, R.; Kario, K.; Okuno, Y. Prediction of blood pressure variability using deep neural networks.Int. J. Med. Inform.2020,136, 104067. [CrossRef] [PubMed]
22. Kim, J.; Kim, J.; Kwak, M.J.; Bajaj, M. Genetic prediction of type 2 diabetes using deep neural network. Clin. Genet.2018,93, 822–829. [CrossRef] [PubMed]
23. Kannadasan, K.; Edla, D.R.; Kuppili, V. Type 2 diabetes data classification using stacked autoencoders in deep neural networks.Clin. Epidemiol. Glob. Health2019,7, 530–535. [CrossRef]
24. Ramachandran, N.; Hong, S.C.; Sime, M.J.; Wilson, G.A. Diabetic retinopathy screening using deep neural network: Diabetic retinopathy screening.Clin. Exp. Ophthalmol.2018,46, 412–416. [CrossRef]
25. Gao, Z.; Li, J.; Guo, J.; Chen, Y.; Yi, Z.; Zhong, J. Diagnosis of Diabetic Retinopathy Using Deep Neural Networks.IEEE Access2019,7, 3360–3370. [CrossRef]
26. Parmar, R.; Lakshmanan, R.; Purushotham, S.; Soundrapandiyan, R. Detecting Diabetic Retinopathy from Retinal Images Using CUDA Deep Neural Network. InIntelligent Pervasive Computing Systems for Smarter Healthcare; Sangaiah, A.K., Shantharajah, S., Theagarajan, P., Eds.; Wiley: Hoboken, NJ, USA, 2019; pp. 379–396. ISBN 978-1-119-43896-0.
27. Shankar, K.; Perumal, E.; Vidhyavathi, R.M. Deep neural network with moth search optimization algorithm based detection and classification of diabetic retinopathy images.SN Appl. Sci.2020,2, 748. [CrossRef] 28. Ayhan, M.S.; Kühlewein, L.; Aliyeva, G.; Inhoffen, W.; Ziemssen, F.; Berens, P. Expert-validated estimation of
diagnostic uncertainty for deep neural networks in diabetic retinopathy detection.Med. Image Anal.2020, 64, 101724. [CrossRef]
29. Gadekallu, T.R.; Khare, N.; Bhattacharya, S.; Singh, S.; Maddikunta, P.K.R.; Srivastava, G. Deep neural networks to predict diabetic retinopathy.J. Ambient Intell. Human Comput.2020. [CrossRef]
30. Guyon, I.; Weston, J.; Barnhill, S.; Vapnik, V. Gene Selection for Cancer Classification using Support Vector Machines.Mach. Learn.2002,46, 389–422. [CrossRef]
31. Gysels, E.; Renevey, P.; Celka, P. SVM-based recursive feature elimination to compare phase synchronization computed from broadband and narrowband EEG signals in Brain–Computer Interfaces.Signal Process.2005, 85, 2178–2189. [CrossRef]
32. Yin, Z.; Zhang, J. Operator functional state classification using least-square support vector machine based recursive feature elimination technique.Comput. Methods Programs Biomed.2014,113, 101–115. [CrossRef] [PubMed]
33. Senturk, Z.K. Early diagnosis of Parkinson’s disease using machine learning algorithms.Med. Hypotheses 2020,138, 109603. [CrossRef] [PubMed]
34. Chatterjee, S.; Dey, D.; Munshi, S. Integration of morphological preprocessing and fractal based feature extraction with recursive feature elimination for skin lesion types classification. Comput. Methods Programs Biomed.2019,178, 201–218. [CrossRef] [PubMed]
35. Wang, C.; Xiao, Z.; Wang, B.; Wu, J. Identification of Autism Based on SVM-RFE and Stacked Sparse Auto-Encoder.IEEE Access2019,7, 118030–118036. [CrossRef]
36. Richhariya, B.; Tanveer, M.; Rashid, A.H. Diagnosis of Alzheimer’s disease using universum support vector machine based recursive feature elimination (USVM-RFE).Biomed. Signal Process. Control2020,59, 101903. [CrossRef]