HOW MUCH RISK IS ACCEPTABLE
?
* Alicia H. Munnell is the Director of the Center for Retirement Research at Boston College (CRR) and the Peter F. Drucker Professor of Management Sciences at Boston College’s Carroll School of Management. Anthony Webb is a research economist at the CRR. Alex Golub-Sass is a research associate at the CRR. The authors thank Gary Burtless for helpful comments.
Introduction
The financial crisis has sparked proposals to reform the retirement income system. One component of such a system could be a new tier of retirement ac-counts. These accounts would augment declining Social Security replacement rates for low-wage work-ers and provide a buffer of security for middle- and upper-wage workers who, increasingly, will rely totally on 401(k) plans to supplement their Social Security. Designing such a new tier requires answering a num-ber of questions: Mandatory or voluntary? Employee and/or employer contributions? Subsidies for low earners? Payments as lump sums or annuities? Tax favored or not? But the most fundamental question is whether the goal of the new tier is to provide a defined contribution account, where the retirement income will depend on market performance, or an account that can provide a certain percent of final earnings – that is, a target replacement rate.
This brief takes the first step in exploring the ques-tion of how much risk is acceptable. The first secques-tion makes the case for a new tier of retirement income. The second section describes the implications of us-ing a defined contribution approach for the new tier. The third section uses a model developed by Gary Burtless1 to demonstrate that even using target date funds and full annuitization at retirement, a defined contribution approach produces enormous variation in outcomes. The fourth section explores the impli-cations of modifying these fluctuations. The final section concludes.
The Need for More
Retirement Income
People need more retirement saving because the existing retirement income system is contracting and people are living longer.
Social Security
At any given retirement age, Social Security ben-efits will replace a smaller fraction of pre-retirement earnings than in the past for three reasons. First, the increase in the Full Retirement Age from 65 to 67 is equivalent to an across-the-board cut.2 Second, premiums for Medicare Part B and for the new Part D drug benefit, which are automatically deducted from Social Security benefits, are slated to increase sharply due to rising health care costs.3 Finally, Social Secu-rity benefits will be taxed more under the personal income tax, as the exemption amounts in the tax code are not indexed to inflation, so taxation will move fur-ther down the income distribution. As shown in Fig-ure 1 on the next page, these three factors will reduce the net replacement rate for the median worker, who claims at age 65, from 39 percent in 2002 to 28 per-cent in 2030. Note that this figure does not include any additional benefit cuts that might be enacted to shore up the solvency of the Social Security program.4
Individual Saving
Given the decline in Social Security and employer provided pensions and the rise in longevity, workers could save more. But that does not appear to be the case. A recent study based on the SCF found that median household wealth, excluding Social Security and employer defined benefit pensions, has remained remarkably constant relative to household income. This phenomenon is demonstrated in Figure 3 by the fact that the wealth-to-income ratios for each survey
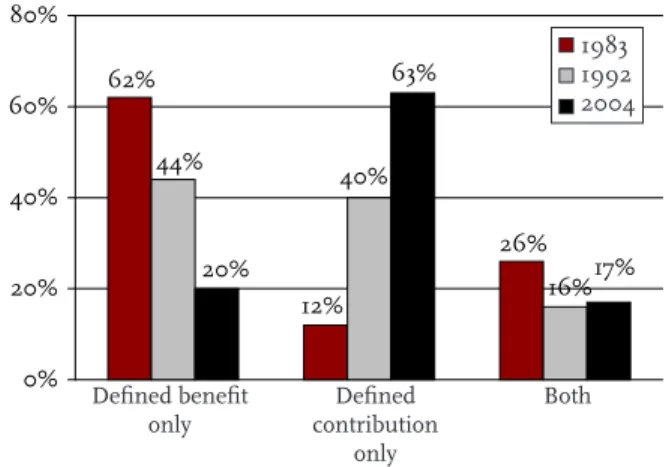
Figure 2. Percent of Workers with Pension Coverage by Type of Plan from SCF, 1983-2004
Source: Munnell and Sundén (2006).
Private Sector Employer-Sponsored
Pensions
With a diminished role for Social Security, retirees will be increasingly dependent on employer-spon-sored pensions. At any moment in time, however, less than half of the private sector workforce age 25-64 participates in an employer-sponsored plan of any type. This fraction has remained virtually unchanged since the late 1970s, and is unlikely to improve.5 Since pension participation tends to increase with earnings, only middle- and upper-income individu-als can count on receiving meaningful benefits from employer-sponsored pension plans.
While the level of pension coverage has remained flat, the nature of pension coverage has changed dramatically. Twenty years ago, most people with pension coverage had a traditional defined benefit plan that pays a lifetime annuity at retirement (see Figure 2). Today, most people with a pension have a defined contribution plan – typically a 401(k). In theory, workers could accumulate substantial wealth in a 401(k) and offset the decline in both Social Security and employer provided pensions. But reality looks quite different. The Federal Reserve’s 2004 Survey of Consumer Finances (SCF) reports that the typical household head approaching retirement (55-64) had 401(k)/IRA balances of only $60,000.6 Nor do younger cohorts seem to be on track to accumulate sufficient wealth to support themselves in retirement.
Figure 1. Social Security Replacement Rates for the Median Earner, 2002 and 2030
Source: Authors’ update from Munnell (2003).
41% 39% 36% 31% 28% 0% 10% 20% 30% 40% 50% 2002 2030
Figure 3. Ratio of Wealth to Income in the SCF, by Age Group, Selected Years 1983-2004
Source: Authors’ update from Delorme, Munnell, and Webb (2006). 26% 12% 62% 16% 40% 44% 17% 63% 20% 0% 20% 40% 60% 80% 0 1 2 3 4 5 20-22 26-28 32-34 38-40 44-46 50-52 56-58 62-64 Age 1983 1986 1989 1992 1995 1998 2001 2004 Reported replacement rate (2030 incorporates extension of
full retirement age)
After Medicare SMI deductions (2030 incorporates both Parts B and D)
After personal income taxation
Defined benefit
only contribution Defined only
Both 1983 1992 2004
lie on top of one another. In other words, households have not increased their accumulation of wealth to offset the demise of employer defined benefit plans or the scheduled reduction in Social Security replace-ment rates.7
Thus, the outlook for retirement income for future cohorts of retirees is dismal.8 And it is dismal both for those who must rely only on Social Security and for those who have a supplementary 401(k) plan. Ef-forts to expand coverage through automatic Individual Retirement Accounts (IRAs) and other proposals im-ply that those who already have a supplementary plan will be adequately prepared for retirement. Although 401(k) plans received a boost from the Pension Pro-tection Act of 2006, which encouraged employers to make their plans easier and more automatic, the basic fragility of 401(k)s was exposed by the current finan-cial crisis, which has reduced the value of equities in 401(k)s/IRAs by about $2 trillion.9 Thus, virtually all future retirees will need an additional tier of retire-ment saving (see Figure 4).
tions in stocks and bonds. The following discussion focuses on the implications of a defined contribution approach for a new tier, and parenthetically provides information about the inevitable outcomes from the 401(k) system already in place.
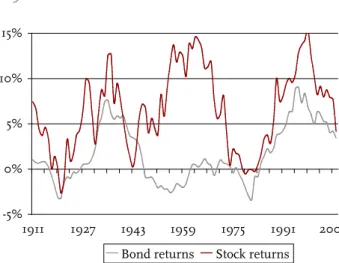
Accumulating money in an account and then turn-ing the accumulated balances into a stream of income involves two types of financial risk. The first occurs before retirement. Figure 5 shows the real (inflation-adjusted) returns on stocks and bonds during the last hundred years. Over this period, the average real return on stocks was 7.5 percent and on bonds 2.6 percent.10 The variability, as measured by the standard deviation, was much higher for stocks than bonds: 19.0 percent compared to 8.4 percent.
The returns achieved during the 15-year period leading up to retirement have an enormous impact on replacement rates, as during this period the effect of returns on savings dominates the effect of additional contributions. Figure 5 shows the annual average real return on stocks and bonds over 15-year periods ending 1911 to 2008. Stock returns varied from nega-tive numbers in 1920 and 1980 to annual returns in excess of 12 percent for 15-year periods ending in the mid-1930s, the 1960s, and the 1990s.
Figure 4. Additional Tier of Funded, Privately-Managed Retirement Saving
Source: Authors’ illustration.
0% 20% 40% 60% 80% 100% Income 401(k) plans New Tier Social Security
The Defined Contribution
Approach
If the decision were made to introduce a new tier of retirement income, the next question is how that tier should be structured. One option is a defined benefit plan where participants contribute towards a fixed replacement rate. The alternative is a defined contri-bution plan where participants invest their
contribu-Figure 5. Real Returns to Stock and Bonds, 1911-2008
Note: To eliminate some of the fluctuations in annual rates of return, the chart shows the annual rate of return on a dol-lar invested in the stock market 15 years before the indicated date. Source: Burtless (2008). -5% 0% 5% 10% 15% 1911 1927 1943 1959 1975 1991 2007 Bond returns Stock returns
Social Security New tier 401(k) plans
The second source of financial risk occurs if the participant wishes to purchase an annuity to avoid outliving his or her accumulated wealth. The price of the annuity depends on a host of factors: the age of the worker, marketing and other expenses incurred by the insurance company, the amount of adverse selection (that is, the extent to which only people who expect to live for a long time purchase annuities), and the interest rate. If interest rates are high, the insur-ance company can expect to make substantial earn-ings on the participant’s initial payment and therefore can provide a high monthly amount to the purchaser. If interest rates are low at the time the annuity is pur-chased, the monthly payment will also be low.
How Market Risk Affects
Retirement Income
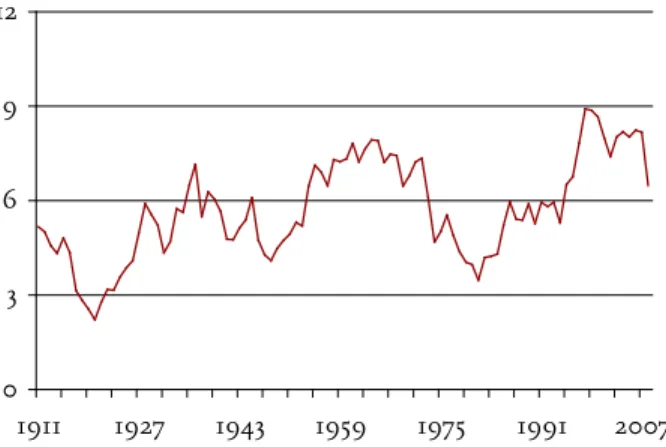
To show how these two types of financial risk can affect the retirement income received by participants, we adopt a model developed by Gary Burtless. This model involves a number of assumptions. Workers are assumed to enter the workforce at 22, work for 40 years, retire at age 62, and annuitize their pension wealth at retirement. Each year they contribute 6 per-cent of their income to their account. The assump-tion is that they invest their contribuassump-tions in a target date fund, where the percent in equities at age 25 is 90 percent, declining to about 45 percent by age 65. Real wages are assumed to grow at 2 percent a year. Figure 6 shows the total accumulations relative to average (age 54-58) earnings for a worker in each year. People who were lucky enough to retire dur-ing the 1960s would have built up assets equal to 9 times their average earnings, whereas those retiring in the 1980s would have assets equal to less than four times earnings. Or consider a more recent compari-son. Those retiring in 2000 would have accumulated assets equal to eight times their final earnings, while those retiring in 2008 would have had assets of only about 6 times earnings.
The goal, however, is not simply to accumulate a pile of assets but to provide retirement income. The most efficient way to transform assets into income is to purchase an annuity. The two types considered here are nominal annuities and inflation-adjusted annuities. It is possible that those who had a good accumulation experience could face low interest rates when it came to purchasing an annuity, or that those who had a bad accumulation experience could enjoy
high interest rates. In such a case, the purchasing of the annuity could mitigate some of the variation in accumulated balances.
Figure 7 shows the initial replacement rate for participants retiring and purchasing either a nominal or inflation-adjusted annuity in a given year.11 The replacement rate for the nominal annuity exceeds that for a real annuity, because the latter starts low and increases over time in line with changes in the
Con-Figure 6. Ratio of Assets to Earnings Using a Target Date Fund, 1911-2008
Note: Figure shows the ratio of assets to average (age 54-58) earnings for individuals who enter the labor force at 22 and retire at 62.
Sources: Authors’ calculations based on Burtless (2000); Burtless (2008); and Fidelity (2008).
Figure 7. Replacement Rate from Real and Nominal Annuities Based on Assets Accumulated in a Target Date Fund, 1925-2008
Sources: Authors’ calculations based on Burtless (2000); Burtless (2008); Federal Reserve Bank of Philadelphia (2008); and Federal Reserve Bank of St. Louis (2008).
0 3 6 9 12 1911 1927 1943 1959 1975 1991 2007 0% 20% 40% 60% 80% 1925 1935 1945 1955 1965 1975 1985 1995 2005 Nominal annuity Real annuity
sumer Price Index. As in the case of accumulations, replacement rates vary significantly over time. To take the most recent period as an example, a person retiring in October 2000 with an inflation-adjusted annuity would have had a replacement rate of 50 percent whereas someone retiring in October 2008 would have had a replacement rate of 28 percent.
As to the question of whether interest rates offset the accumulation experience, it appears that the an-swer is ‘somewhat.’ Figure 8 shows a measure of the fluctuations – the standard deviation relative to the mean – for the ratio of accumulations to income and for the two annuity types relative to income. The real and nominal interest rates appear to somewhat offset the variability from the accumulation phase.
The bottom line is that the defined contribution approach for the provision of retirement income pro-duces dramatically different levels of retirement in-come depending on the performance of the markets. This story is true even when the participants invest in target date funds that reduce their exposure to equity markets as they approach retirement.
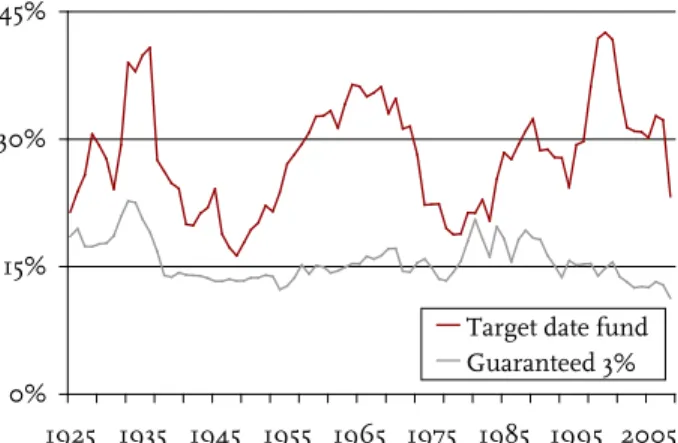
phase and then provide an inflation-adjusted annuity at retirement. As an example, consider a 3.0 percent guaranteed rate, which is likely on the high-end of what is feasible.12 Figure 9 compares the outcome from such a guarantee, assuming a 5-percent contri-bution rate, with that from investing an equivalent amount in a target date fund. Three facts emerge from this comparison. First, a guaranteed rate reduc-es most of the fluctuations, although some remain be-cause the real interest rate and life expectancies faced by annuity providers vary over time. Second, the replacement rate on average is much lower. That is, over the period 1925-2008, the average replacement rate using a guaranteed real rate of three percent is 15 percent compared to 28 percent from the target date fund. Third, in every period, including 1929 and 2008, the guaranteed return retirement plan would have produced a lower replacement rate than the life-cycle fund, or indeed a 100 percent equity fund.
Figure 8. Ratio of Standard Deviation to Mean of Accumulations to Income, Real Annuity and Nominal Annuity, 1925-2008
Sources: Authors’ calculations based on Burtless (2000); Burtless (2008); U.S. Bureau of Labor Statistics (2008); Federal Reserve Bank of Philadelphia (2008); and Federal Reserve Bank of St. Louis (2008).
Reducing the Risk in Defined
Contribution Plans
One way to overcome the enormous fluctuations in replacement rates described above is to guarantee par-ticipants a real rate of return during the accumulation
Figure 9. Replacement Rate from Real Annuity From Target Date Fund Versus Fund with 3-Per-cent Real Return, 1925-2008
Sources: Authors’ calculations based on Burtless (2000); Burtless (2008); U.S. Bureau of Labor Statistics (2008); Federal Reserve Bank of Philadelphia (2008); and Federal Reserve Bank of St. Louis (2008).
This simulation highlights the inherent trade-off between accepting the fluctuations inherent in investing in the stock and bond markets and the lower return involved in any form of guarantee. Although historical data indicate that it is unlikely that a household investing in a life-cycle fund would obtain a lower replacement rate than one investing in a guaranteed fund, the possibility cannot be ruled out, particularly if, as many commentators believe, future equity returns will be lower than those enjoyed over
0.22 0.23 0.00 0.05 0.10 0.15 0.20 0.25 0.30
Final assets Real annuity Nominal annuity .27 0% 15% 30% 45% 1925 1935 1945 1955 1965 1975 1985 1995 2005 Target date fund Guaranteed 3%
the past century. And a household investing in a life-cycle fund may be lulled into a false sense of security by favorable returns in the years leading up to retire-ment, only to face a calamitous decline in the value of its portfolio immediately prior to retirement.
Conclusion
The analysis in this brief suggests that in a defined contribution plan, replacement rates will vary dra-matically depending on the period over which the participant is working and accumulating assets. This pattern occurs even when individuals invest in a target date fund. These accumulation effects are only somewhat offset by interest rates at retirement.
The question is whether such variation is ac-ceptable in a new tier of retirement income. If so, policymakers would be agreeing to widely different replacement rates each year depending on the perfor-mance of the market over the participants’ working years. If such an outcome is not acceptable, mecha-nisms would be needed to eliminate some or all of the variation. But such mechanisms are not costless. So the challenge becomes one of weighing the costs and benefits of alternative approaches.
The analysis also has implications for the out-comes of 401(k) plans. After all, investing in a target date fund for forty years, without any withdrawals, is as good as a 401(k) participant can do. Yet these simulations show that replacement rates generated by even the most effective saving behavior in a 401(k) system will vary as much as 32 percentage points depending on the performance of the stock market and interest rates.
Endnotes
1 For more details, see Burtless (2000, 2008). 2 Under legislation enacted in 1983, the increase in the Full Retirement Age began with those born in 1938 (turning 62 in 2000) and will be fully phased in for those born in 1960 (turning 62 in 2022).
3 The premium for Medicare Part B alone is pro-jected to increase from 9 percent of the average Social Security benefit in 2007 to 12 percent in 2030 (according to unpublished data from the Centers for Medicare and Medicaid Services, 2008).
4 For married couples, and most Americans retire as part of a married couple, Social Security already re-places a significantly smaller share of household earn-ings than it did as recently as 1990, and will replace even less going forward (Munnell, Sanzenbacher and Soto 2007). The reason is the dramatic increase in the labor force participation of married women. As married households have increasingly relied on the earnings of working wives, these earnings have not produced a comparable increase in Social Security benefits. The reason is that the program provides a guaranteed spousal benefit for the wife equal to 50 percent of her husband’s Primary Insurance Amount – the benefit to which he would be entitled at the Full Retirement Age. The increased labor force participa-tion of married women will increase the household’s Social Security benefits only to the extent that benefits based on their earnings records exceed this spousal minimum. The average Social Security replacement rate for one-earner couples in the Health and Retire-ment Study is thus 58 percent compared to 41 percent for two-earner couples (Munnell and Soto, 2005). 5 The pension coverage data discussed above apply only to individual workers at any given point in time. Over a lifetime and on a household – rather than an individual – basis, coverage rates are somewhat high-er. For households age 55-64, the Federal Reserve’s Survey of Consumer Finances shows that approximately 66 percent of households had some sort of pension coverage in 2004.
6 Munnell and Sundén (2006).
7 Delorme, Munnell, and Webb (2006).
8 Important studies by John Karl Scholz (Scholz et al., 2006, 2008) suggest that Americans up to the
Early Baby Boom generation are adequately prepared for retirement. Alternatively, Munnell, Webb, and Golub-Sass (2007) shows a large decline in prepared-ness over time, with the initial cohort in the Health and Retirement Survey well prepared for retirement and the Baby Boom and subsequent cohorts at signifi-cant risk.
9 Munnell and Muldoon (2008).
10 Bond returns are measured for investments in government bonds with a remaining maturity longer than seven years.
11 We assume that individuals purchase a joint life and two-thirds survivor annuity. The annuity is priced using Social Security Administration life tables for the appropriate birth cohort. Following Mitchell, Poterba, Warshawsky, and Brown (1999), we assume that the annuity has a money’s worth of 84.1 percent to a household with population average mortality when the income stream is discounted at either the ten year treasury bond interest rate (for the nominal annuity), or the 10-year Treasury Inflation-Protected Securities (TIPS) interest rate (for the real annuity). TIPS were first issued in 1997. For the period 1991 to 1996, we estimate a real interest rate by deducting the ten-year inflation forecast published in the Livingston Survey (Federal Reserve Bank of Philadelphia, 2008) from the ten-year Treasury rate. For years prior to 1990, we estimate a forecast inflation rate by first esti-mating forecast inflation for the period 1991 to 2008 as a function of the previous five years’ actual infla-tion, and then back-casting forecast inflation for 1925 to 1990. To correct for the abnormal inflation during World War II and the Korean War, we substitute aver-age inflation during the period 1925 to 1940 for actual inflation during the period 1941 to 1953.
12 A 3.0 percent real return is consistent with the rate used by the Social Security Administration in projections of the program’s long-term financial situa-tion (U.S. Social Security Administrasitua-tion, 2008). It is somewhat higher than the 2.5 percent average return on long-term Treasury bonds over the 1926-2005 pe-riod (Ibbotson Associates, 2006) and the 2.8 percent average yield on 10-year Treasury Inflation-Protected Securities (TIPS) over the past 12 years. Because interest rates can fluctuate substantially, no private insurer would be able to provide such guaranteed returns. Therefore, any meaningful guarantee would require government involvement.
References
Burtless, Gary. 2000. “How Would Financial Risk Affect Retirement Income Under Individual Ac-counts?” Issue in Brief 5. Chestnut Hill, MA: Cen-ter for Retirement Research at Boston College. Burtless, Gary. 2008. “Stock Market Fluctuations and
Retiree Incomes: An Update.” Washington, DC: The Brookings Institution.
Centers for Medicare and Medicaid Services. 2008. “Additional Information Regarding Comparisons of Beneficiary Income and Out-of-Pocket Costs for Medicare SMI.” Memo from Richard S. Foster and M. Kent Clemens. Washington, DC: Department of Health and Human Services.
Delorme, Luke, Alicia H. Munnell, and Anthony Webb. 2006. “Empirical Regularity Suggests Retirement Risks.” Issue in Brief 41. Chestnut Hill, MA: Center for Retirement Research at Boston College.
Federal Reserve Bank of Philadelphia. 2008. 10-Year Inflation Forecasts from the Livingston Survey, 1991-2008. Philadelphia, PA.
Federal Reserve Bank of St. Louis. 2008. Yields on 10-Year Treasury Inflation-Indexed Securities, 1997-2008. St. Louis, MO.
Fidelity Investments. 2008. Allocations to Equities for Fidelity Freedom Funds 2010- 2050 as of Septem-ber 30, 2008. Boston, MA:
Ibbotson Associates. 2006. Stocks, Bonds, Bills, and Inflation: 2006 Yearbook. Chicago, IL.
Mitchell, Olivia S., James M. Poterba, Mark J. War-shawsky, and Jeffrey R. Brown. 1999. “New Evi-dence of the Money’s Worth of Individual Annui-ties.” The American Economic Review 89(5). Munnell, Alicia H. 2003. “The Declining Role of
Social Security.” Just the Facts on Retirement Issues 6. Chestnut Hill, MA: Center for Retirement Re-search at Boston College.
Munnell, Alicia H. and Dan Muldoon. 2008. “Are Retirement Savings Too Exposed To Market Risk?” Issue in Brief 8-16. Chestnut Hill, MA: Center for Retirement Research at Boston College
Munnell, Alicia H., Geoffrey Sanzenbacher, and Mauricio Soto. 2007. “Working Wives Reduce Social Security Replacement Rates.” Issue in Brief 7-15. Chestnut Hill, MA: Center for Retirement Research at Boston College.
Munnell, Alicia H. and Mauricio Soto. 2005. “Sorting Out Social Security Replacement Rates.” Just the Facts on Retirement Issues 19. Chestnut Hill, MA: Center for Retirement Research at Boston College. Munnell, Alicia H. and Annika Sundén. 2006.
“401(k) Plans Are Still Coming Up Short.” Issue in Brief 43. Chestnut Hill, MA: Center for Retirement Research at Boston College.
Munnell, Alicia H., Anthony Webb, and Francesca Golub-Sass. 2007. “Is There Really a Retirement Savings Crisis? An NRRI Analysis.” Issue in Brief 7-11. Chestnut Hill, MA: Center for Retirement Research at Boston College.
Scholz, John Karl and Ananth Seshadri. 2008. “Are All Americans Saving ‘Optimally’ for Retirement?” Working Paper 2008-189. Ann Arbor, MI: Univer-sity of Michigan Retirement Research Center. Scholz, John Karl, Ananth Seshadri and Surachai
Khi-tatrakun. 2006. “Are Americans Saving ‘Optimal-ly’ for Retirement?” Journal of Political Economy 114(4): 607-643.
U.S. Board of Governors of the Federal Reserve System. Survey of Consumer Finances 1983-2004. Washington, DC.
U.S. Bureau of Labor Statistics. 2008. Historical Data from the Consumer Price Index, 1913-2008. Wash-ington, DC.
U.S. Social Security Administration. 2008. The 2008 Annual Report of the Board of Trustees of the Federal Old Age, Survivtors and Disability Insurance Trust Funds. Washington, DC: U.S. Government Print-ing Office.
lege was established in 1998 through a grant from the Social Security Administration. The Center’s mission is to produce first-class research and forge a strong link between the academic community and decision makers in the public and private sectors around an issue of critical importance to the nation’s future. To achieve this mission, the Center sponsors a wide variety of research projects, transmits new findings to a broad audience, trains new scholars, and broadens access to valuable data sources. Since its inception, the Center has established a reputation as an authori-tative source of information on all major aspects of the retirement income debate.
Massachusetts Institute of Technology Syracuse University
Urban Institute
Contact Information
Center for Retirement Research Boston College Hovey House 140 Commonwealth Avenue Chestnut Hill, MA 02467-3808 Phone: (617) 552-1762 Fax: (617) 552-0191 E-mail: [email protected] Website: http://www.bc.edu/crr
© 2008, by Trustees of Boston College, Center for Retire-ment Research. All rights reserved. Short sections of text, not to exceed two paragraphs, may be quoted without ex-plicit permission provided that the authors are identified and full credit, including copyright notice, is given to Trustees of Boston College, Center for Retirement Research.
The research reported herein was supported by the Cen-ter’s Partnership Program. The findings and conclusions expressed are solely those of the authors and do not repre-sent the opinions or policy of the partners or the Center for Retirement Research at Boston College.
The Center for Retirement Research thanks AARP, AIM Investments, Bank of America, Deloitte Consulting LLP, ING, John Hancock, MetLife, Nationwide Mutual Insurance Company, Prudential Financial, State Street, TIAA-CREF Institute, and T. Rowe Price for support of this project.