Internet technology holds the potential to funda-mentally change banks and the banking industry. For individual banks, the Internet may “level the playing field” by allowing all banks to easily offer innovative products and access new customers. But a bank that adopts Internet banking must develop different methods of conducting business, methods that may introduce new risks to the bank. For the banking industry, the Internet introduces competi-tive pressures that may bring significant changes. An extreme view speculates that the Internet will destroy old models of how bank services are devel-oped and delivered. Whether or not this extreme view proves correct, most observers expect that the Internet will have a profound influence on the banking industry.1
It is therefore important for bankers, bank super-visors, and policymakers to understand how Inter-net banking affects the performance of banks. The main goal of this study is to determine whether banks have carefully introduced Internet banking to their markets, and whether they have been helped or harmed by their early commitment to a new and relatively untested technology. To reach this goal, this article explores three interrelated questions. Has Internet banking been introduced into markets that will facilitate customer acceptance? Is the use of the Internet consistent with the business strategy of banks? Are performance measures, such as expenses, profitability, or risk, better or worse among banks that have adopted Internet banking compared to those that have not?
To answer these questions, I present in this arti-cle an analysis of a sample of banks that are located
Richard J. Sullivan
Richard J. Sullivan is an economist in the Division of Supervision and Risk Management of the Federal Reserve Bank of Kansas City. The author thanks Nancy Novack and Kevin King, who provided some of the data used in this study, and many members of the Division of Supervision and Risk Management for help in reviewing bank Web sites. The article has greatly benefited from presentations at the Federal Reserve Bank of St. Louis, the Federal Reserve Bank of Chicago, and Colorado State University. The views expressed in this article are those of the author and do not necessarily reflect those of the Federal Reserve Bank of Kansas City or of the Federal Reserve System.
How Has the Adoption of Internet Banking
Affected Performance and Risk in Banks?
A Look at Internet Banking
in Tenth Federal Reserve District states.2Results show that Internet banking has been introduced into markets with characteristics, such as a highly educated population, that may increase the likeli-hood of customer acceptance. In addition, the busi-ness strategy of banks (as revealed on their financial reports) is consistent with the type of functions offered on their Web sites. Some non-interest expenses of banks that offer Internet banking are relatively high, which may reflect the start-up costs of Internet operations, but these expenses have not translated into lower profits. In general, banks with transactional Web sites do not appear to be more risky than other banks. One type of bank that appears to have performance difficulties with Inter-net banking is recently opened banks. The sample also reveals that community banks, especially those in rural areas, have had little involvement in Inter-net banking.
After first describing Internet banking in Tenth District states, I discuss characteristics of markets into which Internet banking has been introduced. I next consider business strategy by comparing the sources of income and funding, and loan mix of banks with and without Internet banking. Subse-quently, I review performance of banks with Inter-net operations, analyzing expenses, profitability and risk, and in the final section offer a summary and conclusion.
INTERNET BANKING
IN THE TENTH DISTRICT
Banks began offering services through the Inter-net in 1995. Although the spread of InterInter-net bank-ing has been slower than most observers expected, expansion has been steady. In the Tenth District, banks have adopted Internet banking at rates that are similar to the rest of the United States. As else-where, adoption rates among community banks lag rates for other types of banks. Bank characteristics, such as size of the bank, affect the type of services that they offer on the Internet. Because bank char-acteristics differ from state to state, adoption rates also differ from state to state.
Chart 1
Adoption Rates for Bank Web Sites
Across Tenth District States
First Quarter 2000
Source: Federal Reserve Bank of Kansas City
60 50 40 30 20 10 0
Percentage of Commercial Banks
CO WY NM NE MO OK KS
Web Site Transactional Web Site
Table 1
Definitions for Type of Bank
Definition*
Type of Bank Organization Assets** Bank Assets Community Bank $1 billion $150 million
or less or less
Large Community Bank $1 billion More than or less $150 million Regional Bank More than $150 million
$1 billion or less
Large Regional Bank More than More than $1 billion $150 million
* Based on assets as of year-end 1999.
** A bank’s organization is either the bank holding company, or if the bank is independent, the bank itself.
This section of the article reviews these develop-ments for the Tenth District. It also more precisely defines Internet banking and explains how the banks in the sample are divided into groups that help to provide meaningful comparisons of the per-formance of banks that adopt Internet bank with those that do not.
The simplest bank Web site provides informa-tion such as branch locainforma-tions and product descrip-tions. More advanced Web sites may offer a number of interactive services, such as financial calculators, loan or deposit applications, access to account bal-ances, and bill payment. Of particular interest is whether a bank’s customer can initiate transactions through the Internet. A Web site that allows online transactions represents a greater commitment of a bank’s resources to the Internet. In addition, it exposes a bank to risk by allowing outside access to the bank’s computer network and by introducing changes to its methods of operation.
The most basic types of online transactions are interaccount transfers, such as moving funds from a savings account to a checking account, or making a loan payment from a checking account. A transac-tional Web site is an Internet Web site of a bank that allows the customer, at minimum, to initiate interaccount transfers. An Internet bank is a bank that offers a transactional Web site. Note that an Internet bank is not the same as an Internet-only bank. In the United States there are a handful of Internet-only banks, which are distinguished by a lack of physical branches. At the time this article was prepared, however, no Internet-only bank was located in any Tenth District state.3Consequently, the following analysis will focus on Internet banks that offer services through physical branches as well as through the Internet.
In the first quarter of 2000, 504 banks in Tenth District states had Web sites, of which 211 allowed transactions to be initiated through the Internet (details on sources for bank Internet addresses and other details on data used in this study are given in the appendix). Banks in Tenth District states have adopted transactional Web site technology at a rate that is similar to the national adoption rate. The 211 Internet banks represent 13 percent of
com-mercial banks in Tenth District states at year-end 1999. Unpublished estimates by the FDIC suggest that, at the same point in time, 13.2 percent of insured banks and thrifts in the United States offered transactional Web sites.
Although the overall adoption rate for Internet banking in Tenth District states is similar to the national rate, adoption rates across individual Tenth District states are not uniform. Adoption rates for transactional Web sites are highest in Colorado, New Mexico and Wyoming, and are lowest for banks in states in the eastern portion of the Tenth District (Chart 1).
There are two technical matters to discuss before proceeding. First, newly formed banks, known as de novobanks, have performance records that are con-siderably different from seasoned banks.4To reduce distortions when comparing performance measures of Internet and non-internet banks, most of the analysis that follows excludes 27 banks less than two years old (10 Internet and 17 non-internet banks). A separate section below will compare the perform-ance of Internet and non-internet banks among
de novocommunity banks.
Second, sample banks are divided into four groups, based on the size of the bank and the size of the organization to which the bank belongs (a banking organization is either a bank holding com-pany, or if the bank is independent, the bank itself). This division is in line with the structure of bank-ing in the Tenth District. It also allows easier com-parison with banks outside the region. Most important, because bank size and organizational characteristics influence both business strategy and performance, it allows more meaningful compar-isons of Internet and non-internet banks.
Banks are divided into four types: Community Banks, Large Community Banks, Regional Banks, and Large Regional Banks. Table 1 summarizes the definitions of these groups, and Box 1 provides information about their size and composition as well as additional discussion about this division of the sample.
Bank size and organizational characteristics influ-ence adoption rates. The 201 Internet banks in the sample average $649.9 million in assets, compared
to $81.2 million for non-internet banks (Table 3), and Internet banks are larger, on average, in all of the bank categories. Adoption rates across the groups of banks are not uniform. The adoption rate is as high as 75.9 percent for Large Regional Banks. The rate is lower for other types of banks, falling to as low as 4.2 percent for Community Banks. Com-munity Banks in rural areas (outside a metropolitan statistical area) have an even lower adoption rate— only 3.4 percent.5
Web site functionality is also related to the type of bank served by the site (Chart 2). In general, larger banking organizations offer more functions on their Web sites. Part of this difference reflects the fact that larger organizations tend to have more experience on the Web, and over time, have increased functionality to make their sites more attractive for users. In the case of online credit card applications, this may indicate differences in under-lying business strategy, because larger banking organizations are more likely to have credit card operations.
Online corporate cash management (where busi-nesses use the Internet to manage their bank bal-ances) has been a growth area. The service is available on roughly 20 percent of the transactional
Box 1
Why Define Four Groups of Banks?
The banks in this study are grouped into four categories because it gives a cleaner basis for comparison, allows easier extrapolation to banks outside the Tenth District, and reflects the structure of banking in the Tenth District.
Studies have shown that bank performance differs
significantly across bank size and organizational characteristics. For example, profitability and efficiency depend on the size of the bank. In addition, the business strategy of a bank can be strongly influenced by a large holding company. The four groups of banks in this study help to control for the influence of size and organization on performance and therefore provide a more valid comparison of the strategy and performance of banks that offer Internet services with those that do not.
While this sample is relatively large, it does not necessarily reflect the structure of banking in other parts of the United States. By grouping the sample by asset and organizational size, it may be easier to understand how Internet banking might influence banks in other regions. For example, results for the Regional and Large Regional Banks may be most relevant to areas that are dominated by larger banks.
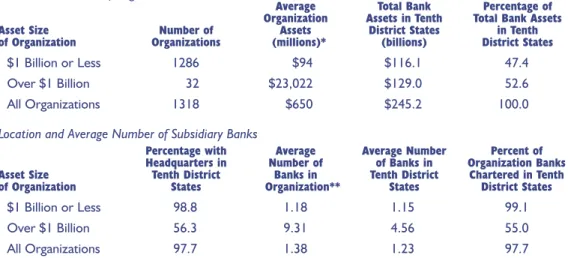
The groups of banks used for analysis in this study reflect the structure of banking in Tenth District states. With 1286 organizations, banking organizations with $1 billion or less in assets predominate (Table 2, Panel A). They are small, noncomplex organizations, with average organization assets of $94 million and an average of 1.18 banks in the organization. They are also local organizations, with 98.8 percent
headquartered in Tenth District states and an average of 99.1 percent of the organization’s banks chartered in Tenth District states. Despite their small average size, these banking
organizations are an important force in the region’s banking market because they control 47.4 percent of the assets of banks chartered in Tenth District states.
The complexity and non-local character of banking organizations with over $1 billion in assets is evident in Table 2. They average $23,022 million in assets and 9.31 banks per organization. Only 56.3 percent have headquarters in Tenth District States, and only 55 percent of their banks are located in Tenth District states. While few in number (32
organizations), these large organizations control 52.6 percent of the assets of banks chartered in Tenth District states.
Banks within each organization are further classified by those larger and smaller than $150 million in assets (Table 2, Panel B). With 1306 Community Banks at an average asset size
of $50.1 million, this subdivision reveals the importance of smaller banks to the Tenth District.
The bank (rather than the banking organization) is the focus of this study. Demographic, market, and economic data are most meaningful at the bank level because markets are difficult to define for large banking organizations. More important, in the Tenth District, most bank organizations with multiple banks are deploying Internet banking at the bank level. There are 32 banking organizations with more than one bank in Tenth District states and who have at least one bank with Internet banking (not shown in Table 2). But only eight of these organizations offer Internet banking at all of their Tenth District banks. The remaining 24 organizations average six banks in the region, and offer Internet banking at an average of 53 percent of their Tenth District banks.
Web sites of banks in the region, while it was available on only five percent one year ear-lier. This growth may reflect recognition by banks that business customers—especially small businesses—can be particularly active users of online banking services and, if using online banking serv-ices, are among the bank’s more profitable customers.6
With only about one-half of transactional Web sites soliciting loans or deposits online, the region’s bankers appear to be cautious in using the Internet to acquire new customers. Online loan or deposit applications may be lag-ging because it is a fea-ture that bankers may add after their transac-tional site is operatransac-tional. Alternatively, risk-averse bankers may be slow to add this feature due to the difficulty of con-firming the identity of
new Internet customers. While banks may be gener-ally reticent with online applications, one group of banks has been aggressive in using the Internet to solicit loans and deposits. At least 70 percent of Regional Bank Web sites offer online deposit or loan applications, suggesting that for these banks the advantages of obtaining new customers through the Internet outweigh the disadvantages.
Different adoption rates for Internet banking across Tenth District states and types of banks are driven by a number of factors, such as the
demo-graphic composition of potential users of the service and characteristics of the banking market. The next section of the paper discusses these factors.
DEMOGRAPHIC AND
MARKET CHARACTERISTICS
Do banks consider characteristics of the market when they provide online services? Demographic, economic, and competitive characteristics of mar-kets into which banks have introduced Internet
Table 2
Sample Information
A. Characteristics of Organizations with Bank Charters Located in Tenth District States
Year-end 1999
Assets and Number of Organizations
Average Total Bank Percentage of Organization Assets in Tenth Total Bank Assets
Asset Size Number of Assets District States in Tenth
of Organization Organizations (millions)* (billions) District States
$1 Billion or Less 1286 $94 $116.1 47.4
Over $1 Billion 32 $23,022 $129.0 52.6
All Organizations 1318 $650 $245.2 100.0
Location and Average Number of Subsidiary Banks
Percentage with Average Average Number Percent of Headquarters in Number of of Banks in Organization Banks Asset Size Tenth District Banks in Tenth District Chartered in Tenth of Organization States Organization** States District States
$1 Billion or Less 98.8 1.18 1.15 99.1
Over $1 Billion 56.3 9.31 4.56 55.0
All Organizations 97.7 1.38 1.23 97.7
*Includes bank and bank organization assets in and out of Tenth District states. **Includes banks whose charter is in or out of Tenth District states.
B. Total Number and Average Assets of Banks by Type of Bank
Year-end 1999
Asset Size Number Average Assets
Type of Bank of Organization Asset Size of Bank of Banks* (millions)* Community Bank $1 Billion or Less $150 Million or Less 1306 $50.1 Large Community Bank $1 Billion or Less Over $150 Million 169 $299.7 Regional Bank Over $1 Billion $150 Million or Less 55 $73.0 Large Regional Bank Over $1 Billion Over $150 Million 88 $1,420.7
All Banks 1618 $151.5
*Banks whose charter is located in Tenth District states. Includes seasoned (age 2 or older) and de novo (under age 2) banks. Excludes banker’s banks and trust companies.
banking do suggest that banks have been careful to launch the product into markets that are favorable to customer acceptance.7
Success with Internet banking depends upon generating online transactions. A bank can generate a large number of Internet transactions if it has a sizeable customer base, a high participation rate among its customers, and customers who actively use the system.8For example, recent analyses of Internet usage suggests that visitors to the World Wide Web tend to be in urban areas and have rela-tively high incomes.9In addition, a large proportion of Internet users is in the 25 to 54 year age group.10 It also seems reasonable to assume that markets with a highly-educated population is more likely to have customers that will bank through the Internet.
Another important factor that a bank may consider in its adoption decision is the competitive situation in its banking market. In the early stage of introduction there is considerable uncertainty about the demand for a new product. Some analysts have argued that this uncertainty will make it most likely that banks that dominate their market will be among the first to introduce Internet banking.11These banks are more able to absorb the cost of introducing and developing the product, while smaller banks will make the investment in Internet technology after they are more certain of the demand for the product.
Demographic characteristics. For Community Banks, markets of Internet banks are more likely to be urban. For all four of the groups of banks, per capita income is about the same in markets of Internet and
non-inter-Table 3
Adoption Rates and Size of Internet Banks*
Banks Aged Two or Older
Number Adoption Average Assets
Type of Bank of Banks Rate** (millions)
Community Internet 54 4.2 $79.2 Bank Non-internet 1231 $49.2† Large Internet 51 30.2 $352.2 Community Non-internet 118 $277.0‡ Bank Regional Internet 30 60.0 $81.1 Bank Non-internet 20 $69.2 Large Internet 66 75.9 $1,605.2 Regional Non-internet 21 $868.6§ Bank
All Banks Internet 201
12.6 $649.9
Non-internet 1390 $81.2†
*Internet banks are defined as those that have transactional Web sites as of the First Quarter 2000. Assets are as of year-end 1999. Sample includes commercial banks who have charters located in Tenth District states. Boldfaceindicates a statistically significant difference between non-internet and Internet banks. **Internet banks as a percentage of all banks in the category.
†,‡,§Non-internet and Internet banks do not have the same average value in statistical tests (t-tests) at a 1%, 5%, or 10% significance level.
Table 4
Demographic and Economic Characteristics of Markets
for Internet and Non-Internet Banks*
Population Age 25 or Older
Percent in Income With College
Urban Areas Per Person Age 18 Enrolled Degree
Type of Bank (1999) (1997) to 64 in College (Percent, 1990)
Community Internet 37.0 $21,143 58.3 6.4 16.7 Bank Non-internet 20.9‡ $20,360 56.5† 5.4‡ 14.8‡ Large Internet 62.7 $23,964 61.2 8.3 22.4 Community Non-internet 54.2 $22,942 59.8† 6.8§ 18.6† Bank Regional Internet 43.3 $22,688 59.9 6.4 19.7 Bank Non-internet 35.0 $22,290 57.0 6.2 17.7 Large Internet 69.7 $25,712 62.6 8.3 24.1 Regional Non-internet 76.2 $24,026 60.2‡ 6.6§ 19.9‡ Bank
*Internet banks are defined as those that have transactional Web sites as of the First Quarter 2000. Sample includes commercial banks who have charters located in Tenth District states. The market is defined as the county or metropolitan statistical area (MSA) in which the bank is located. Urban indicates that the bank is in an MSA.
Boldfaceindicates a statistically significant difference between non-internet and Internet banks.
†,‡,§Non-internet and Internet banks do not have the same average value in statistical tests (t-tests) at a 1%, 5%, or 10% significance level.
Sources: Urban location from Federal Reserve System’s National Information Center database; per capita income from the Bureau of Economic Analysis’ Regional Economic Information System; population and schooling information from the Census Bureau’s USA Counties database.
Percent of Total Population (1990)
net banks. But markets of Internet banks have more of their population in the 18 to 64 age group and have a more highly educated population, compared to the markets of non-internet banks.
Other than in the Community Bank category, the percentages of banks in urban areas are similar within each of the groups of banks (Table 4). This may be because most Large Community Banks and Large Regional Banks are primarily located in urban areas and therefore urban location has little information to distinguish between Internet and non-internet banks. Urban location is important among Community Banks. In the Community Bank category, 37.0 per-cent of Internet banks are in urban areas, compared to 20.9 percent for non-internet banks.
Interestingly, this sample suggests that income per person is not tied to whether a bank offers Internet banking. The average 1997 income per person in the markets of Internet banks is similar to that of non-internet banks across each of the bank categories.
By contrast, age and educational attainment are tied to the likelihood that a bank offers Internet banking. In 1990 (the most recent year for which data are available) and for every type of bank cate-gory, markets of Internet banks had a greater per-centage of their population in the 18 to 64 year old age group compared to markets of non-internet banks. Data for 1990 also confirm that the markets of Internet banks have higher portions of their pop-ulation enrolled in colleges and higher percentages of their adult population with college degrees.
Market characteristics. Competitive factors appear to affect the decision to adopt Internet banking, but only for Large Regional Banks in urban markets (Table 5).12Large Regional Banks that offer Internet banking in urban markets have an average market share of 10.8 percent, compared to only 3.8 percent for non-internet banks. More-over, these Internet banks operate in less competi-tive markets: the market concentration index for the markets of Large Regional Banks with Internet banking averages 1170, compared to 900 for their non-internet counterparts.13For other banks in the sample, there is little difference in market share and concentration between Internet and non-internet
banks. It is the large, urban banks in this sample that favor market dominance before introducing Internet banking.
The apparent lack of a relation between market conditions and adoption of Internet banking among other types of banks and in rural markets may be because banks in these markets waited until after the initial wave of adoption of Internet banking. If uncertainty about demand became less important, there would be less of a relation between competitive conditions and the adoption of Internet banking.
Chart 2
Functionality of Web Sites for Banks that Offer
Transactional Internet Banking*
Percentage of Transactional Web Sites That Offer Other Services
1—Online Loan Application 2—Online Credit Card Application 3—Online Deposit Application
4—Online Corporate Cash Management 5—Online Bill Payment
*Percentages are relative to the banks that offer transactional Web sites for each category of banks (54 Community Banks, 51 Large Community Banks, 30 Regional Banks, and 66 Large Regional Banks). A transactional Web site allows the customer, at minimum, to initiate through the Internet transfers of funds across deposit and loan accounts within the bank. Web sites that offer interaccount transfers also allow online access to account balances. Data are for the First Quarter 2000.
Source: Federal Reserve Bank of Kansas City
100
80
60
40
20
0
Community Bank Large Community BankRegional Bank Large Regional Bank
FUNDING, INCOME,
AND LENDING CHARACTERISTICS
A crucial issue for a bank is whether adoption of Internet banking will contribute to the success of the bank. To ensure success, a bank should use the Internet to complement other business strategies. Analysis of sources of funding and income, as well as lending portfolios, show that the business strate-gies of Internet banks are consistent with how these banks use the Internet to deliver services.
Sources of funding and income. By installing Internet banking early relative to other banks, Inter-net banks have demonstrated a willingness to adopt non-traditional business practices. The region’s Internet banks also fund more of their assets from non-traditional sources, such as Federal funds (Chart 3A). Many banks participate to some degree in the Federal funds market, but it is the Internet banks that take most advantage of this source of funds. Internet banks in the Regional and Large Regional Bank categories use Federal funds to the greatest extent, and the functionality of their Web
sites is consistent with their use of non-tradi-tional funding sources, as revealed in Chart 2, because Regional and Large Regional Banks are also most likely to offer online deposit applications.
Internet banks in the region also rely more heavily on non-tradi-tional sources of income (Chart 3B). For exam-ple, among Large Regional Banks, non-interest income was 26.2 percent of net operating revenue for Internet banks, com-pared to 16.4 percent for non-internet banks, a difference of almost 10 percentage points. Other than Regional Banks, this difference was statis-tically significant across all types of banks in the study.
Many banks view Internet banking as attractive because of its potential to generate non-interest income through fees. At this point, however, it is unclear that fees generated through Internet bank-ing are directly responsible for differences in non-interest income between Internet and non-internet banks. Most banks do not charge a fee for simple access to account balances and interaccount trans-fers. Fees are typically charged for online bill pay-ment, but these fees are unlikely to completely explain differences in non-interest income because only a fraction of bank customers use online bill payment. Moreover, many banks wave this fee if a customer maintains a minimum balance. Therefore, the willingness to develop non-interest sources of income and also offer Internet banking may simply be an indication of an inclination to develop non-traditional bank business.
Lending strategy. A key aspect of managing a bank is lending strategy. Data suggest that lending
Table 5
Market Share and Concentration for Internet and Non-Internet Banks*
June 30, 1999
Market Market
Share Market Share Market
Type of Bank (percent) Concentration** (percent) Concentration**
Community Internet 1.0 1027 26.2 2942 Bank Non-internet 1.1 1042 21.6 2739 Large Internet 6.0 1180 37.3 3104 Community Non-internet 4.0 1145 32.8 2647 Bank Regional Internet 0.9 1021 24.3 2521 Bank Non-internet 1.6 1075 25.1 2428 Large Internet 10.8 1170 32.9 2605 Regional Non-internet 3.8† 900§ 27.9 3174 Bank
*Internet banks are defined as those that have transactional Web sites as of the First Quarter 2000. Sample includes commercial banks who have charters located in Tenth District states. The market is defined as the county or metropolitan statistical area (MSA) in which the bank is located. Urban indicates that the bank is in an MSA.
Boldfaceindicates a statistically significant difference between non-internet and Internet banks.
**Measured using the Herfindahl-Hirschman Index. The concentration index is found by summing the squares of the percentages of market share for all banks and thrifts in the market, and has a maximum of 10000. A higher index indicates that the market is less competitive because it is concentrated among fewer banks and thrifts.
†,§Non-internet and Internet banks do not have the same average value in statistical tests (t-tests) at a 1% or 10% significance level.
Source: FDIC Survey of Deposits
strategies for Internet banks differ from that of non-internet banks, but the difference depends on the type of bank. Within the Community Bank and Large Regional Bank groups, the mix of loans made by Internet banks are consistent with their development of the Internet as a channel for delivering services.
Compared to non-internet banks, Internet banks in the Large Regional Bank category tend to have more of their loan portfolio in residential real estate and consumer loans and less in commercial real estate and construction loans (Table 6). This con-sumer orientation is consistent with the high adop-tion rates for retail Internet banking at these banks (Table 3).
Community Banks that offer Internet banking have proportions of their loan portfolio in commer-cial and industrial loans, commercommer-cial real estate loans, and construction loans that are higher, on average, than the proportions found in Community Banks that do not offer Internet banking. Commu-nity Banks that offer Internet banking appear to have a greater degree of specialization in business lending. Chart 2 showed that Community Banks are also more likely to offer online cash manage-ment services compared to Large Regional Banks. The Internet offerings of Community Banks may be part of a strategy aimed at protecting their base of business customers.
FINANCIAL PERFORMANCE
AND RISK
We have seen that banks who offer online bank-ing are dobank-ing so by introducbank-ing the product into markets that may encourage customer use and are using the Web to offer services that are consistent with the business strategy of the bank. But what about the effect of the adoption of Internet banking on the bank’s performance? A major concern is the effect on expenses and profitability: are these expenses significant, and do they hurt profitability of Internet banks? A second area of concern is risk. Do risk measures suggest that Internet banks bear more or less risk than non-internet banks? Com-pared to the non-internet banks in this sample, some expenses are higher at Internet banks, but
profitability is similar. Measures of risk are also sim-ilar for Internet and non-internet banks.
Chart 3
Sources of Funding and Income
for Internet and Non-Internet Banks*
Year-end 1999
A. Federal Funds as a Percentage of Assets
*Internet banks have transactional Web sites as of the First Quarter 2000. Sample includes commercial banks who have charters located in Tenth District states. **For Federal funds as a percentage of assets, non-internet and Internet banks do not have the same average value in statistical tests (t-tests) at least at a 10% significance level for Community Banks, Regional Banks, and Large Regional Banks. For non-interest income as a percentage of net operating revenue, non-internet and Internet banks do not have the same average value in statistical tests (t-tests) at least at a 10% significance level for Community Banks, Large Community Banks, and Large Regional Banks. *** Net operating revenue is interest and non-interest income minus interest expense.
Source: Call Reports
Internet Banks Non-internet Banks
10.0 7.5 5.0 2.5 0.0 Percent Community Banks** Regional Banks** Large Community Banks Large Regional Banks** Community Banks** Regional Banks Large Community Banks** Large Regional Banks** 30 20 10 0 Percent
Expenses. Compared to non-internet banks, Internet banks in the region have, on average, more non-interest expenses (Table 7). Among Commu-nity Banks, total noninterest expense as a percentage of net operating revenue (sometimes termed the “overhead ratio” or “efficiency ratio”) is 66.3 percent for Internet banks, slightly higher than the 65.8 per-cent for non-internet banks. The overhead ratio is also higher for Internet banks in the other categories of banks.
Much of the difference is accounted for in “other noninterest expense,” a category of expense that would include many of the costs associated with Web site development and promotion, such as soft-ware research and development expenses, amortiza-tion of purchased software, data processing costs, promotional expenses, and employee training. For example, among Large Regional Banks, “other non-interest expense” as a percentage of net operating revenue is 24.8 percent for Internet banks, com-pared to only 18.8 percent for non-internet banks. Among Community Banks, the difference in “other noninterest expense” as a percentage of net operating revenue for Internet and non-internet banks (21.7
versus 19.7 percent) is smaller than the differ-ence for Large Regional Banks. This result sug-gests that expenses for Internet banking may rise more than in pro-portion to the size of a bank, which is surpris-ing because if much of the installation costs of Internet banking are fixed, then they should not rise significantly for larger banks compared to smaller banks.
Although this exam-ination of “other non-interest expense” suggests significant added expense related to Internet banking, additional research will be necessary to confirm the effect. “Other noninterest expense” is a broad cate-gory, including many diverse expenses such as direc-tors fees, net losses on repossessed property,
management fees for parent bank holding compa-nies, office expenses, and so on. With this source of information we cannot directly observe the expenses of offering Internet banking services. On the other hand, much of the expenses associated with Web sites are likely incurred at the initial stages of devel-opment. Because the banks in this study are early adopters, it should not be surprising to see these added expenses in their financial data. The expense may diminish as banks gain more experience with Internet banking and eliminate the need for costly development.
Profitability. Added expenses do not necessarily translate into poor profits. Across the various bank categories, the average value of return on average assets is sometimes higher and sometimes lower for Internet banks compared to non-internet banks, but are very close in all cases (Table 7). Return on equity tends to be higher, on average, for Internet
Table 6
Loan Distribution for Internet and Non-Internet Banks*
Year-end 1999
Percent of Total Loans Commercial
Real Estate
Residential and Commercial
Type of Bank Real Estate Construction and Industrial Agricultural Consumer
Community Internet 25.0 18.8 18.6 21.5 13.5 Bank Non-internet 22.9 14.9‡ 15.0‡ 32.4‡ 13.8 Large Internet 25.0 33.9 20.5 6.3 11.3 Community Non-internet 24.1 30.8 19.0 12.2‡ 12.2 Bank Regional Internet 34.2 17.6 13.8 17.1 10.3 Bank Non-internet 24.8 14.6 17.4 20.0 20.0§ Large Internet 30.0 23.8 15.5 5.4 22.8 Regional Non-internet 14.1† 41.2† 23.6† 9.1 10.3† Bank
*Internet banks have transactional Web sites as of the First Quarter 2000. Sample includes commercial banks who have charters located in Tenth District states. Boldfaceindicates a statistically significant difference between non-internet and Internet banks.
†,‡,§Non-internet and Internet banks do not have the same average value in statistical tests (t-tests) at a 1%, 5%, or 10% significance level.
banks but statistical tests do not suggest that the difference is significant.
Why are added noninterest expenses not hurting profitabil-ity? If expenses are higher but profits are similar, then revenue at Internet banks must be higher. Chart 3 showed that Internet banks derive more of their income from noninter-est sources,
suggesting that they may be able to offset added expenses with fee income. The care with which banks have selected markets into which they have
intro-duced Internet banking may also contribute to gen-erating revenue.
Risk. Banks offering Internet banking are taking a risk by adopting the technology at an early stage of the product’s life cycle. They may also be willing to generally accept more risk compared to non-internet banks. However, measures of risk do not point to higher risk in Internet banks.
A major source of risk for banks is credit risk. One measure of credit risk is a bank’s loan-to-asset ratio: the more loans a bank makes, the more exposure it has to bad loans. In this sample, the loan-to-asset ratio is sim-ilar for Internet banks compared to non-internet banks (Table 8). The exception is Community Banks, where the ratio is significantly higher for Internet banks. Community Banks with transactional Web sites have an average loan-to-asset ratio of 65.3 percent, com-pared to 59.1 percent for non-internet banks.
Table 8 also shows another measure of credit risk, the noncurrent ratio, a measure of the bank’s experi-ence with nonperforming loans.14Compared to non-internet banks, the noncurrent ratio is the same or
lower at Internet banks. Internet banks do not appear to take on more risk in their lending activities.
Additional measures of risk are the assessments of bank examiners, reflected in the ratings they give in bank examinations (Box 2 discusses state and federal banking agency examination procedures for electronic banking).15Table 8 presents average examination ratings, and in general, they are similar between Internet and non-internet banks. In only one case, the asset quality rating for Large Commu-nity Banks, is there a statistically significant differ-ence, and it favors Internet banks.
DE NOVO
COMMUNITY BANKS
Because the likelihood of difficulties and failure are highest in the early years of a bank’s existence, it is important to understand the performance of newly chartered banks.16The recent development of Internet banking implies a high potential for risk because of the limited experience that banks have with this technology. De novoInternet banks are particularly significant because the risk of Internet
Table 7
Expenses and Profitability for Internet and Non-Internet Banks*
Year-end 1999
Expense as a Percent of Net Operating Revenue**
Return on
Other Total Average Return on
Noninterest Noninterest Assets Equity
Type of Bank Expense Expense (percent) (percent)
Community Internet 21.7 66.3 1.08 12.6 Bank Non-internet 19.7‡ 65.8 1.11 11.5 Large Internet 19.9 62.9 1.26 15.8 Community Non-internet 19.6 60.4§ 1.23 14.0 Bank Regional Internet 28.5 70.4 0.84 11.7 Bank Non-internet 24.0 62.6 0.98 9.5 Large Internet 24.8 57.3 1.40 20.0 Regional Non-internet 18.8‡ 48.6‡ 1.55 15.7 Bank
*Internet banks have transactional Web sites as of the First Quarter 2000. Sample includes commercial banks who have charters located in Tenth District states. Boldfaceindicates a statistically significant difference between non-internet and Internet banks.
** Net operating revenue is interest and non-interest income minus interest expense.
‡,§Non-internet and Internet banks do not have the same average value in statistical tests (t-tests) at a 5% or 10% significance level.
banking may compound performance difficulties that a newly chartered bank might face.
Analysis of de novobanks must always be quali-fied because it is difficult to characterize perform-ance of de novobanks. Most important,
performance of newly chartered banks is highly volatile in the early years of their existence. The small number of new banks also hampers analysis because in a small sample performance statistics can be strongly influenced by differences in location, business strategy, growth, and so on. With these qualifications in mind, this section presents an ini-tial look at non-interest expenses and profitability of Internet and non-internet de novo banks.
At the end of 1999 there were 27 commercial banks in Tenth District states aged two or younger, but only six of them are outside of the Community Bank category. To ensure a sufficient sample size, this section only considers the 21 de novo Commu-nity Banks. Of the 21, five are Internet banks and 16 are non-internet banks. The overhead ratio and return on average assets for these banks are pre-sented in Chart 4. For reference purposes, the over-head ratio and return on average assets for seasoned (over age two) community banks are also presented.
As expected, non-interest expenses are much higher and returns on average assets are much lower at de novo banks compared to seasoned banks. The disparity is greatest, however, among the de novo
banks that are also Internet banks. Further research is required to determine the extent to which these performance differences are due to expenses related to Internet operations. But, subject to the qualifica-tions given above, it appears that installing Internet banking in a newly chartered bank is particularly burdensome.
CONCLUSION
Analysis of a sample of banks from Tenth Dis-trict states reveals that banks have been careful in choosing markets for Internet banking, and that in general banks have been neither helped nor harmed by their early commitment to the Internet as a delivery channel. Specifically:
• Some expenses in Tenth District banks that
Box 2
Examination of the Internet Operations of Banks
Federal and state banking agencies have developed examination procedures for electronic banking. The review primarily aims to determine whether the bank has taken appropriate steps to control risk in electronic banking and whether banks are complying with relevant laws and regulations.
Commercial bank examiners or information technology specialists evaluate safety and soundness issues within a risk-focused framework. For example, electronic banking will likely be reviewed in detail if it has been newly implemented or if there have been significant changes in the e-banking system since the last bank exam. The major items subject to review are: • Board oversight and strategic planning;
• Appropriate policies and procedures;
• Adequate internal controls, including internal and external audit;
• Attention to the unique security issues of electronic banking;
• Due diligence and oversight of vendors and outsourcing arrangements;
• Reporting systems that allow monitoring of electronic banking activity;
• Personnel with acceptable knowledge and technical skills. Consumer compliance specialists will review bank Web sites for compliance with laws and regulations, also within a risk-focused framework. The review aims to determine whether the compliance management program in a bank has been updated to control the compliance risks of electronic banking. Because rules and regulations regarding print advertisement are applicable to pages on the World Wide Web, one major area of review is how product and service information is provided on the Web. For example, is terminology consistent with Truth in Savings or Truth in Lending requirements? A second area of review concerns information on the Web site about deposit products, to determine if disclosures are adequate and whether appropriate logos are displayed, such as the logo for FDIC insurance. A third area of review concerns lending products, again to determine if disclosures and logos are adequate, and, if the Web site accepts online loan applications, that they comply with laws on equal credit opportunity.
Finally, recent legislation addresses the unique aspect of conducting financial transactions electronically, and banks are
have adopted Internet banking are signifi-cantly higher compared to other banks. High expenses have not hurt profit performance: measures of profitability for Internet banks are similar to those of non-internet banks. • Internet banks appear to be successful at
gen-erating sufficient revenue, such as fee income, to overcome additional expenses. One contribution to this success is care in choosing where to deploy Internet banking. Banks have first introduced the product into markets with demographic and economic characteristics that help to ensure customer acceptance.
• Internet banks have also achieved success by using the Internet in a way that comple-ments their business strategy. Internet banks rely on non-core funding and are developing the Internet to tap another non-traditional source of funds. Large banking organizations in the region have a strong retail orientation, and they have tailored their Internet offerings to appeal to retail customers. Community Banks have a busi-ness orientation and offer online services that appeal to their business customers. • The performance of de novo community
banks who also adopt Internet banking is poor relative to other de novo banks. There are several reasons to interpret these results with caution. First, the “early adopters” of Internet banking have relatively little experience with the technology, and over time, their performance meas-ures may change.17Second, results may not be rele-vant for “later adopters” of Internet banking because their underlying characteristics may differ from early adopters. Moreover, technology and cus-tomer acceptance of the product will change with time. Third, the tabular analysis used in the study has inherent limitations, such as a limited ability to account for other factors that might explain differ-ences between Internet and non-internet banks. Other approaches may yield different results. Fourth, available risk measures may not capture the types of risk banks are exposed to with Internet banking, such as security or operational risks. It is therefore uncertain that Internet banks are no more risky than non-internet banks.
Box 2 (continued)
required to update their policies and procedures to ensure compliance. The Gramm-Leach-Bliley Act of 1999 contains provisions that require banks to develop an information security program to protect the information they collect on their customers. It also requires banks to develop and disclose privacy policies. A second act, the Electronic Signatures in Global and National Commerce Act of 2000, provides that no contract, signature or record shall be denied legally binding status just because it is in electronic form. This act will
facilitate online transactions, but also has implications regarding disclosure requirements for financial products. Regulatory agencies are currently evaluating the implication of this
legislation and are updating regulatory and supervisory policies. For links to regulatory guidance on electronic banking, visit the Electronic Banking page on the Web site of the Federal Reserve Bank of Kansas City at www.kc.frb.org/BS&S/Ebanking.htm.
Chart 4
Overhead Ratio and Profitability
for Internet and Non-Internet Banks
De Novo and Seasoned Community Banks*
Overhead Ratio
(Non-Interest Expense / Profitability Net Operating Revenue)** (Return on Average Assets)
*There are 21 de novo community banks in the sample, of which 5 are Internet banks and 16 are non-internet banks.
**Net operating revenue is interest plus non-interest income minus interest expense.
2 1.5 1 0.5 0 Ratio Banks Age 2 or Younger Banks Over Age 2 Banks Age 2 or Younger Banks Over Age 2
Internet Banks Non-Internet Banks
2 1 0 -1 -2 -3 Percent
Internet banking is new and changing rapidly, and therefore results of empirical studies on Internet banking may vary considerably with different sam-ples and methods of analysis. Box 3 compares the results of this study with those of previous research on Internet banking.
Finally, community banks, especially in rural areas, have lagged behind other banks in adopting Internet banking. On one hand, this could be a posi-tive sign because results of this study suggest that community banks may be wise to go slow in adopt-ing Internet bankadopt-ing. Their markets may not be favorable to customer acceptance of Internet bank-ing, and installing Internet banking may significantly increase the bank’s expenses. Furthermore, at this time, there is little evidence that Internet banking will increase the profitability of community banks.
On the other hand, it is unclear that the costs of adopting Internet banking will fall to the point of being affordable to a large portion of community banks. The expense of Internet banking technology may be a
sig-nificant barrier to some community banks.18
Internet banking holds the promise of “leveling the playing field” by allowing banks to compete across a wider geo-graphic area and by allowing all banks to offer their customers the latest in banking technology. It is worth-while monitoring com-munity banks in the future to determine whether or not they adopt Internet bank-ing. If not, community bank customers may be denied the opportu-nity to fully participate in the Internet revolu-tion, and community banks themselves may be at a significant competitive disadvantage.
APPENDIX
Information on Sample Data
and Variable Definitions
Banking Web sites. Several sources were used to identify the Internet addresses of banks: the Bank Web Internet site, the Online Banking Report Internet site, Call Reports (which began collecting bank Internet addresses as of June 1999), an FDIC database on electronic banking, and the Web sites of the state banking associations in Oklahoma, Mis-souri, Kansas, and Nebraska. Although this data set may exclude some bank Web sites, it is likely a rea-sonably complete compilation of Web sites for banks in Tenth District states.
The functionality of the Web site was deter-mined by reviewing the Web sites. Personnel from the Federal Reserve Bank of Kansas City visited the
Table 8
Credit Risk and Examination Ratings for Internet and Non-Internet Banks
Year-end 1999
Average Examination Rating*** Loan-to- Noncurrent
Asset Ratio Ratio** Asset
Type of Bank (percent) (percent) Quality Earnings Management Composite
Community Internet 65.3 1.47 1.59 1.83 1.70 1.70 Bank Non-internet 59.1† 1.30 1.51 1.75 1.68 1.57 Large Internet 66.1 0.55 1.29 1.65 1.51 1.43 Community Non-internet 63.2 1.15† 1.49‡ 1.63 1.56 1.47 Bank Regional Internet 55.2 0.54 1.23 1.80 1.33 1.46 Bank Non-internet 59.3 0.64 1.30 1.70 1.50 1.40 Large Internet 57.3 0.75 1.30 1.58 1.44 1.39 Regional Non-internet 62.4 0.86 1.48 1.38 1.52 1.38 Bank
*Internet banks are defined as those that have transactional Web sites as of the First Quarter 2000. Sample includes commercial banks who have charters located in Tenth District states. Boldfaceindicates a statistically significant difference between non-internet and Internet banks.
**Loans 90 days past due plus non-accrual loans plus other real estate owned as a percentage of total loans plus other real estate owned.
***Ratings are on a five point scale, with the highest score equal to 1. Ratings are for the most recent exam as of 12/31/99. The composite score is a summary of ratings in six areas of evaluation: capital adequacy, asset quality, management, earnings, liquidity, and sensitivity to interest rate fluctuations.
†,‡Non-internet and Internet banks do not have the same average value in statistical tests (t-tests) at a 1% or 5% significance level.
Web sites and searched for specific services offered on the site. We reviewed 427 total Web sites and 144 transactional Web sites. The number of banks served by Web sites is greater than the number of sites because many multi-bank bank holding com-panies use a single Web site for several separately chartered banks.
Commercial banks in Tenth District states. The sample includes banks that are chartered in Tenth District states. Branches that operate in Tenth District states but are part of banks chartered elsewhere are excluded from the study. Pure trust companies, credit card banks, and banker’s banks were also excluded from the sample.
Though not necessarily representative of the largest banks in the United States, banks in the Tenth District do include a range of large, small, and medium size banks. Moreover, adoption rates of Internet banking are similar in the Tenth District compared to the nation. Consequently, experience of the sample’s banks with the Internet should be relevant beyond the Tenth District.
Other data. Financial data come from Call Reports. Data on urban location came from the Fed-eral Reserve System’s National Information Center database. Per capita income is from the Bureau of Economic Analysis’ Regional Economic Information System database, and population and schooling information from the Census Bureau’s USA Counties database. Market share and concentration are based on the FDIC’s Survey of Deposits for June 1999.
Definitions. An Internet bank operates a Web site that, at minimum, allows the customer to initi-ate an interaccount transfer on the Internet. All other banks are referred to as non-internet banks, but it is possible that a non-internet bank may operate a non-transactional Web site. Although there are several Internet-only banks in the United States, none of those banks are in the sample used in this study.
A bank organization is either a bank holding company or if a bank is independent (not part of a bank holding company), the bank itself.
A market is the metropolitan statistical area (MSA), or if not in an MSA, the county in which a bank is headquartered. Statistics for income per
per-Box 3
Research on Internet Banking
A second goal of this study is to determine if conclusions of previous research apply to banks in Tenth District states. Recently, analysts have begun to research the performance of banks that offer Internet banking. The most important study is by Furst, Lang, and Nolle, and this Box compares and contrasts their work with the findings in this article.*
There are several areas of agreement between this study and that of Furst, Lang, and Nolle. Both studies found that adoption rates depend on the size of the bank, with the smallest banks least likely to have adopted Internet banking. Both studies found that Internet banks are more willing to use Federal funds to finance their assets, and that Internet banks are more likely to derive their income from non-interest sources. Both studies also show that credit quality and exam ratings are the same or better among Internet banks.
There are differences between the two studies in findings for lending portfolios, expenses, and profitability. In this study, larger Internet banks hold fewer business loans compared to non-internet banks, while Furst, Lang, and Nolle find the opposite. Compared to non-internet banks, Internet banks in this study tend to have higher non-interest expenses, especially for the Large Regional Banks. Furst, Lang and Nolle find that non-interest expenses are higher for small Internet banks (under $100 million in assets) compared to non-internet banks. For larger banks in their study, non-interest expense is about the same for Internet and non-internet banks. Finally, in this study, profitability is similar for Internet and non-internet banks. Furst, Lang and Nolle found that, compared to non-internet banks, return on equity was lower for small Internet banks but was higher for larger Internet banks. Differences in samples and methods of analysis might account for some of the differences between these two studies. Furst, Lang, and Nolle use national banks for their sample, a sample that would contain some banks that are much larger than those in Tenth District states. These larger banks may have been among the first to adopt Internet banking, which implies more experience with the technology and potential for improved performance. Perhaps most important, the two studies use different methods to control for organizational characteristics. Furst, Lang, and Nolle stratify their sample by the size of the bank, while in this study, the sample is divided both by size of the bank and by size of the bank’s organization. Further research on Internet banking will help to resolve the differences between the two studies.
*Karen Furst, William W. Lang, and Daniel E. Nolle, "Who Offers Internet Banking?" Quarterly Journal, Office of the Comptroller of the Currency, 19(2), June 2000, pp. 27-46.
son are calculated by averaging data for the markets of all the Internet and non-internet banks. The same market may be counted in both averages because some markets contain both Internet and non-internet banks.
An urban location is defined as a location that is in an MSA.
Market concentration is based on share of deposits in a market. The concentration ratio is found by summing the squares of the percentages of market share for all banks and thrifts in the market. The higher the result, the more concentrated (less competitive) the market.
Net operating revenue is interest plus non-interest income minus interest expense.
The noncurrent ratio is defined as loans that are 90 days past due, plus non-accrual loans, plus other real estate owned as a percentage of the sum of total loans and other real estate owned. The noncurrent ratio accounts for other real estate owned because other real estate owned includes property repos-sessed on a foreclosed loan.
ENDNOTES
1 See, for example, Simon Long, “The Virtual Threat,”
Econo-mist,Survey of Online Finance, May 20, 2000, pp. 5-9. 2 The Tenth Federal Reserve District consists of Oklahoma,
Kansas, Nebraska, Wyoming, Colorado, western Missouri, and northern New Mexico.
3 “Net-Only Bank Watch: Six New Net-Only Banks Debut this Summer,” Online Banking Report, August 2000, pp. 20-24. 4 Robert DeYoung, “Birth, Growth, and Life or Death of
Newly Chartered Banks,” Federal Reserve Bank of Chicago
Economic Perspectives, Third Quarter 1999, pp. 18-35. 5 Not shown in Table 3. In the sample there are 1007
com-munity banks in rural areas.
6 Steve Weber, “Small Businesses Are Big Online-Banking Users,” Online Banking Newsletter 4(41), October 18, 1999, p. 1; “Study: Small Businesses Are Profitable,” Online Bank-ing Newsletter 5(24), June 19, 2000, p. 1.
7 A market is the metropolitan statistical area (MSA), or if not in an MSA, the county in which a bank is headquartered. 8 Industry norms for the share of demand deposit accounts
that will sign up for Internet banking is 5 to 10 percent, and for the number of participants that actively use the service is 30 to 80 percent. Laura Gatland, “Sign Up Is Not Enough,”
Financial Services Online, January/February 1999, p. 40.
See also John Engen, “Web-Savvy and Ridin’ High at ANB,”
FutureBanker, March 1999, pp. 44-45.
9 Amanda Lenhart, “Who’s Not Online,” Pew Internet and American Life Project, September 21, 2000 (63.210.24.35/reports/pdfs/Pew_Those_Not_
Online_Report.pdf) accessed on the Internet by the author on October 30, 2000; Anne Rickert, “The Dollar Divide: Web Usage Patterns by Household Income,” Media Metrix,
Inc., August 2000 (
www.mediametrix.com/data/MMXI-USHHI-0600.pdf) accessed on the Internet by the author on September 1, 2000.
10Media Metrix, “Age/Gender Demographics in May 1999
and May 2000,” (www.mediametrix.com/data/
archived_metrixcentral.jsp) accessed on the Internet by the author on September 1, 2000.
11Marsha Courchane and David Nickerson, “Strategic Real Options and Endogenous Market Structure In Electronic Banking,” working paper, Freddie Mac and Colorado State University, February 2000.
12Because of substantially different market characteristics in rural and urban locations, Table 6 separates the sample by location. 13Market concentration is based on share of deposits in a
market. The concentration ratio is found by summing the squares of the percentages of market share for all banks and thrifts in the market. The higher the result, the more con-centrated (less competitive) the market.
14The noncurrent ratio is defined as loans that are 90 days past due, plus non-accrual loans, plus other real estate owned as a percentage of the sum of total loans and other real estate owned. 15A recent study of electronic banking examinations found
weaknesses at many of the financial institutions that were examined (United States General Accounting Office, “Elec-tronic Banking: Enhancing Federal Oversight of Internet Banking Activities,” GAO/GGD-99-91). If significant, these weaknesses will be reflected in examination ratings.
16DeYoung 1999.
17Recent surveys of banks suggest that more than 54% of banks plan to adopt Internet banking in the next few years; see Furst, Lang, and Nolle, “Who Offers Internet Bank-ing?”, Quarterly Journal, Office of the Comptroller of the Currency 19(2), June 2000, p. 41, and Grant Thornton, “The Changing Community of Banking,” (www.grantthornton.com/resources/finance/ banksurvey2000/survey00_toc.html) accessed on the Internet by the author on April 28, 2000.
18Deborah Bach, “Internet Banking Profit Seen Harder For Small Banks,” American Banker, November 3, 2000, p. 10.