CLEAN DEVELOPMENT MECHANISM
PROJECT DESIGN DOCUMENT FORM (CDM-SSC-PDD)
Version 03 - in effect as of: 22 December 2006
CONTENTS
A.
General description of the small scale project activity
B.
Application of a baseline and monitoring methodology
C.
Duration of the project activity / crediting period
D.
Environmental impacts
E.
Stakeholders’ comments
Annexes
Annex 1: Contact information on participants in the proposed small scale project activity
Annex 2: Information regarding public funding
Annex 3: Baseline information
Annex 4: Monitoring Information
Annex 5: Financial analysis
Revision history of this document
Version
Number
Date
Description and reason of revision
01
21 January
2003
Initial adoption
02
8 July 2005
•
The Board agreed to revise the CDM SSC PDD to reflect
guidance and clarifications provided by the Board since
version 01 of this document.
•
As a consequence, the guidelines for completing CDM SSC
PDD have been revised accordingly to version 2. The latest
version can be found at
<
http://cdm.unfccc.int/Reference/Documents
>.
03
22 December
2006
•
The Board agreed to revise the CDM project design
document for small-scale activities (CDM-SSC-PDD), taking
into account CDM-PDD and CDM-NM.
SECTION A. General description of small-scale project activity
A.1
Title of the small-scale project activity:
Lean Biogas recovery from Palm Oil Mill Effluent (POME) ponds and biogas / biomass utilisation at
Exportadora del Atlántico, Lean/Honduras.
Version of the Document: 1
Date: December 18, 2007
A.2.
Description of the small-scale project activity:
Exportadora del Atlántico Lean is devoted to the extraction and refining of palm oil. Apart from the oil
press, its facilities include diverse industrial processes: Refining, fractionation, interesterification
process, biodiesel production and a fat and oil production plant. The Palm Oil Extraction Plant consumes
approx. 2,500 MWh/yr of electricity from the grid. The liquid effluents generated due to the fruit
processing amount to approx. 123,000 m
3/year (year 2008), with a Chemical Oxygen Demand (COD)
load of approx. 8,000 t/year
1. These effluents are presently led to a treatment system that consists of a set
of fat traps and 15 open lagoons. In these lagoons, anaerobic processes take place, which generate biogas
that is currently being emitted to the atmosphere. After passing the lagoons, the waste water is discharged
to a nearby river.
The planned CDM project activity will optimise the existing treatment system. The biogas will be
collected and used to generate electricity, which will partially be exported to the grid and partially be
used in the Palm Oil Extraction Plant. For doing so, a new biogas generator (two container units of
750 kW each) will be constructed.
To summarize, the project reduces greenhouse gas emissions (GHG) in the following ways:
by preventing methane emission through biogas capture,
by replacing electricity consumption from the grid by utilizing biogas, and
by replacing electricity consumption from the grid by utilizing biogas.
Contribution to sustainable development:
Besides reducing GHG emissions and helping to reduce Honduras’ dependence on fossil fuels, the
planned CDM project activity will improve the quality of the discharged water significantly by removing
organic matter from the effluent and by minimizing water pollutants such as oils, greases and particles.
Honduras has defined several indicators for sustainable development contributions
2, which are
summarised in the following table.
Type of SD
Criteria
Indicators
Contribution of proposed
CDM project
Job generation (training, use of local working force)
Training of personnel how to operate new plants,
Operation of new installations by local staff
Social responsibility Improvement of waste water
characteristics (discharge to the river) Formulation of education assistance programmes -- Formulation of environmental education programmes or strategies -- Social Sustainability Improvement of the populations’ quality of life
New education and health centres -- Reforestation programmes
(watersheds, nurseries), flora and fauna protection
--
Cleaner production technology transfers
Use of more efficient technology (energy and water consumption)
Implementation of modern waste water treatment system, Import of Belgian technology Greenhouse gas emissions
reduction Yes Environmental Sustainability Natural resource protection and environment
Adequate waste disposal (construction materials, etc)
Improvement of waste water characteristics (discharge to the river)
Technology transfer Yes, import of Belgian
technology Increase in Gross Domestic
Product in the area of influence --
Oil imports reduction --
Economic Sustainability
Local and national economic development
Mwh generated by the project and contribution of the energy supply to the community(ies)
Yes, export of renewable electricity to the grid.
Hence, the proposed CDM project activity contributes to the sustainable development of the host country
in numerous ways.
A.3.
Project participants:
The project will be implemented by Exportadora del Atlántico with its administrative office in
Tegicigalpa, Honduras.
Name of Party involved (*) ((host) indicates a host Party)
Private and/or public entity(ies) project participants (*)
(as applicable)
Kindly indicate if the Party involved wishes to be considered as project
participant (Yes/No)
Honduras
Private entity:
Exportadora del Atlántico No
United Kingdom Private entity: EDF Trading No
Honduras has ratified the Kyoto Protocol on 19/07/2000
The United Kingdom has ratified the Kyoto Protocol on 31/05/2002.
A.4.
Technical description of the small-scale project activity:
A.4.1. Location of the small-scale project activity:
The project site is located in the region El Astillero/Arizona, district Atlántida, approximately 20 km
southeast of the city of Téla (Honduras).
A.4.1.1.
Host Party(ies):
Honduras
A.4.1.2.
Region/State/Province etc.:
Region of El Astillero/Arizona, District Atlántida
A.4.1.3.
City/Town/Community etc:
Tela
A.4.1.4.
Details of physical location, including information allowing the
unique identification of this small-scale project activity :
Source: http://www.clas.ufl.edu/users/afburns/afrotrop/Honduras.jpg
Source: Google Earth (also: http://maps.google.de/maps?near=&q=map+tela%2C+honduras&f=p&btnG=Maps-Suche&rl=1)
A.4.2. Type and category(ies) and technology/measure of the small-scale project activity:
Categories and type of the planned CDM project activity:
The project activity belongs to the following categories as listed in the sectoral scopes
for accreditation
of the operational entities (http://cdm.unfccc.int/DOE/scopes.html):
Sectoral scope 13:
Waste handling and disposal.
Sectoral scope 1:
Energy industries (renewable- / non-renewable sources)
The project activity includes Type III (methane recovery) and Type I (electricity generation) elements of
the Small Scale CDM project categorisation.
Technology / measure of the planned CDM project activity:
1. Methane capture:
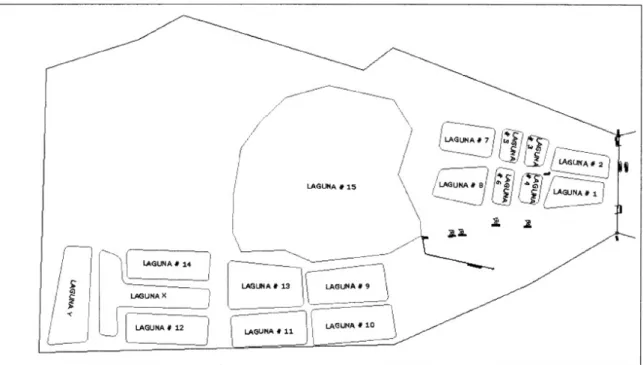
Currently, Lean’s wastewater treatment system consists of:
a 5-tank-recovery system for palm oil from the effluents from the centrifuges, grease traps, and
a set of 15 open lagoons, whose characteristics are shown in Figure 1. Without considering the
grease traps, the system has a total lagoon volume of approximately 56,000 m
3. The average
depth of the anaerobic lagoons 1-8 is 2.66 m; the average depth of the whole system is 2 m.
Figure 1: Current lagoon system at Lean.
incompacted clay and high density polyethylene geomembrane. The covered lagoons will have a volume
of 2 x 7,500 m
3and are expected to remove approximately 90% of the COD-load in the effluents.
Besides this, the following technical components will be constructed:
Component
Function and description
Cooling towers
Two operating units in parallel, used for reducing the temperature of
the affluent from 70
°
C to 40
°
C. With vertical flux, fed by encased
centrifugal pumps and stainless steel impeller.
Lagoon
impermeabilisation
HDPE geomembrane to avoid infiltrations (organic load losses),
phreatic water dilution, and pollution of possible subsurface water
bodies.
Sludge agitation and
drainage system
To mix and recirculate the sedimented sludge in both anaerobic
lagoons. Recirculating the sludges helps to digest them, and mixing
them prevents the filling up of the lagoons through sedimented sludge
compactation.
Auxiliary transformers
and electric system for
pumps and engines
Two units (approx. 150 kVA and 50 kVA) for feeding two engine load
centres in the anaerobic and facultative lagoons, respectively.
Lagoon covering
The cover for the lagoons will be made in flexible plastic material,
resistant to gas and weathering, and equipped with a system for
evacuating the rainwater that deposits in the surface. The cover surface
for each lagoon is approx. 4,000 m
3.
Biogas blowers
Transport of biogas; for a capacity of 900 m
3/hour.
Biogas conduction
For a maximum daily flow of 900 m
3/h, a conduction of 150 m is
projected, in PVC of 6” or 8” diameter. The system includes water
traps for the condensed water and various sampling points.
Biogas purification filters
The crude biogas contains approximately 0.2% (2,000 ppm) H2S. The
system considers a biologic depuration of this H2S, by means of
Thiobacillus bacteria. The depuration system consists of two parallel
sets for reducing H2S from 2,000 ppm (when leaving the lagoons) to
200 ppm. It also acts as humidity condenser.
Emergency generator
50 kVA diesel unit for the operation and starting of the system in case
of grid energy failures.
Flare
It is used for burning the excess biogas that cannot be used in any of
the components of the system, either for over-production or during
maintenance operations. The flare is open, with a flame trap and a
temperature flame detector.
Monitoring equipment and
instrumentation (SCADA
system)
Pressure meters (in “U” and electronic), biogas caudal meter,
thermometers (for effluents and biogas), pH-meters for the effluent,
contact sensors for the valves, biogas analyser (CH4, CO2, O2, H2S),
time meter in the press (extractor), blowers, compressors, cooling
tower vents, pumps, temperature flame detector. Includes PLC and
monitoring and reporting software located in control shack.
The technology will be provided Bio-Tech, a Belgium technology provider (also see section B.5 of this
document).
2. Renewable electricity generation:
A generator-system will be installed as an enclosed unit (40 feet container). This unit will comprise a
piston engine-generator, electric displays, radiators, oil tanks, electric control and power displays and
PLC. The new system will have an installed capacity of 1,500 kW (two units with 750 kW each). In
addition, a transformator (100kVA) and necessary interconnections to the electricity grid and on-site
demand point will be installed.
A.4.3
Estimated amount of emission reductions over the chosen crediting period:
Year Annual estim ation of emission reduc tions
[tons CO2 e] 1 (2008/2009) 26,855 2 (2009/2010) 26,588 3 (2010/2011) 26,052 4 (2011/2012) 25,660 5 (2012/2013) 25,071 6 (2013/2014) 24,750 7 (2014/2015) 23,644
Total estimated reductions
[tons CO2e] 178,620
Total number of crediting ye ars 7
Annual average ove r the crediting period of estimated reductions [tons
CO2e] 25,517
It may be noted that the decrease of emission reductions over time is due to increased production in the
Palm Oil Plant (due to increased harvest from palms according to the natural growth cycle) and
responding increase of wastewater volumes.
A.4.4. Public funding of the small-scale project activity:
Neither public funding nor official development assistance are used in the project activity. No loans from
international financial institutions (IFIs) are included. The financing will be realized by Exportadora del
Atlántico with a bank loan and the sale of generated CERs.
A.4.5. Confirmation that the small-scale project activity is not a debundled component of a
large scale project activity:
According to the CDM-regulations, a small-scale project activity shall be deemed to be a debundled
component of a large project activity if there is a registered small-scale CDM project activity or an
application to register another small-scale CDM project activity if all of the below conditions are
fulfilled:
Same project participants;
Same project category and technology/measure;
Registered within the previous 2 years; and
Project boundary is within 1 km of the project boundary of the proposed small-scale activity at
the closest point.
While there is another project seeking registration as a Small Scale CDM project by the same project
participants
3, the project cannot be considered as a debundled component of a larger project because the
project is located 165 km from the proposed project boundaries and thus is not within the above
mentioned range.
SECTION B. Application of a baseline and monitoring methodology
B.1.
Title and reference of the approved baseline and monitoring methodology applied to the
small-scale project activity:
1. Methane capture:
Approved Small Scale Methodology AMS III.H “Methane recovery in waste water treatment”,
Version 08, as of December 14
th, 2007 is applied.
2. Renewable electricity generation:
Approved Small Scale Methodology AMS I.D “Renewable Energy Generation for the Grid”,
Version 13 as of December 14
th, 2007 is applied. It refers to the “Tool to calculate the emission
factor for an electricity system” (Version 01).
B.2
Justification of the choice of the project category:
1. Methane capture:
The project activity fulfils the eligibility criteria of AMS III.H, as it complies with option (iv):
“Introduction of methane recovery and combustion to an existing anaerobic wastewater treatment
system such as anaerobic reactor, lagoon, septic tank or an on site industrial plant.
” The adaptation of
some of the existing lagoons as described in section A.4.3 has a similar purpose and effect as the
3
Aguan biogas recovery from Palm Oil Mill Effluent (POME) ponds and biogas / biomass utilisation at Exportadora del Atlántico, Aguan/Honduras.
construction of an anaerobic tank digester, as biogas emitted from the wastewater system will be
captured. In addition, resulting emission reductions are less than 60kt of CO2 per annum.
AMS III.H also specifies that a project activity can use a corresponding category under type I, if the
recovered methane is used for heat and or electricity generation. The latter is the case, and hence
AMS I.D will be applied in combination with the „Tool to calculate the emission factor for an electricity
system“.
2. Renewable electricity generation:
The project activity fulfils the eligibility criteria of AMS I.D, as a new renewable biomass plant will
supply electricity to and/or displace electricity from an electricity distribution system that is or would
have been supplied by at least one fossil fuel fired generating unit: the system will be connected to the
interconnected system of Honduras (managed by the national electricity provider ENEE) that is fed by
several fossil-fuel fired plants – also see Annex 3 of this document. In addition, the units added by the
CDM project activity are lower than 15 MW and are physically distinct from the existing units at the
project site.
B.3.
Description of the project boundary:
1. Methane capture:
AMS III.H specifies the project boundary as “the physical, geographical site where the wastewater and
sludge treatment takes place”. Included gases are CO2 and CH4. Emission sources are the untreated and
treated wastewater, final sludge, power consuming project activity facilities, the flare system, and treated
waste water effluent.
2. Renewable electricity generation:
AMS I.D specifies the project boundary as “
The physical, geographical site of the renewable energygeneration”. The i
ncluded gas is CO2. Emission sources are the technologies and/or fuels that would have
been used for power generation in the absence of the CDM project activity.
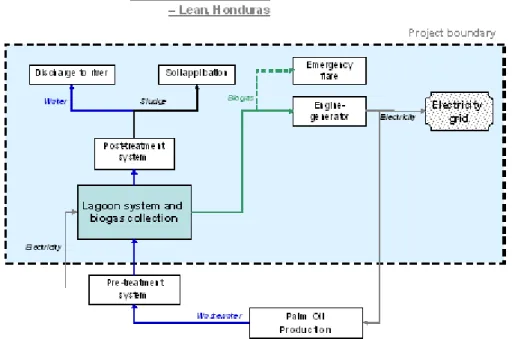
The project boundary is visualised in Figure 2.
Figure 2: Project boundaries of the planned CDM project activity.
B.4
.
Description of baseline and its development:
1. Methane capture (AMS III.H)
Honduran legislation does not require the capture of biogas from industrial waste water treatment
systems, nor is there any such legislation concerning the treatment of liquid or sludge by-products
produced through industrial activities. On the contrary, open lagoons have a low operational risk and are
the cheapest solution for the treatment of wastewater with regard to initial investments and operating
costs.
Since there is no applicable legislation for the capture of biogas, the baseline scenario can be identified
as continued operation of the existing wastewater treatment system – i.e. a situation in which methane
emissions from anaerobic processes are released to the atmosphere. The project activity will reduce
greenhouse gas emissions through the collection of biogas and thermal destruction of methane.
Project activity emissions consist of:
CO2 emissions on account of power used by the project activity facilities.
Methane emissions on account of inefficiency of the wastewater treatment and presence of
degradable organic carbon in treated wastewater;
Methane emissions from the decay of the final sludge generated by the treatment systems;
Methane fugitive emissions on account of inefficiencies in capture and flare systems;
Methane emissions resulting from dissolved methane in the treated wastewater effluent.
As no bottling of upgraded biogas occurs, these sections of AMS III.H do not apply and are neglected.
2. Renewable electricity generation (AMS I.D)
The baseline scenario - both for on-site electricity consumption and electricity export to the grid - is that
the respective amount of electricity would have been generated by power plants connected to the national
electricity grid. Hence, the baseline is
the amount of electricity produced by the renewable generating unit(MWh) multiplied by an emission coefficient (kg CO2e/MWh). This grid emissions factor is calculated in a
transparent and conservative manner as the combined margin as specified in the „Tool to calculate the
emission factor for an electricity system“.
Again, there is no legislation in Honduras that prescribes using renewable energy sources for electricity
generation
4.
The following table provides an overview of the relevant parameters and figures:
Parame ter Unit Ye ar 1 Year 2 Year 3 Year 4 Year 5 Year 6 Year 7
Component 1: Methane avoidance
Fresh Fruit Production (TFF) kt 150 .5 14 9.0 14 6.0 143. 8 140 .5 138.7 132. 5
Electricity c onsumption MWh/yr 27 3 2 70 265 26 1 2 55 251 24 0
Fuel consumption T J/yr 0 0 0 0 0 0 0
Qy,ww m 3/yr 12 3,00 0 121,774 119, 322 117,52 4 114,8 27 113,356 108,28 9 CO Dy,ww,treated t /m3 0.0 1 0 .01 0 .01 0.0 1 0. 01 0.01 0.0 1 Sy,final t /yr 0 0 0 0 0 0 0 MCFs,final CO Dy,ww,untreated t /m3 0 .071 6 0.07 16 0.0 716 0.071 6 0.07 16 0.0 716 0.071 6 Sy,untreated t 4,12 6 4,0 84 4, 002 3,94 2 3,8 51 3,802 3,63 2
Component 2: Renewable electricity generation from biogas
Produced electricity MWh/yr 6,79 1 6,7 23 6, 587 6,48 8 6,3 39 6,258 5,97 8
1
Data has been taken from the installations’ planning (technical feasibility study conducted by Biotech)
and production forecasts of the Palm Oil Mill (data provided by the project owner). Values for COD are
based on measurements (external lab-test); done in November 2006. As a conservative estimate, the
lowest measurement result has been taken as the basis for emission reduction calculations. - The
production of fresh fruit decreases over time due to the natural growth of the palm plants.
B.5.
Description of how the anthropogenic emissions of GHG by sources are reduced below
those that would have occurred in the absence of the registered small-scale
CDM project activity:
Attachment A to Annex B of the simplified modalities and procedures for CDM small-scale project
activities specifies that a project activity would not have occurred anyway if it faces at least one of the
following barriers: investment barrier, technological barrier, barrier due to prevailing practice, or other
barriers. The project activity faces several barriers, which are summarised in the following paragraphs:
1) Investment barrier:
The financial implementation of the planned CDM project activity is a challenging task – both in terms
of the project’s economics and the financing of the installations.
4
There are some financial incentives for renewable electricity generation (specified in Decree 85-98, Incentives for the generation of renewable energy; Decree 267-98 for the use of renewable and natural resources to generate electricity; Decree 176-99 and Decree 267-98 from the Law of Renewable Incentives; Decree 103-2003 concerning
1a) Economic attractiveness of the investment:
Honduras suffers from weak local economy and local banks charge high interest rates. From January
2006 to February 2007, i.e. the period in which the initial feasibility study was conducted and the
investment decision was made, average interest rates for loans based in Lempiras ranged from 16.4% to
18.4 %, with an average of 17.4% (
www.bch.hn
). The maximum allowable interest rates during the same
period were even 27.6% to 33.7%
5. Hence, any investment financed by bank loans needs to have an
IRR higher than at least 17.4%
(conservative estimate) in order to be economically attractive
to an investor. This does not even consider risks associated with a project activity.
Without considering revenues from sales, the project-IRR without considering revenues from
CER-sales is significantly below these levels. The IRR has been calculated for several scenarios:
a “standard scenario” with constant electricity prices,
a scenario in which electricity prices increase by 10%
a scenario in which prices for electricity decrease by 10%
The results of the calculations are summarised in the following table; detailed calculations and figures
are provided in Annex 5 and have been submitted to the DOE.
Scenario IRRProje ct [%]
Payback PeriodProjec t [years]
Standard scenario (actual energy prices) 7.1 7.6
Increase of electricity prices by 10 % 9.5 6.6
Decrease of electricity prices by 10 % 4.6 8.9
The results clearly show that the return on investment for the project activity is not economically
attractive if no CERs can be generated and sold.
This situation changes when revenues from CER-sales are considered. Again, the project’s IRR has been
calculated for different scenarios. In the standard scenario, a constant CER-price of 15 US$/CER has
been assumed both for the period before 2012 and the period afterwards. This means an additional
income of 382,757 US$ per year (average of crediting period). As sensitivity analysis, a CER-price
increase and decrease of 20% has been assumed for all CERs generated after 2012 due to the current
price uncertainty. Results are summarised in the following table:
Scenario Name CER-Price IRRProje ct [%]
Payback PeriodProjec t [years] Standard scenario -
Constant CER-prices post 2012 15 US$/CER 21.4 4
High price scenario -
Increase of CER-prices by 20% post 2012 22.4 4
Low price scenario -
Decrease of CER-prices by 20% post 2012 20.3 4.9
The results show that the CER-revenues make the project economically feasible.
5
1b) Financing of the installations:
Another challenge has been the financing of the installations via dept capital. Honduras’ currency, the
Lempira, bears a significant rate of devaluation against the USD: since the acquisition of Company's
Honduran subsidiary in 1989, the Lempira has continually devalued against the USD: from 2.0 Lempira
to the USD in 1989 to 13.03 Lempira to the USD at January 31, 1997
6and to 18.9 by the end of 2006
7.
Without CER-revenues, all income generated by the project will be in Lempira, while the installations
have to be paid in USD. Hence, the expected income in hard currency through CER-sales allows
Exportadora del Atlántico to hedge against the devaluation of the Lempira.
2) Barriers due to prevailing practice
Methane recovery
Methane recovery facilities are rarely found in Honduras. The predominant technology for wastewater
treatment is an open anaerobic lagoon system. Besides CDM revenues, there are almost no incentives for
companies to invest in a more expensive and complicated waste water treatment system with biogas
capture. There are three similar projects in Honduras, and all of them are also being developed as CDM
project activities:
EECOPALSA CDM – Project Number 492: biogas recovery and electricity generation from
Palm Oil Mill Effluent ponds. The technology provider for this CDM project activity is also
BIOTEC.
Cervecería Hondureña Methane Capture Project, located in San Pedro Sula – CDM Project
Number 896. A different technology (UASB tank digester) has been applied by the project.
Energeticos Jaremar – Biogas recovery from Palm Oil Mill Effluent (POME) ponds. The project
is currently in the validation phase; the global stakeholder consultation was conducted in summer
2007.
Renewable electricity generation from biogas
Honduras has undergone efforts to reduce its dependency on fossil fuels, which resulted in a number of
laws promoting the use of renewable through fiscal incentives
8. However, the results of these initiatives
are very modest. The prevailing practice is electricity generation using fossil fuel. The use of fossil fuels
in Honduras even has increased in the past years, especially in energy generation sector, where fossil
fuels are responsible for over 61% of all electricity generation in the interconnected electricity grid
system. This trend is not expected to change as the expansion plans of the national electricity company
include investments in thermal generation capacity in the coming years.
Consequently and apart from the CDM initiatives mentioned above, there are no other digesters in
Honduras that recover biogas and take advantage of this, as part of any wastewater treatment system in
any other industrial context.
6 http://sec.edgar-online.com/1997/04/10/00/0000950144-97-003967/Section4.asp 7 http://www.auswaertiges-amt.de/diplo/de/Laenderinformationen/Honduras/Wirtschaftsdatenblatt.html 8
Conclusion of additionality assessment
The identified barriers clearly demonstrate that the project faces several barriers that prevent the
implementation of the project. Without the CDM-incentive, these barriers would lead to a continuation of
the existing system of open anaerobic lagoons. The expected revenues from CER-sales help to overcome
these barriers.
B.6.
Emission reductions:
B.6.1. Explanation of methodological choices:
1. Methane capture:
As mentioned above, the project activity falls under option
(iv) Introduction of methane recovery and combustion to an existing anaerobic wastewater treatment system such as anaerobic reactor, lagoon, septic tank or an on site industrial plant of AMS III.H.Hence, emission reductions (ER) through
the avoidance of methane emissions from the existing waste
water treatment system are calculated as follows:
As no equipment will be transferred from another activity, and none of the existing equipment will be
transferred to another activity, leakage effects do not occur. Hence, Leakagey is set as zero.
Project activity emissions are calculated strictly in line with AMS III.H while considering the following items:
Emissions from dissolved methane in treated wastewater in year “y” are calculated as:
In doing so, the standard default values of AMS III.H are applied. As the depth of the existing lagoons is
more than 2 metres, a MCF of 1.0 is chosen in line with table
III.H.1. For CODy,ww,treated it is expected thatPE
y,s,final:Emissions from anaerobic decay of the final sludge produced in the year “y” are neglected in
line with AMS III.H, because the final sludge is used for soil application (fertilizer).
Emissions from methane release in capture and flare systems are calculated as:
Where:
, and
Emissions from dissolved methane in treated wastewater are calculated as:
The baseline scenario is t
he existing anaerobic wastewater treatment system without methane recovery and combustion (option iv of AMS III.H), and hence baseline emissions are calculated as:In line with AMS III.H,
baseline emissions are calculated as per the formulas provided for calculating the project emissions, with the exception that MCF lower values in Table III.H.1 are used.2. Renewable electricity generation:
With regard to the generation of electricity from biogas, emission reductions are calculated applying the approved small scale CDM baseline methodology AMS I.D. “Grid connected renewable electricity generation”. Emission reductions are calculated from the expected amount of displaced grid electricity, multiplied with the calculated emissions factor of the grid.
The latter has been calculated as Simple OM (generation weighted average), following the procedures in AMS I.D and the „Tool to calculate the emission factor for an electricity system“, based on generation data of the years 2004, 2005 and 2006. Data has been obtained from the national Electricity Provider ENEE, considering total generation excluding low cost/must run, including approved CDM projects, and including electricity imports. Details of the calculation and its outcome can be found in Annex 3.
B.6.2. Data and parameters that are available at validation:
Data / Parameter:
Bo
Data unit:
kg CH4/kg COD
Description:
Methane producing capacity of the wastewater
Source of data used:
IPCC default value for domestic wastewater
Value applied:
0.21
description of
measurement methods
and procedures
actually applied :
Any comment:
-
Data / Parameter:
MCF
ww,finalData unit:
-
Description:
Methane correction factor based on type of treatment and discharge pathway of
the wastewater
Source of data used:
AMS III.H, MCF Higher Value in table III.H.1.
Value applied:
1
Justification of the
choice of data or
description of
measurement methods
and procedures
actually applied :
Following provisions of AMS III.H
Any comment:
-
Data / Parameter:
GWP_CH
4Data unit:
-
Description:
Global Warming Potential of Methane
Source of data used:
AMS III.H; IPCC
Value applied:
21
Justification of the
choice of data or
description of
measurement methods
and procedures
actually applied :
Standard GWP for Methane
Any comment:
-
Data / Parameter:
CFE
wwData unit:
-
Description:
Capture and flare efficiency of the methane recovery and combustion
equipment in the wastewater treatment
Source of data used:
Standard value as defined AMS III.H
Value applied:
0.9
Justification of the
choice of data or
description of
measurement methods
and procedures
actually applied :
Following provisions of AMS III.H
Data / Parameter:
MCF
ww, treatmentData unit:
-
Description:
Methane correction factor for the wastewater treatment system that will be
equipped with methane recovery and combustion
Source of data used:
AMS III.H - MCF higher values in table III.H.1
Value applied:
1
Justification of the
choice of data or
description of
measurement methods
and procedures
actually applied :
Following provisions of AMS III.H
Any comment:
-
Data / Parameter:
CFEs
Data unit:
-
Description:
Capture and flare efficiency of the methane recovery and combustion
equipment in the sludge treatment
Source of data used:
AMS III.H
Value applied:
0.9
Justification of the
choice of data or
description of
measurement methods
and procedures
actually applied :
Standard default factor as defined in AMS III.H
Any comment:
-
Data / Parameter:
DOC
y,s,untreatedData unit:
-
Description:
Degradable organic content of the untreated sludge generated in the year y.
Source of data used:
AMS III.H
Value applied:
0.09
Justification of the
choice of data or
description of
measurement methods
and procedures
actually applied :
Following the provisions of AMS III.H
Any comment:
Will be monitored ex-post
Data / Parameter:
MCF
s,treatmentData unit:
-
Description:
Methane correction factor for the sludge treatment system that will be equipped
with methane recovery and combustion
Justification of the
choice of data or
description of
measurement methods
and procedures
actually applied :
Following provisions of AMS III.H
Any comment:
-
Data / Parameter:
[CH
4]
y,ww,treatedData unit:
t/m
3Description:
Dissolved methane content in the treated wastewater
Source of data used:
AMS III.H
Value applied:
0.001
Justification of the
choice of data or
description of
measurement methods
and procedures
actually applied :
Standard default value as defined in AMS III.H:
Any comment:
-
Data / Parameter:
MCF
ww, treatmentData unit:
-
Description:
Methane correction factor for the wastewater treatment system that will be
equipped with methane recovery and combustion
Source of data used:
AMS III.H - MCF lower values in table III.H.1
Value applied:
0.8
Justification of the
choice of data or
description of
measurement methods
and procedures
actually applied :
Following provisions of AMS III.H
Any comment:
-
Data / Parameter:
CEF
Data unit:
t CO2/MWh
Description:
National grid emissions factor
Source of data used:
Calculation based on
AMS I.D/the „Tool to calculate the emission factor for an electricity system“Value applied:
0.661
Justification of the
choice of data or
description of
measurement methods
and procedures
actually applied :
Following provisions of AMS I.C,
AMS I.D and the „Tool to calculate theemission factor for an electricity system“
.
Data on historical electricity production by plant has been provided by the
national energy provider ENEE.
Any comment:
-
Data / Parameter:
η
FlareData unit:
-
Description:
Efficiency of flare
Source of data used:
AMS III.H
Value applied:
0.5
Justification of the
choice of data or
description of
measurement methods
and procedures
actually applied :
Standard default value for open flares as defined in AMS III.H
Any comment:
-
B.6.3 Ex-ante calculation of emission reductions:
Emission reductions are calculated as the difference between baseline emissions and project emissions
strictly in line with the provisions and formula as defined in AMS III.H, AMS I.D, the „Tool to calculate
the emission factor for an electricity system“ and as explained in section B.6.1 of this document.
Details of calculation and annual results over the crediting period can be found in Annex 3. The
following tables summarise project activity emissions, baseline emissions, leakage and estimated
emission reductions for the individual components of the proposed CDM project activity.
It may be noted that the decrease of project emissions and baseline emissions over time is due to
decreased production in the Palm Oil Plant (due to decreased harvest from palms according to the natural
growth cycle) and responding increase of wastewater volumes.
Component 1: Methane avoidance (AMS III.H) Year Estimation of project activity emissions (tonnes of CO2e) Estimation of baseline emissions (tonnes of CO2 e)
Estim ation of leakage (tonnes of CO2e) Estimation of emission reductions (tonnes of CO2e) 1 10,794 33,160 0 22,367 2 10,686 32,830 0 22,144 3 10,471 32,169 0 21,698 4 10,313 31,684 0 21,371 5 10,076 30,957 0 20,881 6 9,947 30,561 0 20,613 7 9,503 29,194 0 19,692 Total 71,790 220,556 0 148,766
Component 2: Renewable electricity generation / utilization of biogas (AMS I.D) Year Estimation of project activity emissions (tonnes of CO2e) Estimation of baseline emissions (tonnes of CO2 e)
Estim ation of leakage (tonnes of CO2e) Estimation of emission reductions (tonnes of CO2e) 1 0 4,489 0 4,489 2 0 4,444 0 4,444 3 0 4,354 0 4,354 4 0 4,289 0 4,289 5 0 4,190 0 4,190 6 0 4,137 0 4,137 7 0 3,952 0 3,952 Total 0 29,854 0 29,854
B.6.4 Summary of the ex-ante estimation of emission reductions:
Year Estimation of project activity emissions (tonnes of CO2e) Estimation of baseline emissions (tonnes of CO2 e)
Estim ation of leakage (tonnes of CO2e) Estimation of emission reductions (tonnes of CO2e) 1 10,794 37,649 0 26,855 2 10,686 37,274 0 26,588 3 10,471 36,523 0 26,052 4 10,313 35,973 0 25,660 5 10,076 35,147 0 25,071 6 9,947 34,697 0 24,750 7 9,503 33,146 0 23,644 Total 71,790 250,410 0 178,620
B.7
Application of a monitoring methodology and description of the monitoring plan:
The project activity applies the approved monitoring methodologies of AMS III.H and AMS I.D – for
discussion of applicability of these methodologies please see section B.2 of this document. Details of the
monitoring approaches are provided in the following sections.
B.7.1 Data and parameters monitored:
Data / Parameter:
wCH4,y (ID 1)Data unit:
%
Description:
Fraction of methane in the biogas in the year “y”
Source of data to be
used:
To be monitored.
Value of data
Approximately 60% (ex-ante estimate)
Description of
measurement methods
and procedures to be
applied:
The methane fraction will be measured using an electronic gas analyzer which
analyses works with an accuracy of 97%. The monitored data will be saved
digitally in the computerized monitoring system.
Manufacturer: Sewerin
Model: SR2-DO
Type: Off line portable.
Accuracy: +/- 3% in CO2, CH4 (thermal conductivity sensors) and H2S
(electrochemical sensor). The sensors work independent of temperature.
Monitoring interval: for operation purposes: every day; for CDM
requirements: once per month.
QA/QC procedures to
be applied:
QA:
The device will be recalibrated according to the instructions (schedules,
procedures) for QA of the technology provider.
QC:
There will be strict compliance to maintenance schedule recommended by
the technology provider. The meters must be sealed after checking.
Any comment:
-
Data / Parameter:
BG_GEN,y
(ID 2)Data unit:
Nm
3Description:
Amount of biogas that is utilized in the engine-generator
Source of data to be
used:
Monitoring System
Value of data
To be monitored
Description of
measurement methods
and procedures to be
applied:
Biogas quantities will measured with mass flow meters with an inaccuracy of
1% of the reading + 0.5% of the calibrated full scale.
Manufacturer: Magnetrol
Model: TA2 for Digester GAS (Biogas)
Type: On line (Thermal dispersion sensor)
Accuracy: 1% of the reading + 0.5% of the calibrated full scale.
Monitoring interval: 30 S. in PLC. (Instant Flow and cumulated).
QA/QC procedures to
be applied:
QA:
The monitoring device will be recalibrated according to the instructions
(schedules, procedures) for QA of the technology provider. A cross-check of
the sum of all flow meters will be made with the capacity of the blowers,
installed at the capture facility. If significant deviations are observed, an
explanation for this will be defined immediately and if necessary recalibration
will be considered at more frequent intervals.
QC:
There will be strict compliance to maintenance schedule recommended
by the technology provider. To ensure quality on the operation of the
automated system control, regular maintenance is performed.
Any comment:
-
Data / Parameter:
BG_Fl,y
(ID 3)Data unit:
Nm
3Description:
Amount of biogas that is utilized in the emergency flare
Source of data to be
used:
Monitoring System
Value of data
To be monitored
Description of
measurement methods
Biogas quantities will measured with mass flow meters with an inaccuracy of
1% of the reading + 0.5% of the calibrated full scale.
applied:
Model: TA2 for Digester GAS (Biogas)
Type: On line (Thermal dispersion sensor)
Accuracy: 1% of the reading + 0.5% of the calibrated full scale.
Monitoring interval: 30 S. in PLC. (Instant Flow and cumulated).
QA/QC procedures to
be applied:
QA:
The monitoring device will be recalibrated according to the instructions
(schedules, procedures) for QA of the technology provider. A cross check of
the sum of all flow meters will be made with the capacity of the blowers,
installed at the capture facility. If significant deviations are observed, an
explanation for this will be defined immediately and if necessary recalibration
will be considered at more frequent intervals.
QC:
There will be strict compliance to maintenance schedule recommended
by the technology provider. To ensure quality on the operation of the
automated system control, regular maintenance is performed.
Any comment:
Please see comment on BG_GEN,y.
Data / Parameter:
EC_BGS
y (ID 4)Data unit:
MWh/year
Description:
Electricity consumption of the biogas recovery equipment in year "y"
Source of data to be
used:
Monitoring system
Value of data
Approximately 273 MWh/yr (ex-ante estimate)
Description of
measurement methods
and procedures to be
applied:
The electricity consumption is measured with an accuracy of 99.5%. The data
will be stored in the monitoring system.
QA/QC procedures to
be applied:
QA:
Initial calibration of the meter is achieved in the labs of the national
grid company.
QC:
The verification and calibration of the meter is routinely performed
by technicians from the national grid company.
Any comment:
-
Data / Parameter:
EGy
(ID 5)Data unit:
MWh/yr
Description:
Net electricity production by the biogas component of the project activity
Source of data to be
used:
Monitoring system
Value of data
To be monitored.
Description of
measurement methods
and procedures to be
applied:
The electricity consumption is measured with an accuracy of 99.5%. The data
will be stored in the monitoring system.
QA/QC procedures to
be applied:
QA:
Initial calibration of the meter is achieved in the labs of the national
grid company.
QC:
The verification and calibration of the meter is routinely performed by
technicians from the national grid company.
Data / Parameter:
Sl
y (ID 6)Data unit:
m
3/yr
Description:
End use of the final sludge in year "y"
Source of data to be
used:
Monitoring System
Value of data
-
Description of
measurement methods
and procedures to be
applied:
Sludge removed from the system will directly be applied as fertilizer to the
surrounding land. This procedure will be recorded by the responsible persons
and the information will be included in the monitoring system. Unexpected
deviations from this procedure will be recorded and reported as well.
QA/QC procedures to
be applied:
-
Any comment:
-
Data / Parameter:
DOC
y,s,untreated (ID 7)Data unit:
Kg/m
3Description:
Degradable organic content of the untreated sludge generated in the year y.
Source of data used:
External analysis (lab test)
Value applied:
To be monitored.
Justification of the
choice of data or
description of
measurement methods
and procedures
actually applied :
The parameter will be measured by sampling and analysis of the sludge produced
through an external laboratory on a quarterly basis.
QA/QC procedures to
be applied:
QS/QA of external laboratory.
Any comment:
-
B.7.2 Description of the monitoring plan:
Emission reductions will be determined by quantifying the amount of methane destroyed and the amount of electricity generated:
1. Methane capture:
According to para 26 of AMS III.H – which is relevant for baseline option iv) – “
the calculation of
emission reductions shall be based on the amount of methane recovered and fuelled or flared, that is
monitored ex-post. Also for these cases, the project emissions and leakage will be deducted from the
emission reductions calculated from the methane recovered and combusted, except where it can be
demonstrated that the technology implemented does not increase the amount of methane produced per
unit of COD removed, compared with the technology used in the baseline.
”
In fact, the project activity will not increase the amount of COD removed, because it will simply capture
the methane that is released from the wastewater, but it will not enforce the anaerobic processes (as for
example in a closed digester). Hence, project emissions regarding methane emissions from wastewater
and leakage do not have to be deducted from captured and fuelled/flared methane.
In summary, emission reductions are calculated as:
ERww,y = wCH4,y * BG_GENy + wCH4,y *
η
Flare * BG_Fl,y – EC_BGSy * CEFAll parameters are defined in section B.7.1.
2. Renewable electricity generation:
Emission reductions due to the replacement of grid supplied electricity will be determined by multiplying the net electricity generation of the biogas system with the grid emissions factor:
ERBG,y = EGy * CEF
All parameters are defined in sections B.7.1 and B.6.2. of this document.
Total emission reductions of the project activity will be determined ex-post by summing up emission
reductions from the two components:
ERProject, y = ERww, y + ERBG, y
A summary of measurement points of the monitoring plan is given in Figure 3.
Figure 3: Summary of monitoring plan
Electricity Biogas Sludge Water Wastewater Pre-treatment system
Lagoon system and biogas collection
Post-treatment system
Electricity grid
Discharge to river Soil application
Engine-generator Emergency flare Project boundary Palm Oil Production 6; 7 4 Electricity 1 2 3 5 Electricity Biogas Sludge Water Wastewater Pre-treatment system
Lagoon system and biogas collection
Post-treatment system
Electricity grid
Discharge to river Soil application
Engine-generator Emergency flare Project boundary Palm Oil Production 6; 7 4 Electricity 1 2 3 5
Exportadora del Atlantico, the project owner, hired Biotec to operate the biogas plant. Biotech has got
the monitoring responsibilities for three years. During this period all data of process will be recorded by
a Scada system and stored on a hard disk with a redundant copy on a global database located in the main
office (Cali, Colombia). Biotec has developed a training school to provide training to its personnel.
Operators has been receiving training in biogas and generating system operation. Also, training in
instrumentation and monitoring system has been provided through Biotec experienced engineers.
The plant chief performs daily monitoring and control of operating procedures, data collection and daily
reports. In addition, the monitoring system can be displayed by Biotec experts anywhere (remote
supervision). Biotec performs internal audits each three months through experienced engineers coming
regularly from the main engineering office.
All data gathered and a description of measures that constitute the monitoring plan will be kept by the management for at least two years after the crediting period, permitting any future auditing of the values.B.8
Date of completion of the application of the baseline and monitoring methodology and the
name of the responsible person(s)/entity(ies)
The baseline and the monitoring methodology have been prepared by Perspectives GmbH, Germany.
Completion date of baseline: 16/12/2007
Company name:
Perspectives GmbH
Address:
Sonnenredder 55
22045 Hamburg, Germany
Contact person:
Ms. Sonja Butzengeiger-Geyer
Telephone number:
+49 179 457 36 16
Fax number:
+49 89 14 88 28 08 22
E-mail:
[email protected]
Perspectives GmbH is a not project participant, but the CDM consultant.
SECTION C. Duration of the project activity / crediting period
C.1
Duration of the project activity:
C.1.1. Starting date of the project activity:
Start of construction is planned for late spring 2008
Operation is scheduled to start in December 2008
C.1.2. Expected operational lifetime of the project activity:
C.2
Choice of the crediting period and related information:
C.2.1. Renewable crediting period
7 years
C.2.1.1.
Starting date of the first crediting period:
1
stJanuary 2009
C.2.1.2.
Length of the first crediting period:
7 years
C.2.2. Fixed crediting period:
C.2.2.1.
Starting date:
This section does not apply.
C.2.2.2.
Length:
This section does not apply.
SECTION D. Environmental impacts
D.1.
If required by the host Party
,
documentation on the analysis of the environmental impacts
of the project activity:
According to Honduran law, no Environmental Impact Assessment needs to be conducted for this
installation. However, an environmental licence needs to be obtained. Exportadora del Atlantico has
applied for such in late November 2007.
D.2.
If environmental impacts are considered significant by the project participants or the host
Party, please provide conclusions and all references to support documentation of an environmental
impact assessment undertaken in accordance with the procedures as required by the host Party:
As described in section A.2 of this document, the operation of the new wastewater treatment system will
not impact the environment negatively, but will improve the quality of discharged water (COD-load and
other parameters, see section A.2).
SECTION E. Stakeholders’ comments
>>
E.1.
Brief description how comments by local stakeholders have been invited and compiled:
The planned CDM project activity has been announced to the public by:
Advertisements in local/regional newspapers and potentially other relevant information channels
to inform about the projects; and
Personal information of important stakeholders such as local policy makers and
local/regional/national environmental (and other) NGOs in writing.
The announcements have informed the public of the outlines of the project, including its location and
purpose, its technical feature, as well as its CDM component. In addition, the public has been invited to
comment on the project directly, through electronic mails, regular mails or phone calls.
Finally, the public has been invited to attend the public meeting, which will be held at the project site in
January 2008.
E.2.
Summary of the comments received:
Comments have not yet been received.
E.3.
Report on how due account was taken of any comments received:
Annex 1
CONTACT INFORMATION ON PARTICIPANTS IN THE PROJECT ACTIVITY
Organization:
Exportadora del Atlántico
Street/P.O.Box:
Bolevard Suyapa
Building:
City:
Barrio Morazan Tegicigalpa
State/Region:
Postfix/ZIP:
Country:
Honduras
Telephone:
FAX:
E-Mail:
URL:
Represented by:
Title:
Salutation:
Last Name:
Rodriguez // Facussi
Middle Name:
First Name:
German // Miguel and Lorena
Department:
Mobile:
Direct FAX:
Direct tel:
+504 (305) 735-2330
Personal E-Mail:
[email protected]
Organization:
EDF Trading
Street/P.O.Box:
71 High Holborn
Building:
City:
London
State/Region:
Postfix/ZIP:
WC1V 6ED
Country:
United Kingdom
Telephone:
FAX:
E-Mail:
URL:
Represented by:
Title:
Dr.
Salutation:
Last Name:
Scott
Middle Name:
Department:
Carbon Credit Origination Manager
Mobile:
Direct FAX:
+44 (0)20 7061 5196
Direct tel:
+44 (0)20 7061 4196
Personal E-Mail:
[email protected]
Annex 2
INFORMATION REGARDING PUBLIC FUNDING
Annex 3
BASELINE INFORMATION
Component 1: Methane capture (AMS III.H)
1-1 Project Emissions
YEAR 1 PEy 10,794 t CO2_eq
Can be neglected in case of soil application
PEy_power 180 t CO2_eq PEWW_treated 3,885 t CO2_eq PEy,s,final 0 t CO2_eq PEy,fugitive 4,145 t CO2_eq PEy,dissolved 2,583 t CO2_eq Electricity consumption (EC,y) 272.8MWh/yr Qy,ww 123,000m3/yr S
y,final 0t/yr PEy,fugitive,ww 3885.155 t CO2_eq PEy,fugitive,s 259.9069 t CO2_eq [CH4]y,ww,treated0.001t/m3 Grid EF 0.661t CO2/MWh CODy,ww,treated 0.01t/m3 DOC
y,s,final 0.09
Bo,ww 0.21kg CH4/kg COD MCFs,final 1AMS III.G CFEww 0.9 CFEs 0.9 Fuel consumption 0TJ/yr MCFww,final 1 DOCF 0.5 MEPy,ww,treatment 1850.074 t CH4 MEPy,s,treatment123.7652 EFfuel 77.4t CO2/TJ GWPCH4 21 F 0.5
CODy,ww,untreated 0.071625t/m3 S
y,untreated 4,126t MCFww, treatment 1 DOCy,s,untreated 0.09
MCFs,treatment 1
YEAR 2 PEy 10,686 t CO2_eq
Can be neglected in case of soil application
PEy_power 179 t CO2_eq PEWW_treated 3,846 t CO2_eq PEy,s,final 0 t CO2_eq PEy,fugitive 4,104 t CO2_eq PEy,dissolved 2,557 t CO2_eq Electricity consumption 270.1MWh/yr Qy,ww 121,774m
3/yr Sy,final 0t/yr PEy,fugitive,ww 3846.432 t CO2_eq PEy,fugitive,s 257.3164 t CO2_eq [CH4]y,ww,treated0.001t/m 3 Grid EF 0.661t CO2/MWh CODy,ww,treated 0.01t/m
3 DOC
y,s,final 0.09
Bo,ww 0.21kg CH4/kg COD MCFs,final 1AMS III.G CFEww 0.9 CFEs 0.9
Fuel consumption 0TJ/yr MCFww,final 1 DOCF 0.5 MEPy,ww,treatment 1831.634 t CH4 MEPy,s,treatment122.5316 EFfuel 77.4t CO2/TJ GWPCH4 21 F 0.5
CODy,ww,untreated 0.071625t/m
3 S
y,untreated 4,084t MCFww, treatment 1 DOCy,s,untreated 0.09
MCFs,treatment 1
YEAR 3 PEy 10,471 t CO2_eq
Can be neglected in case of soil application
PEy_power 175 t CO2_eq PEWW_treated 3,769 t CO2_eq PEy,s,final 0 t CO2_eq PEy,fugitive 4,021 t CO2_eq PEy,dissolved 2,506 t CO2_eq Electricity consumption 264.6MWh/yr Qy,ww 119,322m3/yr Sy,final 0t/yr PEy,fugitive,ww 3768.987 t CO2_eq PEy,fugitive,s 252.1356 t CO2_eq [CH4]y,ww,treated0.001t/m3 Grid EF 0.661t CO2/MWh CODy,ww,treated 0.01t/m3 DOC
y,s,final 0.09
Bo,ww 0.21kg CH4/kg COD MCFs,final 1AMS III.G CFEww 0.9 CFEs 0.9
Fuel consumption 0TJ/yr MCFww,final 1 DOCF 0.5 MEPy,ww,treatment 1794.756 t CH4 MEPy,s,treatment120.0646 EFfuel 77.4t CO2/TJ GWPCH4 21 F 0.5
CODy,ww,untreated 0.071625t/m
3 S
y,untreated 4,002t MCFww, treatment 1 DOCy,s,untreated 0.09
MCFs,treatment 1
YEAR 4 PEy 10,313 t CO2_eq
Can be neglected in case of soil application
PEy_power 172 t CO2_eq PEWW_treated 3,712 t CO2_eq PEy,s,final 0 t CO2_eq PEy,fugitive 3,961 t CO2_eq PEy,dissolved 2,468 t CO2_eq Electricity consumption 260.7MWh/yr Qy,ww 117,524m3/yr S
y,final 0t/yr PEy,fugitive,ww 3712.194 t CO2_eq PEy,fugitive,s 248.3363 t CO2_eq [CH4]y,ww,treated0.001t/m3 Grid EF 0.661t CO2/MWh CODy,ww,treated 0.01t/m3
DOCy,s,final 0.09
Bo,ww 0.21kg CH4/kg COD MCFs,final 1AMS III.G CFEww 0.9 CFEs 0.9
Fuel consumption 0TJ/yr MCFww,final 1 DOCF 0.5 MEPy,ww,treatment 1767.712 t CH4 MEPy,s,treatment118.2554 EFfuel 77.4t CO2/TJ GWPCH4 21 F 0.5
CODy,ww,untreated 0.071625t/m3
Sy,untreated 3,942t MCFww, treatment 1 DOCy,s,untreated 0.09
MCFs,treatment 1
YEAR 5 PEy 10,076 t CO2_eq
Can be neglected in case of soil application
PEy_power 168 t CO2_eq PEWW_treated 3,627 t CO2_eq PEy,s,final 0 t CO2_eq PEy,fugitive 3,870 t CO2_eq PEy,dissolved 2,411 t CO2_eq Electricity consumption 254.7MWh/yr Qy,ww 114,827m3/yr S
y,final 0t/yr PEy,fugitive,ww 3627.005 t CO2_eq PEy,fugitive,s 242.6373 t CO2_eq [CH4]y,ww,treated0.001t/m3 Grid EF 0.661t CO2/MWh CODy,ww,treated 0.01t/m3 DOC
y,s,final 0.09
Bo,ww 0.21kg CH4/kg COD MCFs,final 1AMS III.G CFEww 0.9 CFEs 0.9 Fuel consumption 0TJ/yr MCFww,final 1 DOCF 0.5 MEPy,ww,treatment 1727.145 t CH4 MEPy,s,treatment115.5416 EFfuel 77.4t CO2/TJ GWPCH4 21 F 0.5
CODy,ww,untreated 0.071625t/m3 S
y,untreated 3,851t MCFww, treatment 1 DOCy,s,untreated 0.09
MCFs,treatment 1
YEAR 6 PEy 9,947 t CO2_eq
Can be neglected in case of soil application
PEy_power 166 t CO2_eq PEWW_treated 3,581 t CO2_eq PEy,s,final 0 t CO2_eq PEy,fugitive 3,820 t CO2_eq PEy,dissolved 2,380 t CO2_eq Electricity consumption 251.4MWh/yr Qy,ww 113,356m
3/yr Sy,final 0t/yr PEy,fugitive,ww 3580.538 t CO2_eq PEy,fugitive,s 239.5288 t CO2_eq [CH4]y,ww,treated0.001t/m 3 Grid EF 0.661t CO2/MWh CODy,ww,treated 0.01t/m
3 DOC
y,s,final 0.09
Bo,ww 0.21kg CH4/kg COD MCFs,final 1AMS III.G CFEww 0.9 CFEs 0.9
Fuel consumption 0TJ/yr MCFww,final 1 DOCF 0.5 MEPy,ww,treatment 1705.018 t CH4 MEPy,s,treatment114.0613 EFfuel 77.4t CO2/TJ GWPCH4 21 F 0.5
CODy,ww,untreated 0.071625t/m
3 S
y,untreated 3,802t MCFww, treatment 1 DOCy,s,untreated 0.09
MCFs,treatment 1
YEAR 7 PEy 9,503 t CO2_eq
Can be neglected in case of soil application
PEy_power 159 t CO2_eq PEWW_treated 3,420 t CO2_eq PEy,s,final 0 t CO2_eq PEy,fugitive 3,649 t CO2_eq PEy,dissolved 2,274 t CO2_eq Electricity consumption 240.2MWh/yr Qy,ww 108,289m3/yr Sy,final 0t/yr PEy,fugitive,ww 3420.485 t CO2_eq PEy,fugitive,s 228.8217 t CO2_eq [CH4]y,ww,treated0.001t/m3 Grid EF 0.661t CO2/MWh CODy,ww,treated 0.01t/m
3 DOC
y,s,final 0.09
Bo,ww 0.21kg CH4/kg COD MCFs,final 1AMS III.G CFEww 0.9 CFEs 0.9
Fuel consumption 0TJ/yr MCFww,final 1 DOCF 0.5 MEPy,ww,treatment 1628.802 t CH4 MEPy,s,treatment108.9627 EFfuel 77.4t CO2/TJ GWPCH4 21 F 0.5
CODy,ww,untreated 0.071625t/m3 S
y,untreated 3,632t MCFww, treatment 1 DOCy,s,untreated 0.09