RALLY – PERFORMANCE
BENCHMARKING OF
OPENSTACK
OpenStack Basics
Everything is written in python
End users can interact through a common web interface (Horizon) or
directly to each service through their API
All services authenticate through a common source
Individual services interact with each other through their public APIs
*
Most daemons implemented WSGI middleware (Paste)
Used extensively in OpenStack
Configured through *-paste.ini files
Identity (“Keystone”)
Keystone provides a single point of
integration for OpenStack policy, catalog,
token and authentication.
keystone
handles API requests as well
as providing configurable catalog, policy,
token and identity services.
Standard backends include LDAP or SQL,
as well as Key Value Stores (KVS).
Most people will use this as a point of
customization for their current
authentication services.
OpenSt ack Ident it y Service
keyst one (ser vice & admin APIs)
ident it y backend cat alog
backend
t oken backend policy backend
Dashboard (“Horizon”)
Django application
that users can access
in their web browser
Communicates with
each OpenStack
service through their
API (and sometimes
their admin API)
OpenSt ack
Dashboard
Hor izon
HTTP(S)
Object Storage (“Swift”)
OpenSt ack Object St ore
swif t-pr oxy
object cont ainer account object st ore account DB cont ainer DB memcached
Stores and serves objects (files)
Employs object level replication
to safeguard data
Accepts client requests via
Objectstore API or HTTP from
clients through
swift-proxy
Maintains distributed account
and container databases
Stores objects according the ring
layout on filesystem with
extended attributes (XFS, EXT4,
etc.)
Image Service (“Glance”)
glance-api
accepts Image API
calls for image discovery, image
retrieval and image storage.
glance-registry
stores,
processes and retrieves metadata
about images (size, type, etc.).
Database to store the image
metadata.
A storage repository for the actual
image files. In many deployments,
this is OpenStack Swift
OpenSt ack Image Ser vice
glance-api
glance-regist r y
glance dat abase
Compute (“Nova”)
OpenSt ack Comput e nova-api
(OS, EC2, Admin)
nova-consoleaut h nova-cert / object st ore nova-console Queue nova- comput e nova-scheduler nova dat abase hyper visor libvir t , XenAPI, et c. nova- conduct or
nova-api
accepts and responds to
end user compute API calls.
Supports OpenStack Compute API,
Amazon's EC2 API and a special
Admin API (for privileged users to
perform administrative actions).
Initiates most of the orchestration
activities (such as running an
instance)
Enforces some policy (mostly quota
checks)
Authentication is handled through
middleware before getting to this
daemon
Block Storage (“Cinder”)
cinder-api
accepts API requests and
routes them to cinder-volume for
action.
cinder-volume
acts upon the
requests by reading or writing to the
Cinder database to maintain state,
interacting with other processes (like
cinder-scheduler) through a message
queue and directly upon block
storage providing hardware or
software. It can interact with a
variety of storage providers through a
driver architecture. Currently, there
are drivers for IBM, SolidFire, NetApp,
Nexenta, Zadara, linux iSCSI and
other storage providers.
Much like nova-scheduler, the
cinder-scheduler
daemon picks the
optimal block storage provider node
to create the volume on.
OpenSt ack Block St or age cinder-api cinder-volume cinder-scheduler cinder dat abase volume pr ovider 10
Networking (“Quantum”)
OpenSt ack Net wor k Ser vice
quant um-ser ver
quant um plugin(s) net wor k pr ovider Queue quant um dat abase quant um agent (s)
quantum-server
accepts API requests
and then routes them to the
appropriate quantum plugin for action.
Quantum ships with plugins and agents
for:
Cisco virtual and physical switches
Nicira NVP product
NEC OpenFlow products
Open vSwitch
Linux bridging
Ryu Network Operating System
Midokua
The common agents are L3 (layer 3),
DHCP (dynamic host IP addressing) and
the specific plug-in agent.
Rally - Why ?
Rally Components
Server Providers
- provide servers (virtual servers), with ssh access, in one L3
network.
Deploy Engines
- deploy OpenStack cloud on servers that are presented by
Server Providers
Verification
- component that runs tempest (or another specific set of tests)
against a deployed cloud, collects results & presents them in human readable
form.
Benchmark engine
- allows to write parameterized benchmark scenarios & run
Installing Rally on Ubuntu.
Prerequisite
•
sudo apt-get update
•
sudo apt-get install libpq-dev git-core python-dev libevent-dev libssl-dev python-pip libffi-dev
•
sudo pip install pbr
Note
: We would recommend using a separate machine for Rally. If the machine that
you use to run rally has some Openstack components running, we suggest creating a
virtual environment for running Rally because it may have conflicts with version of the
client python libraries.
Installing Rally on Ubuntu.
Installing Rally
Clone
•
git clone
https://github.com/stackforge/rally.git && cd rally
•
python setup.py install
Configure
•
sudo mkdir /etc/rally
•
sudo cp etc/rally/rally.conf.sample /etc/rally/rally.conf
•
sudo vim /etc/rally/rally.conf
•
# Change the
"connection" parameter,
•
# e.g. to connection="sqlite://///home/<your_username>/.venv/rally-db/$sqlite_db" (or any other place)
Create Database
Rally : Deploy Engines.
The task of a deploy engine is to control the process of deploying some OpenStack
distribution like DevStack or FUEL before any benchmarking procedures take place.
Every deploy engine should implement the following fairly simple interface:
•
constuctor
, which takes a deployment entity as its only parameter;
•
deploy()
, which should deploy the appropriate OpenStack distribution given the cloud
config from the deployment object the engine was initialized with (possibly using one
of available server providers)
•
cleanup(),
which should clean up the OpenStack deployment (again, possibly using one
Rally. Deploy Engine . Example
If you already have a existing Openstack Deployment that you want to benchmark
Use a json file that looks like one below. (with value specific to your system):
{
"name": "DummyEngine",
"endpoint": {
"auth_url": "
http://192.168.122.22:5000/v2.0/",
"username": "admin",
"password": "password",
"tenant_name": "admin"
}
}
For Devstack based deployment
{
"name": "DevstackEngine",
"localrc": {
"ADMIN_PASSWORD": "secret",
"NOVA_REPO": "
git://example.com/nova/",
...
},
"devstack_repo": "
git://example.com/devstack/",
"provider": {
"name": "${PROVIDER_NAME}",
...
}
}
Rally – Server Providers
Server providers in Rally are typically used by deploy engines to manage virtual
machines necessary for OpenStack deployment and its following benchmarking.
The key feature of server providers is that they provide a unified interface for
interacting with different virtualization technologies (LXS, Virsh etc.) and cloud
suppliers (like Amazon).
Every server provider should implement the following basic interface:
•
constructor,
which should take the deployment entity the provider should bind to and a
config dictionary as its parameters;
•
create_servers(image_uuid, type_id, amount
), which should create the requested number of
virtual machines of the given type using a specific image. The method should also return the
list of created servers wrapped in special Server entities.
•
destroy_servers(),
which should destroy all virtual machines previously created by the same
server provider.
Rally – Server Providers –Ex
DummyProvider – If you already have an Openstack Deployment.
This provider does nothing, but returns endpoints from configuration. This may be
useful if you have specific software/hardware configuration ready to deploy
OpenStack.
{
"name": "ExampleEngine",
"provider": {
"name": "DummyProvider",
"credentials": [{"user": "root", "host": "host1.net"}, {"user": "root", "host": "host2.net"}]
}
Rally – How_to_run
Simple
1. Initialize your Deployment
2. Create a json for Supported Benchmarking scenario
3. Run Benchmarking against a deployment above
Rally – Initialize Deployment
1.
Create a Deployment configuration (json) file.
If you are running Rally against a existing Openstack Deployment your should look like
{
"name": "DummyEngine",
"endpoint": {
"auth_url": <KEYSTONE_AUTH_URL>,
"username": <ADMIN_USER_NAME>,
"password": <ADMIN_PASSWORD>,
"tenant_name": <ADMIN_TENANT>
}
}
2.
Create a deployment using deployment create command
$ rally deployment create --filename=dummy_deployment.json --name=dummy
3. If you want to list deployments
$ rally deployment list
4.
Switch to a different Deployment
Rally – Set Benchmark scenario.
Some sample configurations are provided at “
rally/doc/samples/tasks
/”.
Lets pick up a scenario boot-and-delete.json from Nova. It looks like
{ "NovaServers.boot_and_delete_server": [ { "args": {"flavor_id": 1, "image_id": "73257560-c59b-4275-a1ec-ab140e5b9979"}, "execution": "continuous",
"config": {"times": 10, "active_users": 2, "tenants": 3, "users_per_tenant": 2}
} ] }
Modify this to design your test-case. Similarly for all other cases other available json can be modified or you can even write a new one for a custom case.
Lets dig deeper
Test name : “
NovaServers.boot_and_delete_server
”
Execution
: either
continuous
/
periodic
Times
: Number of times the test needs to be run
Active_users
: Number of parallel threads (concurrent users)
Tenants
: Total number of tenants to be created
Users_per_tenant
: Number of users per single tenant
Other parameters to be used only with supported tests
Network
: Name of network to be used
Script
: If a script is passed as input to the test
Actions
:
soft_reboot
/
stop_start
Rally – Run Benchmark.
Run your benchmark scenario by pointing at the json you created in the previous step
$ rally --verbose task start --task=my-task.json
You can check the state of the task
$ rally task list
To check a complete task analysis
$ rally task detailed <Task UUID>
Rally Result –Example.
$ rally task detailed <Task UUID>
===========================================================================
=====
Task <Task UUID> is finished. Failed: False
---
test scenario NovaServers.boot_and_delete_server
args position 0
args values:
{u'args': {u'flavor_id': <Flavor UUID>,
u'image_id': u'<Image UUID>'},
u'config': {u'active_users': 1, u'times': 2}}
+---+---+---+---+
| action | max (sec) | avg (sec) | min (sec) |
+---+---+---+---+
| nova.boot_server | 9.22798299789 | 8.90022659302 | 8.57247018814 |
| nova.delete_server | 4.24928498268 | 3.26377093792 | 2.27825689316 |
+---+---+---+---+
+---+---+---+---+---+
| max (sec) | avg (sec) | min (sec) | success/total | total times |
+---+---+---+---+---+
| 13.4775559902 | 12.1641695499 | 10.8507831097 | 1.0 | 2 |
+---+---+---+---+---+
Docker in OpenStack
•
Havana
–
Nova virt driver which integrates with docker REST API on backend
–
Glance translator to integrate docker images with Glance
•
Icehouse
–
Heat plugin for docker
•
Both options are still under development
9/12/2014
29
About This Benchmark
•
Use case perspective
–
As an OpenStack Cloud user I want a Ubuntu based VM with MySQL… Why
would I choose docker LXC vs a traditional hypervisor?
•
OpenStack “Cloudy” perspective
–
LXC vs. traditional VM from a Cloudy (OpenStack) perspective
–
VM operational times (boot, start, stop, snapshot)
–
Compute node resource usage (per VM penalty); density factor
•
Guest runtime perspective
–
CPU, memory, file I/O, MySQL OLTP
•
Why KVM?
–
Exceptional performance
Benchmark Environment Topology @ SoftLayer
glance api / reg
nova api / cond / etc
keystone
…
rally
nova api / cond / etc
cinder api / sch / vol
docker lxc
dstat
controller
compute node
glance api / reg
nova api / cond / etc
keystone
…
rally
nova api / cond / etc
cinder api / sch / vol
KVM
dstat
controller
compute node
9/12/2014
31
+
Awesome!
+
Benchmark Specs
9/12/2014
32
Spec Controller Node (4CPU x 8G RAM) Compute Node (16CPU x 96G RAM)
Environment Bare Metal @ SoftLayer Bare Metal @ SoftLayer
Mother Board SuperMicro X8SIE-F Intel Xeon QuadCore SingleProc SATA [1Proc] SuperMicro X8DTU-F_R2 Intel Xeon HexCore DualProc [2Proc]
CPU Intel Xeon-Lynnfield 3470-Quadcore [2.93GHz] (Intel Xeon-Westmere 5620-Quadcore [2.4GHz]) x 2
Memory (Kingston 4GB DDR3 2Rx8 4GB DDR3 2Rx8 [4GB]) x2 (Kingston 16GB DDR3 2Rx4 16GB DDR3 2Rx4 [16GB]) x 6
HDD (LOCAL) Digital WD Caviar RE3 WD5002ABYS [500GB]; SATAII Western Digital WD Caviar RE4 WD5003ABYX [500GB]; SATAII
NIC eth0/eth1 @ 100 Mbps eth0/eth1 @100 Mbps
Operating System Ubuntu 12.04 LTS 64bit Ubuntu 12.04 LTS 64bit
Kernel 3.5.0-48-generic 3.8.0-38-generic
IO Scheduler deadline deadline
Hypervisor tested NA - KVM 1.0 + virtio + KSM (memory deduplication) - docker 0.10.0 + go1.2.1 + commit dc9c28f + AUFS
OpenStack Trunk master via devstack Trunk master via devstack. Libvirt KVM nova driver / nova-docker virt driver
OpenStack Benchmark Client OpenStack project rally NA
Metrics Collection NA dstat
Guest Benchmark Driver NA - Sysbench 0.4.12 - mbw 1.1.1.-2 - iibench (py) - netperf 2.5.0-1
VM Image NA - Scenario 1 (KVM): official ubuntu 12.04 image + mysql snapshotted and exported to qcow2 – 1080 MB
Test Descriptions: Cloudy Benchmarks
9/12/2014
33
Benchmark
Benchmark Driver
Description
OpenStack Cloudy Benchmarks Serial VM boot
(15 VMs)
OpenStack Rally - Boot VM from image - Wait for ACTIVE state
- Repeat the above a total of 15 times - Delete VMs
VM reboot
(5 VMs rebooted 5 times each)
OpenStack Rally - Boot VM from image - Wait for ACTIVE state - Soft reboot VM 5 times - Delete VM
- Repeat the above a total of 5 times
VM snapshot (1 VM, 1 snapshot)
OpenStack Rally - Boot VM from image - Wait for ACTIVE state - Snapshot VM to glance image - Delete VM
Test Descriptions: Guest Benchmarks
9/12/2014
34
Benchmark
Benchmark Driver
Description
Guest Runtime Benchmarks
CPU performance Sysbench from within the guest - Run sysbench cpu test - Repeat a total of 10 times - Average results over the 10 times
OLTP (MySQL) performance Sysbench from within the guest - Run sysbench OLTP test - Repeat a total of 10 times - Average results over the 10 times
MySQL Indexed insertion benchmark - Run iibench for a total of 1M inserts printing stats at 100K intervals - Collect data over 5 runs & average
File I/O performance Sysbench from within the guest - Synchronous IO
- No-direct
- Run sysbench OLTP test - Repeat a total of 10 times - Average results over the 10 times
Memory performance Mbw from within the guest - Run mbw with array size of 1000 MiB and each test 10 times - Collect average over 10 runs per test
Network performance Netperf - Run netperf server on controller
- From guest run netperf client in IPv4 mode - Repeat text 5x
SERIALLY BOOT 15 VMS
OpenStack Cloudy Benchmark
Cloudy Performance: Serial VM Boot
•
Benchmark scenario overview
–
Boot VM via OpenStack nova
–
Wait for VM to become active
–
Repeat the above steps for a total of 15 VMs
–
Delete all VMs
9/12/2014
36
0
5
10
15
20
1
2
3
4
5
6
7
8
9
10
11
12
13
14
15
16
17
18
19
20
A
ctiv
e
VM
s
Time
Benchmark Visualization
VMs
Cloudy Performance: Serial VM Boot
9/12/2014
37
3.900927941
5.884197426
0
1
2
3
4
5
6
7
docker
KVM
Ti
m
e
in
Sec
o
n
d
s
Average Server Boot Time
docker
KVM
Cloudy Performance: Serial VM Boot
9/12/2014
38
0
20
40
60
80
100
1 3 5 7 9 11 13 15 17 19 21 23 25 27 29 31 33 35 37 39 41 43 45 47 49 51 53 55 57 59 61 63 65 67 69 71 73 75 77 79 81 83 85 87 89
CPU
Us
ag
e
In
Pe
rc
e
n
t
Time
Docker: Compute Node CPU
usr
sys
0
20
40
60
80
100
1
5
9 13 17 21 25 29 33 37 41 45 49 53 57 61 65 69 73 77 81 85 89 93 97 101105109113117121125129133137
CPU
Us
ag
e
In
Pe
rc
e
n
t
Time
KVM: Compute Node CPU
usr
sys
Averages
–
1.14
–
0.44
Averages
–
12.6
–
2.08
Cloudy Performance: Serial VM Boot
9/12/2014
39
0.00E+00
1.00E+09
2.00E+09
3.00E+09
4.00E+09
5.00E+09
1 3 5 7 9 11 13 15 17 19 21 23 25 27 29 31 33 35 37 39 41 43 45 47 49 51 53 55 57 59 61 63 65 67 69 71 73 75 77 79 81 83 85 87 89
M
e
m
o
ry
Us
e
d
Time
Docker: Compute Node Used Memory
Memory
0.00E+00
1.00E+09
2.00E+09
3.00E+09
4.00E+09
5.00E+09
1
5
9
13
17
21
25
29
33
37
41
45
49
53
57
61
65
69
73
77
81
85
89
93
97
10
1
10
5
10
9
11
3
11
7
12
1
12
5
12
9
13
3
13
7
M
e
m
o
ry
Us
e
d
Time
KVM: Compute Node Used Memory
Memory
Delta
687 MB
Per VM
45.8 MB
Delta
2775 MB
Per VM
185 MB
Cloudy Performance: Serial VM Boot
9/12/2014
40
0
5
10
15
20
25
1 3 5 7 9 11 13 15 17 19 21 23 25 27 29 31 33 35 37 39 41 43 45 47 49 51 53 55 57 59 61 63 65 67 69 71 73 75 77 79 81 83 85 87 89
1
M
in
u
te
Lo
ad
Ave
rage
Time
Docker: Compute Node 1m Load Average
1m
0
5
10
15
20
25
1
5
9 13 17 21 25 29 33 37 41 45 49 53 57 61 65 69 73 77 81 85 89 93 97 101105109113117121125129133137
1 M
in
u
te
Load
Av
e
rag
e
Time
KVM: Compute Node 1m Load Average
1m
Average
0.09 %
Average
SERIAL VM SOFT REBOOT
OpenStack Cloudy Benchmark
Cloudy Performance: Serial VM Reboot
•
Benchmark scenario overview
–
Boot a VM
•
Wait for it to become active
–
Soft reboot the VM
•
Wait for it to become active
•
Repeat soft reboot a total of 5 times
–
Delete VM
–
Repeat the above for a total of 5 VMs
9/12/2014
42
0
1
2
3
4
5
6
1 3 5 7 9 11 13 15 17 19 21 23 25 27 29 31 33 35 37 39 41 43 45 47 49 51 53 55
A
ctiv
e
VM
s
Time
Benchmark Visualization
Active VMs
Cloudy Performance: Serial VM Reboot
9/12/2014
43
6.591313448
124.4525079
0
20
40
60
80
100
120
140
docker
KVM
Ti
m
e
In
Sec
o
n
d
s
Average Server Reboot Time
docker
KVM
Cloudy Performance: Serial VM Reboot
9/12/2014
44
7.857602167
4.451871514
0
1
2
3
4
5
6
7
8
9
docker
KVM
Ti
m
e
In
Sec
o
n
d
s
Average Server Delete Time
docker
KVM
Cloudy Performance: Serial VM Reboot
•
After investigating docker delete times
–
Docker sends
SIGTERM
to container process to stop
–
Bash is immune to
SIGTERM
–
Docker waits for X seconds before stop
–
Default container image (init) command was using bash
–
See:
https://github.com/dotcloud/docker/issues/3766
•
Rebuild the docker mysql image
–
Don’t use bash for container image command
–
No change to docker (hypervisor); image config only
change
•
Rerun rally reboot tests; Cloudy reboot round 2
Cloudy Performance: Serial VM Reboot
9/12/2014
46
2.541945305
124.4525079
0
20
40
60
80
100
120
140
docker
KVM
Ti
m
e
In
Sec
o
n
d
s
Average Server Reboot Time (Round 2)
docker
KVM
Cloudy Performance: Serial VM Reboot
9/12/2014
47
4.093254519
4.451871514
0
0.5
1
1.5
2
2.5
3
3.5
4
4.5
5
docker
KVM
Ti
m
e
In
Sec
o
n
d
s
Average Server Delete Time (Round 2)
docker
KVM
Cloudy Performance: Serial VM Reboot
9/12/2014
48
0
2
4
6
8
10
1
74
14
7
22
0
29
3
36
6
43
9
51
2
58
5
65
8
73
1
80
4
87
7
95
0
10
23
10
96
11
69
12
42
13
15
13
88
14
61
15
34
16
07
16
80
17
53
18
26
18
99
19
72
20
45
21
18
21
91
22
64
23
37
24
10
24
83
25
56
26
29
27
02
27
75
28
48
29
21
29
94
30
67
31
40
CPU
Us
ag
e
In
Pe
rc
e
n
t
Time
KVM: Compute Node CPU
usr
sys
0
2
4
6
8
10
1
7
13
19
25
31
37
43
49
55
61
67
73
79
85
91
97
10
3
10
9
11
5
12
1
12
7
13
3
13
9
14
5
15
1
15
7
16
3
16
9
17
5
18
1
18
7
19
3
19
9
20
5
21
1
21
7
22
3
22
9
23
5
24
1
CPU
Us
ag
e
In
Pe
rc
e
n
t
Time
Docker: Compute Node CPU
usr
sys
Averages
–
0.34
–
0.11
Averages
–
0.82
–
0.19
Cloudy Performance: Serial VM Reboot
9/12/2014
49
0.00E+00
5.00E+08
1.00E+09
1.50E+09
2.00E+09
2.50E+09
1
7
13
19
25
31
37
43
49
55
61
67
73
79
85
91
97
10
3
10
9
11
5
12
1
12
7
13
3
13
9
14
5
15
1
15
7
16
3
16
9
17
5
18
1
18
7
19
3
19
9
20
5
21
1
21
7
22
3
22
9
23
5
24
1
M
e
m
o
ry
Us
e
d
Time
Docker: Compute Node Used Memory
Memory
0.00E+00
5.00E+08
1.00E+09
1.50E+09
2.00E+09
2.50E+09
1
79
15
7
23
5
31
3
39
1
46
9
54
7
62
5
70
3
78
1
85
9
93
7
10
15
10
93
11
71
12
49
13
27
14
05
14
83
15
61
16
39
17
17
17
95
18
73
19
51
20
29
21
07
21
85
22
63
23
41
24
19
24
97
25
75
26
53
27
31
28
09
28
87
29
65
30
43
31
21
M
e
m
o
ry
Us
e
d
Time
KVM: Compute Node Used Memory
Memory
Delta
57 MB
Delta
Cloudy Performance: Serial VM Reboot
9/12/2014
50
0
1
2
3
4
1
71
14
1
21
1
28
1
35
1
42
1
49
1
56
1
63
1
70
1
77
1
84
1
91
1
98
1
10
51
11
21
11
91
12
61
13
31
14
01
14
71
15
41
16
11
16
81
17
51
18
21
18
91
19
61
20
31
21
01
21
71
22
41
23
11
23
81
24
51
25
21
25
91
26
61
27
31
28
01
28
71
29
41
30
11
30
81
31
51
1 M
in
u
te
Load
Av
e
rag
e
Time
KVM: Compute Node 1m Load Average
1m
-0.5
0.5
1.5
2.5
3.5
1
7
13
19
25
31
37
43
49
55
61
67
73
79
85
91
97
10
3
10
9
11
5
12
1
12
7
13
3
13
9
14
5
15
1
15
7
16
3
16
9
17
5
18
1
18
7
19
3
19
9
20
5
21
1
21
7
22
3
22
9
23
5
24
1
1 M
in
u
te
Load
Av
e
rag
e
Time
Docker: Compute Node 1m Load Average
1m
Average
0.05 %
Average
SNAPSHOT VM TO IMAGE
OpenStack Cloudy Benchmark
Cloudy Performance: Snapshot VM To
Image
•
Benchmark scenario overview
–
Boot a VM
–
Wait for it to become active
–
Snapshot the VM
–
Wait for image to become active
–
Delete VM
Cloudy Performance: Snapshot VM To Image
9/12/2014
53
26.39477992
42.92771101
0
5
10
15
20
25
30
35
40
45
50
docker
KVM
Ti
m
e
(
Se
co
n
d
s)
Average Snapshot Server Time
docker
KVM
Cloudy Performance: Snapshot VM To
Image
9/12/2014
54
0
2
4
6
8
1
4
7
10
13
16
19
22
25
28
31
34
37
40
43
46
49
52
55
58
61
64
67
70
73
76
79
82
85
88
91
94
97
10
0
10
3
10
6
10
9
11
2
CPU
Us
ag
e
In
Pe
rc
e
n
t
Time
KVM: Compute Node CPU
usr
sys
-1
1
3
5
7
1
3
5
7
9 11 13 15 17 19 21 23 25 27 29 31 33 35 37 39 41 43 45 47 49 51 53 55 57 59 61 63 65 67
CPU
Us
ag
e
In
Pe
rc
e
n
t
Time
Docker: Compute Node CPU
usr
sys
Averages
–
0.4
–
0.11
Averages
–
1.58
–
1.07
Cloudy Performance: Snapshot VM To
Image
9/12/2014
55
1.65E+09
1.7E+09
1.75E+09
1.8E+09
1.85E+09
1
4
7
10
13
16
19
22
25
28
31
34
37
40
43
46
49
52
55
58
61
64
67
70
73
76
79
82
85
88
91
94
97
10
0
10
3
10
6
10
9
11
2
M
e
m
o
ry
Us
e
d
Time
KVM: Compute Node Used Memory
Memory
1.82E+09
1.84E+09
1.86E+09
1.88E+09
1.9E+09
1.92E+09
1.94E+09
1
3
5
7
9 11 13 15 17 19 21 23 25 27 29 31 33 35 37 39 41 43 45 47 49 51 53 55 57 59 61 63 65 67
M
e
m
o
ry
Us
e
d
Time
Docker: Compute Node Used Memory
Memory
Delta
48 MB
Delta
Cloudy Performance: Snapshot VM To Image
9/12/2014
56
0
0.2
0.4
0.6
1
4
7
10
13
16
19
22
25
28
31
34
37
40
43
46
49
52
55
58
61
64
67
70
73
76
79
82
85
88
91
94
97
10
0
10
3
10
6
10
9
11
2
1 M
in
u
te
Load
Av
e
rag
e
Time
KVM: Compute Node 1m Load Average
1m
0
0.2
0.4
0.6
1
3
5
7
9 11 13 15 17 19 21 23 25 27 29 31 33 35 37 39 41 43 45 47 49 51 53 55 57 59 61 63 65 67
1
M
in
u
te
Lo
ad
Ave
rage
Time
Docker: Compute Node 1m Load Average
1m
Average
0.1 %
Average
GUEST PERFORMANCE
BENCHMARKS
Guest VM Benchmark
Guest Performance: CPU
•
Linux sysbench 0.4.12 cpu test
•
Calculate prime numbers up to 20000
•
2 threads
•
Instance size
–
4G RAM
–
2 CPU cores
–
20G disk
9/12/2014
58
Guest Performance: CPU
9/12/2014
59
15.11
15.08
15.03
0
2
4
6
8
10
12
14
16
Docker
KVM
Bare Metal
Seconds
Calculate Primes
Docker
KVM
Bare Metal
Guest Performance: Memory
•
Linux mbw 1.1.1-2
•
Instance size
–
2 CPU
–
4G memory
•
Execution options
–
10 runs; average
–
1000 MiB
9/12/2014
60
Guest Performance: Memory
9/12/2014
61
0
2000
4000
6000
8000
10000
12000
14000
MEMCPY
DUMB
MCBLOCK
M
iB
/s
Memory Tests
Memory Benchmark Performance
BareMetal
docker
KVM
Guest Performance: Network
•
Netperf 2.5.0-1
–
Netserver running on controller
–
Netperf on guest
–
Run netperf 5 times & average results
•
Instance size
–
2 CPU
–
4G memory
•
Execution options
–
IPv4 / TCP
9/12/2014
62
Guest Performance: Network
9/12/2014
63
0
100
200
300
400
500
600
700
800
900
1000
docker
KVM
Th
ro
u
gh
p
u
t
In
10^
6
b
its/
sec
o
n
d
Network Throughput
docker
KVM
Guest Performance: File I/O
•
Linux sysbench 0.4.12 fileio test
–
Synchronous IO
–
Random read / write
–
Total file size of 150G
–
16K block size
•
Thread variations: 1, 8, 16, 32
•
Instance size
–
4G RAM
–
2 CPU cores
–
200G disk
•
KVM specs
–
Disk cache set to
none
–
Virtio
–
Deadline scheduler (host & guest)
•
Docker specs
–
AUFS storage driver
–
Deadline scheduler
Guest Performance: File I/O
9/12/2014
65
0
100
200
300
1
8
16
32
Mb
Threads
File I/O: Read
Docker
KVM
0
50
100
150
200
1
8
16
32
Mb
Threads
File I/O: Write
Docker
KVM
Guest Performance: File I/O
–
Read / Write
9/12/2014
66
0
200
400
600
800
1000
1200
1400
1600
1
8
16
32
K
b
/sec
Threads
File I/O: Transfer Rate
Docker
KVM
Guest Performance: MySQL OLTP
•
Linux sysbench 0.4.12 oltp test
–
Table size of 2,000,000
–
MySQL 5.5 (installed on Ubuntu 12.04 LTS with
apt-get
)
•
Variations
–
Number of threads
–
Read only & read / write
•
Instance size
–
4G RAM
–
2 CPU cores
–
20G disk
Guest Performance: MySQL OLTP
(Read)
9/12/2014
68
0
20000
40000
60000
2
8
16
To
tal Tr
an
sact
io
n
s
Threads
MySQL OLTP Read Transactions
Docker
KVM
0
200000
400000
600000
800000
2
8
16
R
e
q
u
e
sts
Threads
MySQL OLTP Read Requests
Docker
KVM
Guest Performance: MySQL OLTP (Read / Write)
9/12/2014
69
0
5000
10000
15000
20000
25000
2
16
32
64
To
tal Tr
an
sact
io
n
s
Threads
MySQL OLTP Read/Write Transactions
docker
KVM
0
100000
200000
300000
400000
2
16
32
64
R
e
q
u
e
sts
Threads
MySQL OLTP Read/Write Requests
Docker
KVM
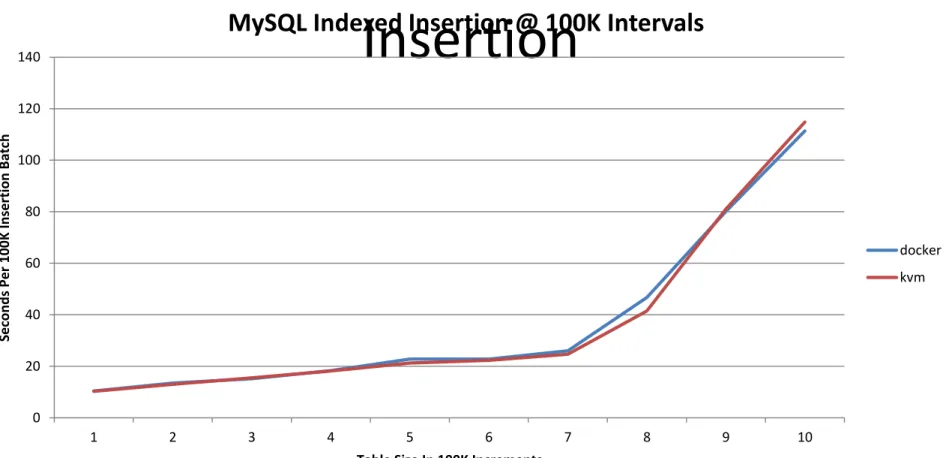
Guest Performance: MySQL Indexed
Insertion
•
Indexed insertion benchmark (iibench python
script)
–
A total of 1,000,000 insertions
–
Print stats at 100K intervals
–
Collect stats over 5 runs
–
Average
•
Instance size
–
4G RAM
–
2 CPU cores
–
20G disk
9/12/2014
70
Guest Performance: MySQL Indexed
Insertion
9/12/2014
71
0
20
40
60
80
100
120
140
1
2
3
4
5
6
7
8
9
10
Se
co
n
d
s
Per
100K
In
ser
tion
B
atc
h
Table Size In 100K Increments
MySQL Indexed Insertion @ 100K Intervals
docker
kvm
BENCHMARK OBSERVATIONS
Docker LXC CPU Growth 26x Lower Than VM
9/12/2014
73
y = 0.0091x + 0.7349
y = 0.237x + 2.2993
0
5
10
15
20
25
30
35
1
4
7
10
13
16
19
22
25
28
31
34
37
40
43
46
49
52
55
58
61
64
67
70
73
76
79
82
85
88
91
94
97
10
0
10
3
C
PU
Usa
ge
In
P
e
rc
e
n
t
User CPU Growth Trend
docker
KVM
Linear (docker)
Linear (KVM)
Slope
–
0.0091
–
0.237
Docker LXC Memory Growth 3x Lower
Than VM
9/12/2014
74
y = 1E+07x + 1E+09
y = 3E+07x + 1E+09
0.00E+00
5.00E+08
1.00E+09
1.50E+09
2.00E+09
2.50E+09
3.00E+09
3.50E+09
4.00E+09
4.50E+09
5.00E+09
1 4 7 10 13 16 19 22 25 28 31 34 37 40 43 46 49 52 55 58 61 64 67 70 73 76 79 82 85 88 91 94
M
e
m
o
ry
Us
e
d
Memory Usage Growth Trend
docker
KVM
Linear (docker)
Linear (KVM)
Slope
–
1E+07
–
3E+07
Observations
•
Cloudy operations with Docker LXC outperform VM
–
48x server reboot, 1.5x server boot, 1.62x server snapshot, etc.
•
Docker LXC density potential compared to VMs
–
3x memory savings
–
26x CPU savings
–
3.22x smaller images in this test (note
–
image sizes can vary based on required packages)
•
Docker LXC containers run on bare metal
–
Greater / equivalent
“in the VM” performance at the micro benchmark level
•
Micro benchmark results do not always reflect macro performance
–
Always benchmark your “real” workload
•
Docker image (init) command can impact performance
–
Bash ignores
SIGTERM
•
Nova-docker virt driver and docker-registry components still under dev
–
Nice work, but room for improvement (python anyone?)
•
Real performance of Docker LXC ops capped my Cloud manager
–
Can start the SQL image from docker CLI in 0.191s
REFERENCES
References & Related Links
•
http://www.slideshare.net/BodenRussell/realizing-linux-containerslxc
•
https://www.docker.io/
•
http://sysbench.sourceforge.net/
•
http://dag.wiee.rs/home-made/dstat/
•
http://www.openstack.org/
•
https://wiki.openstack.org/wiki/Rally
•
https://wiki.openstack.org/wiki/Docker
•
http://devstack.org/
•
http://www.linux-kvm.org/page/Main_Page
•
https://github.com/stackforge/nova-docker
•
https://github.com/dotcloud/docker-registry
•
http://www.netperf.org/netperf/
•
http://www.tokutek.com/products/iibench/
•
http://www.brendangregg.com/activebenchmarking.html
9/12/2014
77
REFERENCE
Rally Boot 15 VM Configuration
9/12/2014
79
•
Rally config:
{ "NovaServers.boot_server": [ { "args": { "flavor_id": 2, "image_id": “IMAGE_ID" }, "runner": { "type": "constant", "times": 15, "active_users": 1 }, "context": { "users": { "tenants": 1, "users_per_tenant": 1 } } } ] }•
Flavor
+---+---+---+---+---+---+---+---+---+ | ID | Name | Memory_MB | Disk | Ephemeral | Swap | VCPUs | RXTX_Factor | Is_Public | +---+---+---+---+---+---+---+---+---+ | 1 | m1.tiny | 512 | 1 | 0 | | 1 | 1.0 | True | | 2 | m1.small | 2048 | 20 | 0 | | 1 | 1.0 | True | | 3 | m1.medium | 4096 | 40 | 0 | | 2 | 1.0 | True | | 4 | m1.large | 8192 | 80 | 0 | | 4 | 1.0 | True | | 42 | m1.nano | 64 | 0 | 0 | | 1 | 1.0 | True | | 451 | m1.heat | 1024 | 0 | 0 | | 2 | 1.0 | True | | 5 | m1.xlarge | 16384 | 160 | 0 | | 8 | 1.0 | True | | 6 | m1.perf | 4096 | 200 | 0 | | 2 | 1.0 | True | | 7 | m1.sql | 512 | 5 | 0 | | 1 | 1.0 | True | | 8 | m1.bench | 512 | 10 | 0 | | 1 | 1.0 | True | | 84 | m1.micro | 128 | 0 | 0 | | 1 | 1.0 | True | | 9 | m1.mini | 512 | 20 | 0 | | 1 | 1.0 | True | +---+---+---+---+---+---+---+---+---+Cloudy Benchmark: Serially Boot 15
VMs
•
Docker
+---+---+---+---+---+---+---+ | action | count | max (sec) | avg (sec) | min (sec) | 90 percentile | 95 percentile | +---+---+---+---+---+---+---+ | nova.boot_server | 15 | 4.8055100441 | 3.900927941 | 3.64957404137 | 4.56917948723 | 4.80114896297 | +---+---+---+---+---+---+---+ +---+---+---+---+---+---+---+ | max (sec) | avg (sec) | min (sec) | 90 pecentile | 95 percentile | success/total | total times | +---+---+---+---+---+---+---+ | 5.02777004242 | 4.11018741926 | 3.8767888546 | 4.77419886589 | 5.02389762402 | 1.0 | 15 | +---+---+---+---+---+---+---+
•
KVM
+---+---+---+---+---+---+---+ | action | count | max (sec) | avg (sec) | min (sec) | 90 percentile | 95 percentile | +---+---+---+---+---+---+---+ | nova.boot_server | 15 | 7.00468301773 | 5.88419742584 | 4.84723997116 | 6.13021831512 | 6.48467411995 | +---+---+---+---+---+---+---+ +---+---+---+---+---+---+---+ | max (sec) | avg (sec) | min (sec) | 90 pecentile | 95 percentile | success/total | total times | +---+---+---+---+---+---+---+ | 7.22686600685 | 6.1018067201 | 5.05242800713 | 6.332523489 | 6.68914074898 | 1.0 | 15 | +---+---+---+---+---+---+---+
Rally Reboot 5x5 Configuration
9/12/2014
81
•
Rally config:
{ "NovaServers.boot_and_bounce_server": [ { "args": { "flavor_id": 2, "image_id": “ID", "actions": [ {"soft_reboot": 5} ] }, "runner": { "type": "constant", "times": 5, "active_users": 1 }, "context": { "users": { "tenants": 1, "users_per_tenant": 1 } } } ] }Cloudy Performance: Serial VM Reboot
•
Docker
+---+---+---+---+---+---+---+ | action | count | max (sec) | avg (sec) | min (sec) | 90 percentile | 95 percentile | +---+---+---+---+---+---+---+ | nova.reboot_server | 25 | 6.85025811195 | 6.59131344795 | 6.50809788704 | 6.65774655342 | 6.72213015556 | | nova.boot_server | 5 | 4.96266412735 | 4.13350987434 | 3.82891011238 | 4.61819009781 | 4.79042711258 | | nova.delete_server | 5 | 8.74263191223 | 7.85760216713 | 6.61050701141 | 8.72944793701 | 8.73603992462 | +---+---+---+---+---+---+---+ +---+---+---+---+---+---+---+ | max (sec) | avg (sec) | min (sec) | 90 pecentile | 95 percentile | success/total | total times | +---+---+---+---+---+---+---+ | 45.8827331066 | 44.9664116383 | 43.5658369064 | 45.7298994541 | 45.8063162804 | 1.0 | 5 | +---+---+---+---+---+---+---+
•
KVM
+---+---+---+---+---+---+---+ | action | count | max (sec) | avg (sec) | min (sec) | 90 percentile | 95 percentile | +---+---+---+---+---+---+---+ | nova.reboot_server | 10 | 124.951740026 | 124.452507925 | 123.876129866 | 124.950992012 | 124.951366019 | | nova.boot_server | 2 | 6.1228749752 | 5.58395600319 | 5.04503703117 | 6.0150911808 | 6.068983078 | | nova.delete_server | 2 | 4.45799517632 | 4.45187151432 | 4.44574785233 | 4.45677044392 | 4.45738281012 | +---+---+---+---+---+---+---+ +---+---+---+---+---+---+---+ | max (sec) | avg (sec) | min (sec) | 90 pecentile | 95 percentile | success/total | total times | +---+---+---+---+---+---+---+ | 632.718183994 | 632.315432072 | 631.912680149 | 632.63763361 | 632.677908802 | 0.4 | 5 | +---+---+---+---+---+---+---+
Rally Snapshot Configuration
9/12/2014
83
Rally config:
{ "NovaServers.boot_and_bounce_server": [ { "args": { "flavor_id": 1, "image_id": “IMAGE", "actions": [ {"soft_reboot": 5} ] }, "runner": { "type": "constant", "times": 5, "active_users": 1 }, "context": { "users": { "tenants": 1, "users_per_tenant": 1 } } } ] }Cloudy Performance: Snapshot VM To
Image
• Docker (note -- defect deleting image)
+---+---+---+---+---+---+---+ | action | count | max (sec) | avg (sec) | min (sec) | 90 percentile | 95 percentile | +---+---+---+---+---+---+---+ | nova.create_image | 1 | 26.3947799206 | 26.3947799206 | 26.3947799206 | 26.3947799206 | 26.3947799206 | | nova.boot_server | 2 | 4.120429039 | 3.85578501225 | 3.59114098549 | 4.06750023365 | 4.09396463633 | | nova.delete_server | 2 | 8.61395692825 | 7.64416801929 | 6.67437911034 | 8.41999914646 | 8.51697803736 | +---+---+---+---+---+---+---+ +---+---+---+---+---+---+---+
| max (sec) | avg (sec) | min (sec) | 90 pecentile | 95 percentile | success/total | total times | +---+---+---+---+---+---+---+ | n/a | n/a | n/a | n/a | n/a | 0 | 1 | +---+---+---+---+---+---+---+
• KVM
+---+---+---+---+---+---+---+ | action | count | max (sec) | avg (sec) | min (sec) | 90 percentile | 95 percentile | +---+---+---+---+---+---+---+ | nova.delete_image | 1 | 0.700344085693 | 0.700344085693 | 0.700344085693 | 0.700344085693 | 0.700344085693 | | nova.create_image | 1 | 42.92771101 | 42.92771101 | 42.92771101 | 42.92771101 | 42.92771101 | | nova.boot_server | 2 | 40.9650099277 | 22.9950100183 | 5.02501010895 | 37.3710099459 | 39.1680099368 | | nova.delete_server | 2 | 4.47270512581 | 4.46178817749 | 4.45087122917 | 4.47052173615 | 4.47161343098 | +---+---+---+---+---+---+---+ +---+---+---+---+---+---+---+
| max (sec) | avg (sec) | min (sec) | 90 pecentile | 95 percentile | success/total | total times | +---+---+---+---+---+---+---+ | 98.541975975 | 98.541975975 | 98.541975975 | 98.541975975 | 98.541975975 | 1.0 | 1 | +---+---+---+---+---+---+---+