Impacts of latency on throughput of a corporate computer network
John S. N., Okonigene R. E., Adelakun A.Covenant University
Department of Electrical and Information Engineering, Ota, Nigeria {[email protected], [email protected]}
Abstract- This paper addressed the impacts of latency on good throughputs of a computer network. The networks latency contributed largely on the performance of Covenant University network. Experiment using the University network were carried out with the channel capacity, the file sizes with the distance varies to suit the performed experiment. The Mathlab/Simulink and Netcracker Professional systems were used to simulate the model network, throughput and latency. The results from simulated hypothetical corporate computer network were validated and compared to those obtained from some websites traffic, which indicated the impact of latency on good throughput of a corporate computer network decreases the efficiency of data exchange with increase in the number of users. Thus, poor data exchange in a network with constant and good throughput was better resolved through detailed knowledge of the latency.
Keywords: Latency, Throughput, Round Trip Time, Computer Network, Bandwidth 1. Introduction
The growth of every organization’s total reliance on web-based applications has created a corresponding downward trend in the availability of bandwidth that would satisfy the basic requirements of the organization [1]. The pressure subsequently led to the implementation of various policies to deny unauthorized access through authentication, restricting visit to some sites,
limiting the volume of download and upload of data. The long-lists of approaches that are used to resolve bandwidth exhaustion always work for a limited time after which the cry for more bandwidth resurfaced. Technologies, such as Enterprise Overflow Router works better when the organization has more money to throw around on bandwidth rather than facing the problem [2]. To cater for the astronomical increase in the number of network users per unit time and the associated effects on the effectiveness and efficiency of the computer network, focus was geared towards: the effects of the lapses in the protocol as it relates to data exchange, revolution in design approaches of chips used in networking, the speed of processing information, the information processing capability of the chip and the location of servers to reduce accessibility, were profound as a measure to revive the dwindling network performance [3, 6]. The impediment to free-flow of information represented as bits on a computer network and internet at large, are mainly the result of bottlenecks [2, 4, 5]. We reviewed the underlying ideas of what constitute bottlenecks in computer network, locations of the bottlenecks, and mathematical modeling of delays at a node. Many factors have been advanced as degrading the performance of bandwidth over the years. The notion of increasing bandwidth as a solution to poor bandwidth performance was thus swept underneath. Among such factors are: (i) Inadequate traffic management, (ii) poor caching, (iii) poor compression. A well managed computer traffic on a computer network will
substantially reduce the risk of information collision and hence, the need for data retransmission. Caching and compression of the information equally reduced the need for fetching the data from the source server every time it was needed [2]. Figure 1 highlights the locations of the bottlenecks on a typical corporate computer network.
Figure 1Locations of bottlenecks on
Computer Network
The packet traversing a computer network passes through nodes which are in series or parallel before reaching its destination. Figure 2 indicates packet processing in a typical node. A node’s packet processing capacity plays significant measures in network performance in terms of its throughput and overall latency. The packet processing capacity must be such that packet-processing delay is minimized even when the packet arrival rates are high. The variability in processing time (delay) causes a packet queue to build up at the input [7, 8]. Similarly, the buffer space available at the node is finite; some packets that may not be buffered are dropped or lost. Although, the delays arising from the processor’s speed and the buffer space were not considered, but it is believed that the impact will contribute to the overall latency especially as it has a direct consequence on the TCP/IP protocol.
Figure 2. Schematic Diagram of Packet processing in a switch/router.
Delays on computer network path can be classified into three broad sub-groups
namely; propagation delays, serialization/transmission delay and queue
delay [9,10] where nodal delays such as check bit errors and determination of the output link from the router/ switch which are always insignificant are considered negligible. The propagation delay, if the speed of traveling of the packet in any medium is taken to be 2/3 of the speed of light in air, is given as
(seconds) [1] The serialization delay when N number of packets succeeded in traversing a network path of bandwidth is i i D A N S = [2]
The available bandwidth when expressed with respect to the capacity bandwidth of the medium yields
[3]
is the average utilization factor which can be arrived at from the expression below.
[4]
i.e. the ratio of average arrival rate to the mean processing time.
Hence, the serialization delay of any network is along a given path is
(
)
i i D C N S λ µ µ − × = [5]The queue delay on the other hand is given by
∑
∑
⎭ ⎬ ⎫ ⎩ ⎨ ⎧ − = ⎪ ⎪ ⎭ ⎪⎪ ⎬ ⎫ ⎪ ⎪ ⎩ ⎪⎪ ⎨ ⎧ − = L B E L B E D k R k k R Q 1 1 * * 1 1 1 λ λ γ λ γ [6]Where γEthe total external workload (packets per second), k is the packet size, L is the total number of links and is the real bandwidth
B
R
The approximate estimate of the total delays is thus the summation of the propagation, serialization and queue delays on the network path.
(
−)
+∑
⎩⎨⎧ − ⎭⎬⎫ + = + + k R k C N c x Q S P B E i D D D * * 1 * 667 . 0 λ λ γ λ µ µ [7] Equation 7 is the derived network latency of our model.2. Latency Analysis using speed test
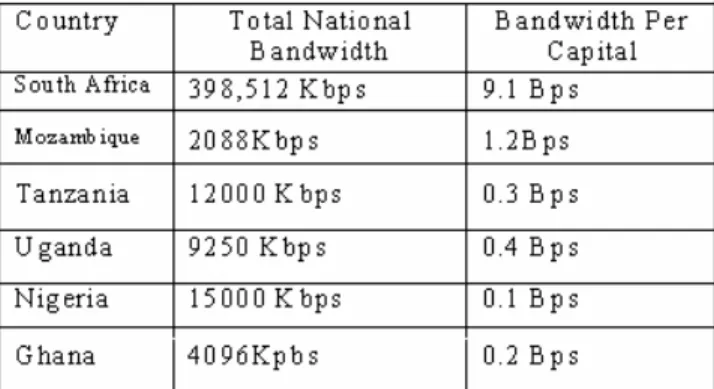
In 2002 the national bandwidths that were available in some African countries suggested the inadequacies of these resources. The Total national bandwidth per capital bandwidth of some African countries is shown in Table 1. However, a recent survey of the upload and download rate of Covenant University, Ota, network showed an estimated peak of 0.283Mbps/0.149Mbps with transfer rate of 2.4kbps/2.5kbps respectively between the hours of 10.00AM to 1.00P.M on a typical working day for accessing a server located in London, at a distance of 5700 Km, while another server located in Pretoria, South Africa, at a distance of 4150 Km, had a peak download/upload rate of 0.19Mbps/0.2Mbps with the transfer rate standing at 19.7kbps and 8.0kbps within the same period of time as shown in Figure 3. The implication was
that the internet connection apparently appears to be at considerable good speed, even when majority of the bits in transit are either lost or spent with significant part of the time hanging somewhere in space [1]. Table 1: Total National Bandwidth/ Per Capital Bandwidth of some African countries [x].
The Figure 3 shows the download/upload time for accessing a server located in London and Figure 4 shows the latencies of the ping server.
Figure 3: Download/Upload time for accessing a server located in London from
Figure 4: Latencies for Pinging a server located in London from Covenant University 3. Latency and throughput analysis in multi-hosts, multi-nodal network environment using simulation software.
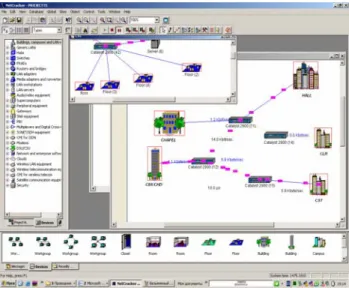
Modeling corporate computer networks using mathematical or statistical methods most often involves inadequate or misrepresentation of some salient network features. While it was not a difficult task to model the derived expression of equation 7 for a single node, multi-user network, using Matlab/Simulink, the probability of drop/lost bits was not adequately captured in a multi-node, multi- user computer network. Thus, the preferred method mostly adopted was the use of standard simulation software where each of the network components have been modeled mathematically and certified to an appreciable level. Netcracker Professional Simulation Software was used in modeling Covenant University corporate computer network shown in Figure 5. The simulated traffics were directed towards the bottlenecks to investigate latencies during congestions and at no congestions. Similarly, various file sizes were probe into the network to determine the best throughput obtainable within a specific transaction time. In another investigation, the requested file sizes, from the server to the host, were compared to the delivered file sizes in other to ascertain the effects of congestion on the
network on packet loss and the packet loss rate,
Figure 5: Model of Covenant University corporate computer network 4. Analysis of results
The linearity in relationship of packet size, latency and the round time trip (RTT) were observed to affect the packet loss rate and the throughput. Thus, for any additional increase in the number of users for a given network, the respective throughputs obtain by each of the respective users decreases. Figure 6 and Figure 7 indicates that when the total number of bandwidth consumed by users at a particular time falls within the capacity of the network, the throughputs for the respective user increases for every increase in the file size sent/ received by the users.
Figure 6: Throughput increases as file size increases for a single user
Figure 7: Throughput increases as file size increases for multiple users
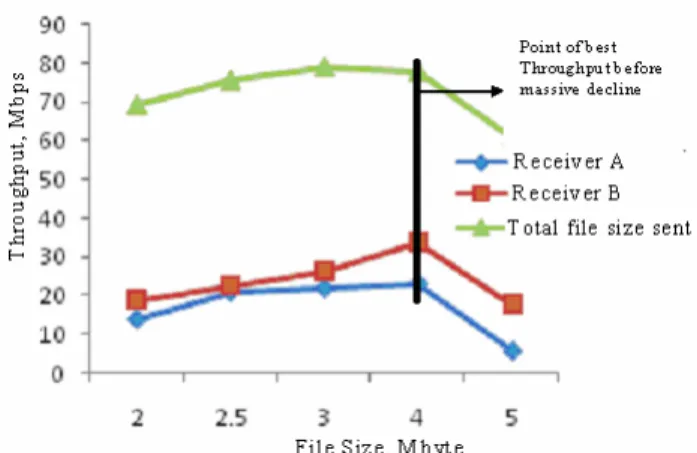
A slight disparity in the equilibrium point between the capacity bandwidth and the total bandwidth of all the users that is the summation of the respective bandwidths consumed by the users produced a drastic decline in the total throughput of the users as shown in Figure 8. This was as a result of the poor latency experienced by the network during data exchange.
The sharp decline in the throughput became more evident when the file size sent from a remote host (server) was monitored and compared with what was actually delivered at the destination. Figure 9 shows that the constraint on the file size delivery is not limited to the latency but majorly to the link capacity at both the Host and the recepient terminals.
Figure 8: Decline in Overall Throughput of the network due to poor latency
Figure 9: Steady increase in latency as file sizes increases
The continuous downward trend of the loss rate could not be ascertained whether it is has a limit after which it changes course. The magnitude of the loss rate decreases with an increase in the file size an indication of more file sizes scaling through the bottleneck as the link capacity is increased as shown in Figure 10.
[3] Ashton Metzler and associates, “The Three Components of Optimizing WAN Bandwidth”
www.ashtonmetzler.com/BW_Optimization.pdf [4] Ming Liang, “Monitoring and Analyzing Communication Latency in Distributed Real- Time Systems” Master Thesis, College of Engineering and Technology, Ohio University, USA, June 2003.
Figure 10: Loss Rate Decreases despite Rise
in File Sizes [5] Mradula S. Neginhal “Efficient Estimation of Available bandwidth along Network Path”, Master’s Thesis, North Carolina State University, 2006.
5. Conclusions
Throughput on the bottleneck path/link was found to be the cumulative of all the file sizes sent by the users. Congestion thus set in when the aggregate data sizes from the respective transactions along the link become equal to the capacity bandwidth of the link. There is a latency and throughput combination for a network, where it was observed in Figure 8 that the impact of poor latency affects the throughput. Hence, if all users could transfer data at equivalent data size, the packet lost rate would be minimal. Thus, successive additions of users to corporate computer network link culminate to a short lived increase in the average throughput and a rapidly increasing latency till the throughput collapse.
[6] John S.N. , and Atayero A.A. “Simulation of the Effect of Data Exchange Mode Analysis on
Network Throughput”, European Journal of Scientific Research, Vol.24 No.2 (2008), pp.244-252
http://www.eurojournals.com/ejsr.htm
[7] Ian G. and Peter Grant, “Digital Communications”1st edition, Prentice Hall, England, 1998
[8] Athuraliya S., Lapsley D.E., Low S.H.” Random Exponential Marking for internet
congestion control”,IEEE/ACM Transactions on Networking, Vol. 15,
No:3,pp 48-53. 6. References
[9] James F. Kurose and Keith W. Rose; “Computer networking: A top down approach featuring Internet” 2000.
[1] Dong Z., “On The Modeling of TCP Throughput and Latency” Master Thesis Mississipi State University, U.S.A ,2002.
[2] “Braking Data Transfer Bottlenecks”
Unpublished Lecture Notes, University of
Illinois at Chicago, http://udt.sourceforge.net/udt.ppt:
[10] TCPing IT Performance Consulting, “The Network Impact on Application
Performance” TCPing White paper discussing Application and Network Performance Metrics, www.tcping.com.