Journal of International Management Studies * August 2007 60
Marketing and Eye-Tracking Machines:
Research Opportunities for an Affordable Tool
Lance Gentry, Department of Business Administration, University of Missouri-Rolla, USA
ABSTRACT
Now that prices for eye-tracking machines have dropped to the point that many marketing researchers may afford them, there are many opportunities to conduct this type of Human-Computer Interaction (HCI) study with direct applications for marketing. This study briefly summarizes the limited literature on eye-tracking research as it applies to marketing and discusses marketing research opportunities using eye-tracking machines.
Keywords: Market Research, Visual Marketing, Human-Computer Interaction, HCI, Eye-Tracking
INTRODUCTION
Eye-tracking research is based upon the assumption that if one may observe where a respondent places his visual attention, one may better understand where the respondent places his mental attention. This is not a new assumption; we know that researchers have been tracking eye movements and publicizing their theories on the subject for almost three centuries (e.g. Porterfield, 1737; Delabarre, 1898; Dodge, 1900 and 1907; Nixon, 1924; Yarbus, 1967; Pieters & Wedel, 2004).
What is relatively new is the use of video-based machines to track eye movements for researchers. These machines were very expensive when first developed as they required extensive computing power to calculate the point of regard (visual attention) in real-time from viewing respondent eye features such as corneal reflections and the pupil center. However, as Moore’s Law progressed, the cost of these devices has now reached the point that it is very feasible for marketers and market researchers to utilize them.
Eye-Tracking Assumptions and Terminology
In Duchowiski’s words (2003, p. 14), An eye tracker can only track the overt movement of the eyes, however, it cannot track the covert movement of visual attention. Thus, in all eye tracking work, a tacit but very important assumption is usually accepted: we assume that attention is limited to foveal gaze direction, but we acknowledge that this may not always be so. In theory, a respondent’s mental attention may be elsewhere instead of where his visual focus is. He may be lost in thought and not paying attention to his vision. Or he may be deliberately using his peripheral vision. However, neither of these can be currently measured, so researchers have to assume that visual attention is a good proxy for mental attention. In practice, this has worked well.
Researchers who wish to use eye-trackers as a tool to help learn more about their own specialities should not be daunted by the equipment. Just as most people may competently operate a car without needing the skills to build one, researchers can easily learn to operate an eye-tracker without having to invest an inordinate amount of time to become expert oculographers. However, a basic understanding of the terminology is necessary so a few commonly used terms are defined in this briefing.
Journal of International Management Studies * August 2007 61 Fixations Minor eye movements around a point of interest. These minor eye movements are needed
to keep points of interest in focus.1
Duration The amount of time that a viewer spent viewing an object per fixation.
Exposure The cumulative time that a viewer spent viewing an object. In two cases this number will be identical to the duration (when the number of fixations on the object is 0 or 1). For all other cases, the exposure is the sum of all durations for the object.
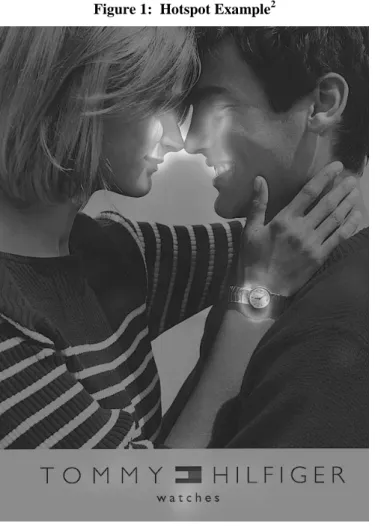
Hotspot A visual indicator of the area(s) that received the most fixations, either by quantity or by time (see example in Figure 1).
Point of Regard (POR) The object of visual attention and presumed object of mental attention. Saccades Rapid eye movements changing the fovea to a new location of interest.
Scanpath The observed pattern of eye movements over an image.
Figure 1: Hotspot Example2
1 The counterintuitive fact regarding fixations is that if an image is artificially stabilized on the retina, vision fades away within about a second and the scene becomes blank. (Duchowski, 2003, p. 48). 2 Picture from Tobii Technology. While printing in grayscale loses much of the visual impact of a hotspot image, one can still observe that the majority of attention falls upon just a few areas of the image. In order of duration, viewers observed the watch (shown by red, yellow, and green coloring in original image), the models’ faces (shown in yellow and green coloring), the Hilfiger logo and the word “watches” (yellow and green) and the male model’s ear (green only).
Journal of International Management Studies * August 2007 62
Review of Eye-Tracking and Marketing Research
It has long been obvious that if researchers could track what consumers were actually viewing with their eyes, they would be able to better model consumer behaviour. In order to monitor how much, if any, consumers would view print advertisements in magazines, Nixon (1924) hid behind a curtain and personally spied upon the eye movements of consumers while they read. Fortunately, technology has progressed to the point where more accurate and less strenuous methods of eye tracking are available.
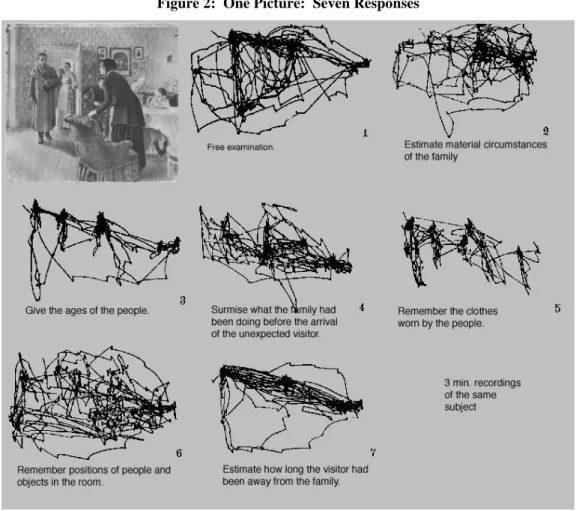
Yarbus (1967) clearly demonstrated that the eye tracks of various respondents on a given picture would affected by task-dependencies. For instance, Yarbus asked people to look at the same picture, but then asked seven different questions of the respondent.
Figure 2: One Picture: Seven Responses
As Figure 2 shows, each task resulted in a different scanpath. While Yarbus’ equipment was primitive by today’s standards, it was sufficient to clearly show that simply instructions can dramatically impact where a person places his or her visual and mental focus.
While most of the recent market research using modern eye-trackers has tended to be proprietary (Rayner et al., 2001), at least some research is starting to be published in academic journals.
Lohse (1997) studied the impact of color, graphics, size, and location on advertisements in the Yellow Pages. To prevent any confounds with brand equity and familiarity with certain businesses,
Journal of International Management Studies * August 2007 63 Lohse created four 32-page directories completely filled with non-existent firms. The four directories were used to control for differences in color, graphics, size, and location of advertisements. Lohse found that:
• Color advertisements were much more effective than black and white ads. Color ads were noticed more frequently (92% vs. 84%) than black and white ads. Color ads were viewed before black and white ads. Color ads were viewed 21% longer than similar black and white ads.
• Ads with graphics were even more effective than color ads when it came to being noticed (96% vs. 92%), but the color ads were noticed first.
• Size matters. As ad size increased, so did consumer attention (93% vs. the 26% for standard listings).
• Location also matters. Many consumers employed a satisficing principle (Simon, 1955), and stopped seeking alternatives as soon as one acceptable alternative is found. Most people were found to scan the listings in alphabetical order, thus some competing ads were never read.
Pieters and Wedel (2004) analyzed thirty-three independent eye-tracking tests of print advertisements to learn more about the impact and interaction of brand, pictorial, and text-size effects. Each test averaged approximately 100 adults from the Netherlands. They concluded that:
• Regardless of size, the inclusion of a picture has an intrinsic tendency to capture a substantial amount of attention... ...whereas the other two ad elements lack this tendency.
• Increasing the amount of surface size utilized by text results in a significant increase in attention (a 1% increase in the surface size of the text leads to a .85% increase in gaze duration, which is substantial.)
Rosler et al. (2005) used eye-tracking methodology to confirm that respondents give more attention to images that spawn emotions. This was true in general regardless if the triggered emotion was positive or negative. In specific, the attraction to positive or negative images may be impacted by other factors. For example, Rosler et al. found that younger respondents were more attracted to negative images than older respondents.
Maughan et al. (2007) studied bus shelter advertisements; the ads on the sides of sheltered bus stops that people see as they pass, usually while in a vehicle. In their experiment, a computer was used to show the respondents roadside images from the perspective of being inside a vehicle. The advertisements were not the focus of each image as the researchers desired to present a realistic picture of what someone might see while moving in a vehicle. Judging from their results, their setup was successful. 88.9% of the respondents first noticed other items in the picture. 198 UK participants, representative of the general UK population, were utilized in this study. Maughan et al. found:
• A correlation between the number of fixations on an advertisement and both the unprompted and prompted recall of the ad.
• A strong correlation between the person’s exposure (sum of all fixations) to an ad and a person’s attitude to the ad. The more the respondent viewed the ad, the more likely the respondent was to like the ad.
Research Opportunities
Yarbus’ early work on scanpaths (see Figure 2) is commonly cited as evidence supporting that visual and mental focus can be influenced by tasks (i.e., observer expectations and objectives). It would be interesting to replicate Yarbus’ work with modern equipment and in other contexts.
In addition to providing guidance as to ways to increase the competitiveness of print ads, Pieter and Wedel’s research (2004) provides the groundwork for additional study. There is the scientific need to
Journal of International Management Studies * August 2007 64
replicate these findings, especially with respondents from other cultures and languages. Peiter and Wedel’s finding about surface size raises new research questions. Is the surface-size effect caused by increases in: font size, font type, the number of words, the additional content, or an interaction of some or all of these items? Would any option that increases the surface size by the same amount have the same impact?
Maughan et al.’s recent (2007) study has significant implications for marketers and raises several key research questions. Are people more likely to like ads if they view them more often or do people simply view the ads they like? This should be empirically tested. Are these findings generalizable for other media? What about for objects other than ads? If simple exposure can be shown to increase affect, this finding could illuminate (and provide marketers with the ability to better manage) a very broad range of activities. For example, politicians would be even more motivated to have their face seen by their constituents, network managers would better understand how to create celebrities, and producers would have new insight into more effective means of promoting their products. On the other hand, if research shows that people are more likely to view the ads they like, marketers may then decide to spend more resources on crafting a likeable ad instead of maximizing exposure time.
All of the eye-tracking opportunities for studying the impact of print media factors on consumer behaviour also apply to computer media. Given the incredible growth in internet utilization (it is hard to imagine that just 10 years ago most people had never even heard of the world wide web, let alone used it), any research that allows advertisers to cut through the online clutter and to clearly communicate with potential consumers would be of great value. In addition to monitoring the same factors of interest in print media, eye-tracking can also help determine the impact of factors unique to electronic media (e.g., movements, blinking text, moving text, video, visual reactions to audio additions, etc.). Moreover, this type of testing would be even more natural to the respondents. While modern eye-trackers are less intrusive than ever, most of those that that do not require the user to wear a head-set require the user to gaze at a media screen (i.e., computer or video monitor). While effective, this is somewhat artificial for respondents asked to review print media. However, it is entirely natural for respondents asked to review internet sites as they expect to sit in front of a computer for this task.
Researchers may use eye tracking machines to help test the effectiveness of ‘advergaming’ – free online games that utilize approximately 60% to 80% of the screen while bordered by online ads. How often do gamers look at these ads? Eye tracking machines may be used to empirically measure this and to help researchers with experiments to model the effectiveness of various advergaming techniques such as animated ads.
There are many eye-tracking research applications when it comes to video as well. Advertisers have used sex appeal in an attempt to sell products since before the days of television. However, is there empirical evidence that it works? Does the appearance of attractive models call attention to the product? Or do viewers pay so much attention to the model that they ignore the product? Eye-trackers can help answer such questions. Likewise, eye-trackers can reveal how much of the audience is paying attention and when the producer loses their attention.
Other technological innovations (e.g., digital video recorders that allow users to skip commercials, broadband access to video directly from the content providers) are decreasing the audience size for traditional television advertising. It is foreseeable that television advertising may eventually be limited to those events that people desire to watch live such as football games. As less and less people watch traditional television advertising, product placement will become more and more important. However, are some methods of product placement more effective than others? Conceivable, some product
Journal of International Management Studies * August 2007 65 placement may be too subtle – viewers may not even notice. While eye-trackers cannot provide direct insight into the subconscious impact of subtle cues, it can rule out the impact of these cues of the viewer never even looks at them. Likewise, some product placement may be too blatant and annoy the viewer. Eye-tracking research may be used to devise and validate some rules-of-thumb for the product placement industry (e.g., if viewers look at the placed product more than 20% of its screen time, it becomes blatant and annoying).
REFERENCES
Delabarre E. (1898). ‘A method of recording eye movements.’ American Journal of Psychology 9, 572– 574.
Dodge R. (1900). ‘Visual perception during eye movement.’ Psychological Review 7, 454 – 465.
Dodge R. (1907). ‘An experimental study of visual fixation.’ Psychological Review Monograph Supplement. 4, iv – 92.
Duchowski, A. (2003). Eye tracking methodology: Theory and practice. Great Britian: Springer-Verlag London Limited.
Lohse, G. (1997). ‘Consumer Eye Movement Patterns on Yellow Pages Advertising.’ Journal of Advertising 26 (1), 61-73.
Maughan L., Gutnikov, S., and R. Stevens (2007). ‘Like more, look more. Look more, like more: The evidence from eye tracking.’ Brand Management, 14 (4), 335-342.
Nixon, H. (1924) ‘Attention and Interest in Advertising.’ Archives of Psychology, 72 (1), 5-67.
Pieters, R. and M. Wedel (2004). ‘Attention Capture and Transfer in Advertising: Brand, Pictorial, and Text-Size Effects.’ Journal of Marketing 68 (April), 36-50.
Porterfield W. (1737). ‘An essay concerning the motions of our eyes. Part I. Of their external motions.’ Edinburgh Medical Essays and Observations 3, 160-263.
Rayner, K., Rotello, C., Stewart, A., Keir, J., and S. Duffy (2001). ‘Integrating Text and Pictorial Information: Eye Movements When Looking at Print Advertisements.’ Journal of Experimental Psychology: Applied, 7 (3), 219-226.
Rosler, A., Ulrich, C., Billino, J., Sterzer, P., Weidauer, S., Bernhardt, T., Steinmetz, H., Frolich, L., and A. Kleinschmidt (2005). ‘Effects of arousing emotional scenes on the distribution of visuospatial attention: Changes with aging and early subcortical vascular dementia.’ Journal of the Neurological Sciences, 229-230, 109-116.
Simon, H. (1955). ‘A Behavioral Model of Rational Choice.’ Quarterly Journal of Economics, 69 (1), 99-118.
Yarbus, A. (1967). ‘Eye movements during perception of complex objects.’ In: L. Riggs(ed.) Eye Movements and Vision, 171-196. New York: Plenum Press.