FIN around the world: the contribution of financing activity to
profitability
(Article begins on next page)
The Harvard community has made this article openly available.
Please share
how this access benefits you. Your story matters.
Citation
Lundholm, Russell, George Serafeim, and Gwen Yu. "FIN Around
the World: The Contribution of Financing Activity to
Profitability." Harvard Business School Working Paper, No.
13-011, July 2012.
Accessed
February 19, 2015 10:29:52 AM EST
Citable Link
http://nrs.harvard.edu/urn-3:HUL.InstRepos:9527443
Terms of Use
This article was downloaded from Harvard University's DASH
repository, and is made available under the terms and conditions
applicable to Open Access Policy Articles, as set forth at
http://nrs.harvard.edu/urn-3:HUL.InstRepos:dash.current.terms-of-use#OAP
Copyright © 2012 by Russell Lundholm, George Serafeim, and Gwen Yu
Working papers are in draft form. This working paper is distributed for purposes of comment and discussion only. It may not be reproduced without permission of the copyright holder. Copies of working papers are available from the author.
FIN around the world:
the contribution of financing
activity to profitability
Russell Lundholm
George Serafeim
Gwen Yu
Working Paper
13-011
July 31, 2012
FIN around the world: the contribution of financing activity to profitability Russell Lundholm [email protected] George Serafeim [email protected] Gwen Yu [email protected] July 2012 Abstract
We study how the availability of domestic credit influences the contribution that financing activities make to a firm’s return on equity (ROE). Using a sample of 51,866 firms from 69 countries, we find that financing activities contribute more to a firm’s ROE in countries with higher domestic credit. The higher contribution of financing activities is not driven by firms taking greater leverage in these countries, but by firms realizing a higher spread (i.e., a greater difference in operating performance and borrowing cost) when more domestic credit is available. Also, we find that firms partially substitute trade credit for financial credit, with large firms exhibiting the greatest rate of substitution. For small firms, the rate of substitution improves with the country’s available domestic credit, while large firms are insensitive to this friction. The findings suggest that both country and firm-level factors have a significant impact on how financing activities contribute to corporate performance.
Keywords: Domestic Credit, Financial Statement Analysis, Return on Equity, Corporate Performance
We would like to thank Bill Beaver, Ivan Marinovic, and the other workshop participants at Stanford University for comments on an early draft of this manuscript.
1. Introduction
The main objective of financial statement analysis is to understand the different sources of a firm’s profitability, typically measured as the return on equity. Further, a basic premise of financial economics is that financial markets aid the flow of capital to its best use. In a frictionless world every firm’s return on equity would equal the firm’s cost of equity capital. However, numerous frictions at the firm and country level cause return on equity to vary considerably within and across countries. We study one prominent friction, the availability of domestic credit from banks, and ask how this friction influences the contribution that financing activities make to the firm’s return on equity.
To better understand the source of a firm’s performance, it is common to decompose a firm’s return on equity into the amount earned from the net operating assets and the incremental contribution created by financing activities. Because equity owners claim all the residual profit after satisfying the debt payments, financial leverage increases the return on equity when the net operating assets are more profitable than the cost of borrowing. The financing contribution to return on equity is thus the product of financial leverage and the spread between the return on assets and the net borrowing cost. We investigate how differences in the availability of domestic credit across countries influences the resulting leverage, spread, and the net financing contribution to firms’ return on equity.
There is ample evidence that financial development in a country eases firms’ financing constraints and consequently has a positive influence on the country’s growth (see Levine 2005 for a review). But these findings do not imply that the growth is profitable to the corporate sector. In fact, if there are diminishing marginal returns to investment then more growth will result in less profitability (see, for example, Fairfield et al. 2003). Further, previous research has
2 argued that the benefits of better financial market development should accrue primarily to smaller firms in a country because they are the marginal borrowers (Love 2003 and Beck et al. 2005). Because small firms are relatively less profitable than large firms (e.g., Hall and Weiss 1967, Fama and French 1995, or Li et al. 2012), it is not clear how more rapid growth funded by easier access to debt capital will influence their return on equity.1
One simple possibility is that firms in countries with less available bank credit employ less financial leverage, consequently get a smaller contribution from financing activities, and earn lower return on equity. However, it is also possible that firms in these countries have adapted such that they can effectively gain financial leverage through various operating decisions. For instance, if suppliers grant firms in these countries longer trade terms, and charge slightly higher prices, then the suppliers are effectively lending the firm money and charging interest. Another possibility is that firms in countries with limited domestic bank credit choose to lease more of their assets. In this case the lessor is effectively acting as a secured lender. In cases like these, firms substitute operating leverage for financial leverage, where the counterparty plays both an operating and a financing role in the economy. Of course, trade credit serves many purposes beyond financing downstream customers, and so it is unclear how effectively firms can substitute one source of financing for another (see Fisman and Love 2003 for a theory of trade credit). We examine how the financing contribution to firms’ return on equity trades off against the contribution from trade credit, and how the availability of domestic credit in the country influences this trade-off.
1
Jeremy Grantham, Chief Strategist of GMO Capital, remarked in an interview with Pat Dorsey of Morningstar on May 28, 2009 that “in the end, returns to the stock market are overwhelming to do with return on capital. It isn’t about top-line growth….growth countries have no history of reliably beating slower growth countries, although everyone thinks it is the case.”
3 The financing contribution to return on equity depends on both the amount of financial leverage and the spread between the profitability of the underlying operations and the borrowing cost – it only contributes a positive amount if the firm is leveraging operations that earn a positive spread. Given this, one might think that firms with better operating performance would employ greater levels of financial leverage and enjoy even higher returns on equity. A long-standing puzzle in the finance and accounting literature is that this is not the case – firms that earn more tend to borrow less (see, for example, Rajan and Zingales 1995 or Nissim and Penman 2001). We observe this relation in our data as well, but find that this behavior does not determine the contribution of financing to the return on equity. By studying only one part of the financial contribution – leverage – this literature misses the other important piece of the puzzle – the spread. We show that, at least for the largest firms in the economy, while the leverage decreases with operating performance, the spread increases even more, such that the net contribution from financing is increasing in the firms’ operating performance.2
A common theme running through all our results is that the influence of domestic credit in a country, the rate that trade credit and financial credit substitute for each other, and how operating performance flows through to the financial performance, all depend critically on the relative size of the firm in its home economy. The simple observation that small firms are fundamentally different than large firms in terms of financing options is echoed in Beck et al. (2008) who find in survey data that small firms claim that they receive relatively less bank financing and cannot compensate for this lack of financial credit with trade credit.
To examine these questions we collect 31 years of financial data from firms in 69 different countries. After controlling for a firm’s operating performance and the contribution from trade
2 Li et al. 2012 tackle the operating contribution to ROE by modeling how a firm’s international segment mix can be
4 credit, as well as for year and industry fixed effects, we find that the financing contribution to return on equity increases with available domestic credit in the country. However, most of the benefit accrues to the largest firms in the economy. A unit increase in domestic credit as a percent of gross domestic product (roughly the difference between Ireland and the United States) corresponds to a 1.4 percent increase in the financing contribution for the largest tercile of firms in their respective economies, but only a 0.5 percent increase for the smallest tercile of companies.
One might expect that firms with more profitable operations would deploy more financial leverage and enjoy a higher contribution to ROE from financing. But, consistent with a number of prior studies, we find that leverage is decreasing in the profitability of operations. However, we also find that the spread increases with operating profitability, and that leverage and spread are negatively correlated, so that for the largest firms in the economy, approximately one third of the operating profitability spills over as an additional financial contribution. The same benefit does not accrue to the smallest firms because they often have negative leverage, so increasing the spread actually lowers the financial contribution to ROE.
We also find that firms substitute trade credit for financial credit. For the largest firms in the economy, a one percent higher contribution from trade credit is associated with approximately a half percent lower contribution from finance, and for these large firms, the relation is insensitive to the country’s level of domestic credit. However, for small and medium sized firms, the rate of substitution between trade credit and financial credit increases with the country’s available domestic credit. The intuition for this result is that, for small and medium sized firms in low domestic credit countries, trade credit serves purposes beyond adding operating leverage. For these firms trade credit helps resolve the information asymmetry and
5 agency problems between the firm and its upstream supplier, and these forces work against a perfect substitution between trade credit and financial credit. Larger firms, or firms in countries with high levels of domestic credit, have other means of resolving these conflicts.
Because our dataset covers 31 years, 69 countries, and 51,866 firms, we can control for substantial cross-sectional correlation between firm-year residuals. Our main results are based on regressions with standard errors clustered at the year and country level, allowing for a general pattern of within-country and within-year residual correlation. We also corroborate our cross-sectional results with an analysis of large changes in available domestic credit. We find that changes in domestic credit are positively associated with future changes in the financial contribution to ROE, changes in operating performance are associated with changes in the financing contribution, and changes in trade performance are negatively associated with changes in the financing contribution, all consistent with our larger cross-sectional model.
The rest of the paper proceeds as follows. In the next section we decompose the return on equity into an operating component, a trade credit component, and a financing component. In section three we develop hypotheses for how the availability of domestic credit influences the financing component, how operating performance spills over into additional financial performance, and how domestic credit influences the trade-off between the financing component and the trade credit component. In section four we describe our data and empirical measures of these components, and present some summary statistics. We present our main results in section five and conclude in section six.
2. Return on Equity Decomposition
6 means of identifying the relative contribution of different firm activities. Nissim and Penman (2001) originally documented a number of summary statistics about margins, turnover ratios, and leverage for a large panel of US firms from 1963 to 1999. Nissim and Penman (2003) further distinguished between operating leverage and financial leverage and showed that this distinction aids in the prediction of future return on equity. We closely follow the decomposition proposed in Nissim and Penman (2003) and divide the return on equity into three different components as described below. The Datastream variable definitions are given in the footnotes.
Consider two decompositions of return on equity. The first is found in most financial statement analysis textbooks (see Lundholm and Sloan 2007, Penman 2010, or Palepu et al. 2004):
ROE = Net Income/Common Equity
= RNOA + LEV * (RNOA – NBC), where
RNOA is Return on Net Operating Assets, computed as Net Operating Income3, 4/Net Operating Assets5,
LEV is Financial Leverage, computed as Net Financial Obligations/Common Equity, and NBC is net borrowing cost, computed as Net Interest Expense/Net Financial Obligations, and SPREAD is RNOA – NBC.
The spread determines when financial leverage (LEV) contributes to firms profit beyond the
3 Net Operating Income = Net income (WC01706) + Net Interest Expense, where Net Interest Expense is interest
expense*(1-effective tax rate).
4
Interest expense (WC01075) for non-financial firms is often missing in Datastream. For firm-observations with missing interest information, we impute the interest expense as the difference between EBT (earnings before tax, WC01401) and EBIT (earnings before interest and tax, WC18191). Effective tax rate is computed as the tax expense (WC01451) divided by net income before tax. If net income before tax is negative, we set the effective tax rate to be zero.
5 Net Operating Assets = Common equity (WC03501)+ Net Financial Obligations, where Net Financial Obligations
7 return on net operating assets (RNOA). If the spread is positive, taking on financial leverage will allow profits to increase beyond the existing RNOA. If the spread is negative however, LEV will reduce profitability below the existing RNOA level. The key observation from the first model is that LEV amplifies the spread between operating performance (as given by RNOA) and the cost of borrowing (as given by NBC).
In addition to debt financing (as given by LEV), firms can also take on leverage through various operating decisions. For instance, firms can effectively borrow from suppliers by extending the time they take to pay their accounts payable. Also, firms can advance cash from customers with the obligation to service customers in the future, incurring deferred revenues. Using such operating leverage may not come for free and is often at a higher cost than financial leverage (Wilner 2000). We examine the contribution of operating leverage by decomposing the RNOA into the pure operating effect and the trade credit effect that comes from operating leverage. The second decomposition is:
RNOA = Net Operating Income/Net Operating Assets = ROOA + OPLEV * (ROOA – IITC), where
ROOA is Return on Operating Assets = Operating Income6 /Operating Assets7, OPLEV is Operating Liabilities8 /Net Operating Assets,
IITC is Imputed Interest Rate on Trade Credit = imputed interest expense on trade credit/operating liabilities.
6 Operating Income = Net operating income + Imputed Interest expense on Trade Credit, where Imputed Interest
expense on Trade Credit = local borrowing rate*Operating Liabilities* (1-effective tax rate). For the local borrowing rate, we use the short term deposit interest rate of each country from the World Development Indicators (provided by the World Bank). For countries with a missing borrowing rate, we use the country’s lending interest rate from the World Development Indicator. Lending interest rate is defined as the rate charged by banks on loans to prime customers.
7 Operating Assets = Total Assets (WC02999) - cash and cash equivalent (WC02001). 8 Operating Liabilities = Total Liabilities (WC03351) -Total debt(WC03255).
8 The key observation from the second model is that OPLEV amplifies the spread between a pure measure of operating performance before any trade credit (as given by ROOA) and the imputed interest from the trade credit (as given by IITC). From this we construct the identity:
ROE = Operating Contribution + Trade Credit Contribution + Financial Contribution, (1) where
Pure Operating Contribution (OP) is ROOA,
Trade Credit Contribution (TRADE) is RNOA-ROOA = OPLEV * (ROOA – IITC) and Financial Contribution (FIN) is ROE-RNOA = LEV * (RNOA – NBC).
Thus, a firm’s profitability, as measured by ROE, can be constructed as a pure operating contribution OP, plus the contribution from using trade credit TRADE, plus the contribution from financing activities FIN. Further, both TRADE and FIN are products of the amount of leverage, either operating leverage or financial leverage, and the spread between the underlying profitability being levered and the cost of the leverage. Our main variable of interest is FIN. We also study FIN’s components LEV and SPREAD, and how the OP and TRADE components of ROE trade off against FIN as a function of a country’s domestic credit provided by the banking sector.
3. Related Literature
We investigate three issues: a) does a country’s level of domestic credit influence the financial contribution to ROE, b) does the financing contribution increase with the firms’ operating contribution, and is the relation based on a leverage effect or a spread effect, and c)
9 does the level of domestic credit influence the trade-off between the financing contribution and the trade credit contribution? And, for all these relations, does the relative size of the firm in its country matter? These questions touch on a variety of prior work in accounting, finance, and economics that we summarize next.
Why Might Domestic Credit Influence the Financing Contribution to ROE?
One of our main variables of interest is the sum of all available domestic credit granted by banks and similar financial institutions in a country, expressed as a percent of the country’s gross domestic product (a precise definition is given later). This measure is commonly used in the international finance literature as an indicator of the development of a country’s financial system. Because the financing contribution to ROE requires access to debt, the first-order effect is that more domestic credit should be associated with greater leverage, all else equal. In addition, if more domestic credit implies a more competitive market for loans then the net borrowing cost should be lower and the spread should be higher. Because both components of the financial contribution, leverage and spread, are hypothesized to increase with the level of domestic credit, it would seem obvious that the financing contribution should also increase with domestic credit. However, this prediction is complicated by the empirical observation that leverage and profitability are negatively related, as discussed in the next section.
In a study of 19 developed and 11 developing countries, Demirguc-Kunt and Maksimovic (1999) find no evidence that the availability of domestic credit influences the capital structure for the largest firms in a country. For the smallest firms in a country the evidence is mixed, with some specifications suggesting the relation between domestic credit and leverage is positive but other specifications suggesting it is negative. The authors reason that the smallest firms in a
10 country are marginal borrowers and consequently their leverage depends on the development of the banking sector, whereas the largest firms are infra-marginal and consequently have their needs met even in a country with an underdeveloped banking system.
De Jong et al (2008) sample a large panel of firms from 42 countries and find that the association between leverage and firm-specific variables often changes across countries. Two variables, size and profitability, behave consistently, with leverage increasing with size and decreasing with profitability in 38 of 42 countries. They also find that, after controlling for these firm-specific factors, a country’s average leverage increases with the development of the country’s bond market.9
These results suggest two firm-specific factors, size and profitability, and one country-level factor, the development of the country’s ability to provide debt financing, will be related to leverage. Although leverage is only one part of the financial contribution to ROE, these results suggest a starting point for our model.
The Relation between the Financing Contribution and the Operating Contribution to ROE
Recall that the financial contribution to ROE is the product of the financial leverage and the spread between the return on net operating assets and the net borrowing cost. It is almost immediate that the spread is therefore increasing in the Pure Operating Effect (ROOA), as ROOA is a large component of RNOA and RNOA is the positive component of the Spread. Unfortunately, the relation between financial leverage and operating performance is far less clear. The original study is Rajan and Zingales (1995) who find that the determinants of leverage for firms in the G7 countries are basically the same as the determinants found in the US-based literature; leverage generally increases with firm size, asset tangibility, and decreases with the
9 While the bond market development is different than the domestic credit provided by banks, we show later that
11 market-to-book ratio and firm profitability. Booth et al. (2001) undertake a similar study in 10 developing countries and find some support for the same variables used in Rajan and Zingales (1995), but also find that the only consistent result across all countries is that leverage decreases with profitability. This seemingly anomalous result has been documented repeatedly, and we find it in our data as well. Although one might expect that more profitable firms would lever their operating success, the empirical result is that they do the opposite. The most satisfactory explanation for this result is that firms follow the pecking-order theory of capital structure and prefer to fund capital investment first with internally-generated funds, and then with debt, and finally with equity. The pecking order follows the degree of information asymmetry between the capital provider and the firm.10 Consequently, more profitable firms have more internally-generated funds, and therefore need less external funding, and this causes a negative relation between profitability and leverage (see Myers 2001 for a review of theories of capital structure).
Putting the two effects together, we expect that the spread will increase and leverage will decrease with operating performance, resulting in an ambiguous prediction for the relation between the financing contribution and the operating contribution to ROE. Booth et al. (2001) also find that country fixed effects add significant explanatory power beyond the firm-specific variables, suggesting that country characteristics play an important role in understanding leverage ratios around the world.
Does Trade Credit Substitute for Financial Credit in its Contribution to ROE?
Nilsen (2002) reports that for U.S. manufacturing firms, accounts payable averages 13 percent of total liabilities, so trade credit is an important source of funds for many firms. As
10 Recent support for the pecking order theory is in Naranjo et al. (2012) who show that firms increased debt
financing a little, and equity financing a lot, following the adoption of IFRS, presumably because IFRS lowered the information asymmetry between capital providers and firms, especially for equity providers.
12 derived above, the trade credit contribution to ROE is the product of how much operating leverage the firm employs and the spread between the pure return on operating assets and the implied interest rate on the trade credit. Choi and Kim (2005) and Klapper et al. (2011) describe a number of theories of trade credit that address the level of operating leverage but not the spread between the pure operating return and the implied interest rate on the trade credit.
The financing view of trade credit posits that firms with better access to capital will redistribute the credit they receive to less advantaged firms via trade credit. These firms can sometimes play the role of lender better than a bank because they have superior information or better contracting opportunities with the trade partner. Compared to banks, suppliers know the quality of goods provided and the likelihood of downstream sales, and are in a better position to reclaim and resell the inventory in the event of a default. The impact of a country’s level of domestic credit on the level and implied interest on trade credit thus depends on when other constraints bind on this process. One possibility is that more domestic credit flows down through all levels of creditworthiness and increases the use of both financial credit and trade credit; in this case the two types of financing would appear complementary. Alternatively, because the implied interest on trade credit is typically higher than on similar bank financing (Wilner 2000), more domestic credit could lower the cost of bank financing relative to trade credit and cause firms to substitute financial credit for trade credit. Further, assuming that larger firms are generally more creditworthy, they are more likely to be the firms redistributing financial credit downward through trade credit while smaller firms are more likely to be the recipients.
Trade credit also serves non-financial purposes. Petersen and Rajan (1997) argue that trade credit can be used as a mechanism for price discrimination without running afoul of anti-trust
13 laws. Long et al. (1993) posit that trade credit allows the buyer to verify the quality of goods before paying for them, thus resolving some information asymmetry between trade partners. These motives for trade credit are unlikely to be influenced by the availability of domestic credit, and consequently buffer any substitutability or complementarity between financial credit and trade credit caused by the level of available domestic credit. It is likely that these motives for trade credit also differ between large firms and small firms, insofar as small firms may be subject to greater information asymmetry and contracting problems than large firms.
Empirically, the prior results are mixed. For a sample of US firms, Petersen and Rajan (1997) find that trade credit and bank credit are substitutes. However, in a sample covering 39 countries, Demirguc-Kunt and Maksimovic (2001) find that the use of trade credit increases with the country’s availability of domestic credit, concluding that these two sources of financing are complementary.11 Further, in a unique database of 30,000 actual trade contracts from the US and Europe, Klapper et al. (2011) find that non-financial motives for trade credit appear to be the most relevant.
The results above speak to the relative levels of financial and trade credit, but not to the effective spread on trade credit. Consequently, it is unclear how the financing contribution and the trade credit contribution to ROE will be related. In addition, how this relation varies across countries with differing levels of domestic credit will reveal how important the redistributive role of trade credit is in the economy relative to the non-financial motives for trade credit.
11
There is a large literature on how financial crises impact the relative use of financial or trade credit, which also produces mixed results. Several studies find that during market downturns, trade credit flows from firms with better access to bank financing to firms with less access to this financing options (Choi and Kim 2005 and Nilsen 2002). However, other studies find no such redistribution for financially constrained firms (Love and Zaidi 2010).
14 Size Matters
The previous theoretical and empirical work suggests that the relation between the financing contribution and other variables may be conditioned on the relative size of the firm in its home economy. Firms report that this is indeed the case. Based on a survey of 3,000 firms in 48 countries, Beck et al. (2005) find that small and medium-sized firms report that financing is an obstacle to growth in countries with lower levels of domestic credit. These firms report obstacles due to high interest rates, collateral requirements, bank bureaucracy, or lack of available funds for lending; the largest firms in the country report no such obstacles. Using the same survey data, Beck et al (2008) find that the smallest firms use less bank financing in general, and especially in countries with low levels of domestic credit, and that they are not able to adequately substitute leasing or trade credit relative to the largest firms in the economy.
4. The Sample and Descriptive Statistics
We construct our sample from Thomson Datastream and collect financial data for firms in 69 different countries from year 1980 to 2010. We require firms to have sufficient financial data to compute the return on equity, return on net operating assets, and leverage. We eliminate countries with less than 50 firm-years throughout the sample period, firm-years with total assets or net operating assets that are less than zero, and firm-years with market value less than USD 1 million. Finally, consistent with prior financial statement analysis studies, we eliminate firms from the financial industry because the separation of financing and operating activities is artificial for such firms (e.g., Nissim and Penman 2001, Fairfield and Yohn 2001, Fairfield et al 2003, Soliman 2008, Richardson et al 2009, or Li et al 2012). 12 Also consistent with prior
12 Financial industries include all sectors with Industry Classification Benchmark (ICB) codes 8300(banks), 8500
15 studies we eliminate observations with extreme financial ratios. Specifically, we eliminate firms with return on equity or return on net operating assets greater than 100% or less than -100%, and eliminate firms with net borrowing costs greater than 100%. Because there is no obvious threshold for deletion for leverage or spread, we instead truncate extreme values at the 1% and 99% level. The final sample is 51,866 firms (343,718 firm-years) from 69 countries. Table 1 shows a summary of the firm-years used in our analysis.
Our main interest is whether the financing contribution to return on equity increases with financial development in the country. While the financing activities of firms typically include both debt and equity-based financing, only non-equity financing creates the leverage that increases ROE. We therefore use a proxy of financial development that focuses on the development of the banking sector. Following Rajan and Zingales (1998) and a host of other studies in international finance, we measure banking sector development using the level of domestic credit provided by the banking sector from the World Bank’s World Development Indicator (IFS items 22a-22f).13 This measure computes the gross credit provided by monetary authorities, deposit money banks, and other banking institutions (such as savings and mortgage loan institutions and building and loan associations). The measure, labeled DOMC, is scaled by the country’s GDP and is available on an annual basis. For our cross-sectional tests we average DOMC over the three years centered on the current year to minimize the effects of temporary changes in the country’s credit availability or temporary changes in the country’s GDP. For our analysis of large changes in domestic credit in table 7, we use the change in the annual values of DOMC.
13 Other studies that use this measure of financial development include Levine and Zervos (1998), Fisman and Love
(1995), Demirguc-Kunt and Maksimovic (1998), Demirguc-Kunt and Maksimovic (1999), Beck et al. (2000), Cetorelli and Gambera (2001), Beck, T., Demirgüç-Kunt, A., Levine, R. (2001), and Beck and Levine (2004).
16 By lowering financing obstacles, domestic credit provided by the banking sector has been shown to be related to a country’s rate of economic growth (see Fisman and Love 2003 or Levine 2005 for a review). The measure is not perfect for our purposes, however. It is limited to credit availability via the banking sector and may fail to proxy for development of the country’s public bond or international bond market. The World Bank database also includes an annual country measure of bond market borrowing, but this variable is not available for as many years or as many countries, and consists mostly of bonds issued by financial institutions, which are not relevant to our study. As a practical matter, the domestic credit market is three times as large as the bond market for the average country in the average year, and is by far the most commonly used measure of financial market development in the international finance literature. We later test the robustness of our analysis using an alternative measure that adds the size of the bond market to the numerator of our domestic credit measure and find similar results, likely because this alternative measure has a 0.77 Spearman correlation with our measure.14
Table 2 shows the level of domestic credit (DOMC) for all 69 countries in our sample. The mean domestic credit is 0.90 of the country’s GDP. The measure varies significantly across countries ranging from 0.10 of GDP for the lowest country (Saudi Arabia) to 2.95 for the highest country (Japan). This variation can be seen in Figure 1 where we plot the mean domestic credit ordered from smallest to largest. Figure 1 shows that special attention needs to be paid to Japan which makes up 16 percent of the firm-year observations and has the highest level of domestic credit at 2.95. This level is 2.3 times higher than the average country and 20 percent higher than the next highest country. Our tests partly control for this by constructing firm size portfolios
14 A country’s financial development can also be measured by the development of its equity market (see Levine and
Zervos 1998). However, as the Dupont model shows, equity does not create financial leverage and so is not relevant to our study.
17 within country, and then pooling across countries. In additional analysis we also show that our results are very similar when we eliminate Japan from the sample.
Recalling the decomposition of ROE from the previous section, Table 3 Panel A shows the distribution of each component of ROE using all firm-years. The mean ROE is 6.3% and the largest component of ROE is OP, followed by TRADE, and then FIN. The mean OP is 6.6% and the mean and median of FIN are both negative at -2.5% and -0.5%, respectively. It is not surprising that OP is the largest component – the primary way a firm generates a return on equity is through its operations. It is surprising that FIN is negative for the average firm and close to zero for the median firm. It is worth noting that both leverage and spread are positive on average while FIN, which is the product of leverage and spread, is negative. This suggests that a considerable amount of companies have the opposite sign for leverage and spread. That is, firms with negative leverage (i.e., firms that hold more cash than debt) often have positive spread, and those with positive leverage tend to have a negative spread (i.e., net borrowing costs exceed their RNOA). Indeed, the Spearman correlations in Table 4 confirm a negative correlation between leverage and spread of -0.385.
The Contributions to ROE within and across Countries
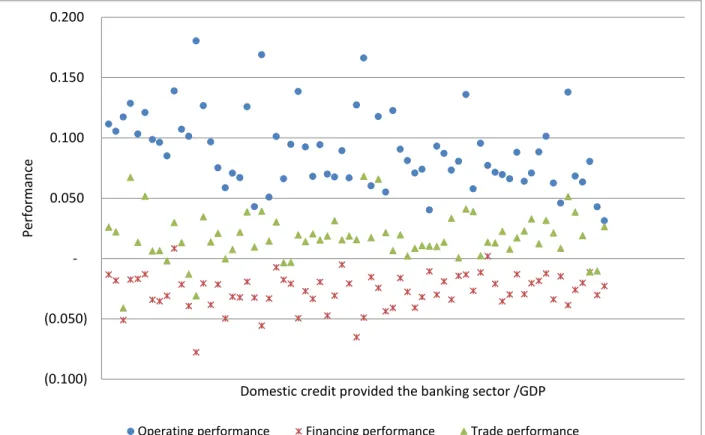
We are interested in how the contribution of financing decisions to a firm’s ROE varies by the home country’s financial development. To begin, consider the averages of OP, TRADE, and FIN for each country, sorted on the country mean domestic credit (DOMC) over the sample period. The results are shown in Figure 2. Three observations are immediate. First, across all levels of DOMC, the largest component of ROE is OP, followed by TRADE, and then by FIN. Operating activities are the primary way a firm generates a return on equity and it is on average
18 positive for all countries. As noted, it is surprising that FIN is negative for the average firm in all but two countries. On average in almost all countries, firms’ financing activities do not contribute positively to their ROE. However, the average result hides the enormous variation in FIN.
The standard deviation of the average FIN across countries is only 0.016 (Table 2), while the average standard deviation of FIN within country is 0.106 (untabulated). There is far greater variation in FIN across firms within a country than there is variation in the average FIN across countries. This suggests that the development of financial markets in a country is not the primary driver of the average firm’s ability to generate FIN. But that is not to say that DOMC is unimportant. In subsequent tests we explore how DOMC influences the contribution of FIN in the cross-section of firms within a country. And, because the finance literature has generally concluded that a country’s financial development is an important contributor to its growth through increased debt financing, we reconcile these positive findings with our negative ones in a later section.
The second observation from Figure 2 is that TRADE is generally positive, contributing almost two percent to ROE, on average, across all countries. So the average firm can successfully leverage their operating performance using trade credit. This value too has variation. The standard deviation of the average across countries is 0.019 (Table 2) while the average standard deviation within country is 0.066 (untabulated). In subsequent tests we examine the relation between FIN and TRADE, and how DOMC and firm size influence the substitutability between these two sources of credit.
Third, the average OP varies across countries considerably more than FIN and TRADE. The average level of OP across countries is 0.089 with a standard deviation across the country
19 averages of 0.032, almost twice as large as the variation in FIN and TRADE (as seen at the bottom of Table 2). Finally, like the other measures, there is more within country variation in OP (0.091, untabulated) than across-country variation. Because the success or failure of a firm’s operations has a direct effect on its ability to successfully employ leverage to increase its ROE, we control for OP in all our regressions. In addition, different countries may have a different mix of industries, and Soliman (2004) shows that the Dupont decomposition varies systematically with industries, so we include industry fixed effects in all our regressions.15 Similarly, some years are simply more profitable for all the world’s economies than others, so we also include year fixed effects in all our regressions.
Descriptive statistics by the relative size of the firm
Prior literature has emphasized the importance of DOMC to a country’s ability to use leverage. But given our observation that FIN is generally negative, and most of the variation is within country, the real question is, does DOMC help some firms in a country more than others? To test this, we estimate the relation between DCOM and FIN for samples that include large, medium, and small firms.
Many of the relations we document, and especially the impact of credit availability on financial performance, vary significantly with the relative size of the firm within its country. In the results that follow we report the pooled estimates and then the estimates for the smallest, middle, and largest terciles of size, where size is measured as the total assets at the end of the fiscal year. For our primary tests we sort firms into terciles within country-year and then combine the terciles. This procedure groups together similarly ranked firms relative to the other
15 In contrast to Soliman, (2004), Fairfield et al. (2009) find that industry membership is not a useful guide for mean
reversion in ROE or RNOA in a sample of US data. We still include industry fixed effects because we are examining finer components of ROE, and because we are examining global data.
20 firms in their country. So, for instance, the largest firms in Italy are grouped with the largest firms in Japan. This method of matching the relative size of firm within its country is consistent with Demirguc-Kunt and Maksimovic (1999). It is motivated by the idea that the largest firms in a country have the greatest access to financial markets and institutions in their respective countries, regardless of their absolute size, while the smallest firms in the country may have limited access.
Table 3 presents summary statistics by size terciles. Panel A shows summary statistics for the pooled sample while Panels B and C shows summary statistics for smallest and largest firms, respectively (we omit the middle tercile in the summary statistics for brevity). Comparing panels B and C, large firms have higher ROE, OP, FIN, SPREAD, and LEV compared to small firms. The average FIN is negative for both large and small firms, consistent with Figure 2, but the median FIN is slightly positive for large firms. In our main empirical tests, we examine whether the country’s financial development has a differential effect on FIN across different firm sizes.
Table 4 shows the correlation matrix of the Dupont components for the full sample, the smallest tercile and the largest terciles, in Panels A, B, and C, respectively. As seen in Panel A, domestic credit is negatively related to OP and positively related to FIN and TRADE. The positive correlations with FIN and TRADE are suggestive that the financing components of a firm, either through financial credit or trade credit, are related to the development of the country’s banking sector. One of the more noticeable differences between Panels B and C is that the correlation between OP and FIN is negative for small firms and positive for large firms. This positive correlation for large firms, however, is not due to a more positive correlation between OP and LEV or OP and SPREAD. In fact, large firms have a more negative correlation between OP and LEV and a less positive correlation between OP and SPREAD relative to small firms.
21 Instead, the positive relationship between OP and FIN for large firms is because there is a greater portion of firms sharing the same sign for LEV and SPREAD than for small firms. That is, among large firms it is more likely that firms with positive (negative) LEV have also positive (negative) SPREAD.
The differences in relations between the components of ROE between large and small firms seen in table 4, and the strong impact that OP has on the other components, make it clear that these influences need to be accounted for in our regression analysis.
5. Regression analysis
Our main regression results are organized as follows. First, we study how domestic credit (DOMC) directly influences the financial contribution to ROE (FIN) and how firm size plays a central role in understanding the contribution of DOMC. Second, we examine the relation between the pure operating contribution and the financing contribution, and how OP influences the two components of FIN. Finally, we examine how firms trade-off the different financing activities (TRADE and FIN) and how DOMC influences a firm’s trade-off between these contributions to ROE.
The direct impact of domestic credit on financial performance
We examine whether the availability of credit in a country allows some firms to benefit from FIN more than others. To test this, we estimate the following regression:
22 Standard errors are clustered at the country and year level.16 The results are in Table 5 Panel A. Column 1 gives the results for the pooled regression. We find that, controlling for OP, TRADE, and the industry and year fixed effects, financial performance (FIN) increases with the country’s domestic credit. Dividing the sample by the relative firm size, the coefficient on DOMC ranges from 0.005 for the smallest firms in the county to 0.014 for the largest firms in the country, as seen in columns 2-4. To get a sense for the economic magnitude, increasing DOMC by one (the approximate difference between the United States and Ireland) has an estimated impact of increasing FIN by 1.4 percent for the largest firms in the economy, but only 0.5 percent for the smallest firms in the economy. While previous literature has shown how improvements in a country’s financial markets benefit the growth rates of small firms more than large firms, we find that this result does not apply to the profitability of those firms.
Does more domestic credit increase FIN because firms take on more leverage? This would seem to be the obvious interpretation, but recalling that LEV and SPREAD are negatively correlated, the answer is unclear. To understand the source of improved contributions from financing activities, we re-estimate the regression replacing FIN with each of its components, LEV and SPREAD, with the results in Panels B and C of Table 5, respectively.
Panel B of Table 5 shows that, for the full sample and for the three size terciles, LEV is not significantly related to DOMC. These tepid results are consistent with Demirguc-Kunt and Maksimovic (1999) who find no robust relation between DOMC and LEV for either large or small firms. In contrast to the results in Panel B, Panel C of Table 5 shows a large and significant relation between DOMC and SPREAD that is relatively stable across all three size terciles; in the pooled regression the coefficient of 0.019 implies that a one unit increase in DOMC increases the
23 SPREAD by 1.9 percent. The reason FIN increases much less than the increase in SPREAD is because SPREAD and LEV are negatively correlated at the -0.385 level (with similar values in each size tercile). So a complete picture for the pooled sample looks like this: a one unit increase in DOMC increases SPREAD by 1.9 percent, but an increase in SPREAD is associated with a lower level of LEV, with the net result that FIN only increases by 0.7 percent.
In untabulated results we divide the sample into those firms with positive versus negative LEV and re-estimate the leverage regression above. Perhaps not surprisingly, for the sample of firms that are net borrowers (i.e. positive LEV), these firms take on greater leverage in countries with higher DOMC. Moreover, the effect is marginally stronger as the firm size increases. Nonetheless, even for the subsample of firms with positive LEV, the economic magnitude on LEV is modest. The mean LEV for the full sample is 0.543, and increasing DOMC by one unit results in an estimated increase in LEV of only 0.018. In sum, firms in countries with higher DOMC enjoy a higher contribution from financing, but this is not because they take on significantly more leverage; rather, they enjoy a higher spread between their RNOA and the net borrowing cost. A possible explanation for this is that countries with relatively more available credit have lower net borrowing costs due to greater competition between banks. Consistent with this, we find that the Spearman correlation between DOMC and net borrowing costs is -0.21 (untabulated).
The relation between the pure operating contribution and the financing contribution to ROE The regressions in Table 5 include OP as a control variable because the bulk of the variation in SPREAD is due to OP (see Table 4 Panel A), and so one would think that increases in OP would increase SPREAD and consequently increase FIN. That is, when the firm is
24 leveraging more profitable operations the impact of the leverage on FIN should be increased. The evidence in Table 5 shows that the relationships are more complicated. In particular, why is the coefficient on OP in the pooled regression only 0.070, meaning that a one percent increase in OP implies a mere 0.07 percent increase in FIN? Further, examining columns 2-4 we find that the coefficient on OP is insignificantly negative for the smallest firms in their economy, a significant but modest 0.070 for the middle-sized firms, and a more robust and significant 0.371 for the largest firms. To understand these effects, we need to again consider the components of FIN in the regressions given in Panels B and C of Table 5.
As documented in prior literature, Panel B of Table 5 shows a modest but significant negative relation between LEV and OP. The coefficient is the most negative for the largest tercile of firms at -2.220. A one percent increase in OP is associated with a 0.022 decrease in leverage (relative to a grand mean of 0.543). The relation is even smaller for the middle tercile, and is insignificantly negative for the smallest tercile of firms. So, OP has either no effect or a negligible negative effect on LEV. Turning to SPREAD, Panel C of Table 5 shows that the relation between OP and SPREAD is positive, and declines only slightly as firm size increases. A one percent increase in OP is associated with a 0.927 percent increase in SPREAD for the smallest tercile of firms, a 0.898 percent increase for the middle tercile of firms, and a 0.841 percent increase for the largest tercile of firms. Regardless of firm size, most OP flows through to SPREAD. Putting the results together, for the relatively largest firms in the economy, a one percent increase in operating contribution is associated with an almost equivalent increase in spread, but also causes the firm to use less leverage, such that the spill-over effect on the financing contribution is only 0.371 percent. For the smallest firms in the economy, the result is more complicated. For a one percent increase in OP, the smallest firms have the largest increase
25 in spread and the smallest reduction in leverage, and yet the contribution from OP that spills over to FIN is not significantly different from zero. This occurs because 43 percent of the smallest firms have negative leverage (untabulated), so for these firms an increase in spread is combined with negative leverage to produce a reduction in the financial contribution. This is enough to wash out the positive effect that OP has on SPREAD when LEV is positive.
In summary, we find a weakly negative relation between operating performance and leverage, consistent with the prior literature, with the strongest relation among the largest firms in the economy. However, this does not imply a negative relation between operating performance and financial performance. The largest firms in the economy enjoy a modest positive spill-over effect from operating performance to financial performance, despite their reduction in leverage.
The trade-off between the financing contribution and the trade credit contribution to ROE
Figure 2 shows that the contribution to ROE from trade credit (TRADE) is generally positive. It is possible that by considering only debt financing (FIN) and not TRADE, we are underestimating the contribution of all financing activities to ROE. Firms could engage in financing activities that contribute to performance through trade credit, and perhaps increasingly so when firms are in countries with a less developed banking sector (DOMC). We ask whether firms substitute between FIN and TRADE, how perfect the substitution is, and how the availability of domestic credit determines which firms get the benefits of trade credit within a country.
First we return to the estimated results in Table 5. Panel A shows the association between the financing contribution (FIN) and the trade credit contribution (TRADE) after
26 controlling for the pure operating contribution (OP). If FIN and TRADE are perfect substitutes, the coefficient on TRADE should be negative one. For the pooled regression in Column 1, the estimated coefficient on TRADE is -0.504, suggesting a strong trade-off between FIN and TRADE, although the substitution is far from perfect. Columns 2-4 show that magnitude of the trade-off is relatively insensitive to the size of the firm. A one percent increase in TRADE corresponds to a 0.483 percent decrease in FIN for firms in the smallest tercile and a 0.557 percent decrease for firms in the largest tercile. However, when we condition the relation between FIN and TRADE on the availability of domestic credit, the relative size of the firm becomes important.
To examine whether DOMC influences the rate of substitution between FIN and TRADE we add an interaction term between DOMC and TRADE in equation (2). Table 6 shows the results. Column 1 shows that for all firms combined, the estimated coefficient on DOMC*TRADE is -0.110, indicating that the substitution between FIN and TRADE gets closer to negative one as DOMC increases. Recall that the range of DOMC across all 69 countries is 2.85, and the difference between Ireland and the United States is approximately one. The regression indicates that increasing DOMC by one changes the rate of substitution between FIN and TRADE by a substantial -0.110. Firms in countries with more available domestic credit substitute more freely between trade credit and financial credit. This finding is at odds with the arguments in Fisman and Love (2003) claiming that the substitution between trade credit and financial credit should be greater in countries with less financial development.17 One reason we find the opposite relation might be that countries with little available domestic credit might also have more agency and information asymmetry problems between supplier and customer, and
17 Fisman and Love (2003) do not test the hypothesis that DOMC influences the relation between TRADE and FIN.
27 trade credit provides a mechanism to resolve these problems. For instance, Biais and Gollier (1997) argue that the extension of trade credit reveals favorable information to other lenders, thereby increasing their willingness to lend and this positive source of correlation works against the perfect negative substitution between trade credit and financial credit.
As further evidence on this point, one might expect that the smallest firms in the economy are subject to the greatest agency and information asymmetry problems. If this is the case then the degree to which these forces work against a perfect substitution between financial credit and trade credit should be greatest for the smallest firms. Consistent with this, we find that the coefficient on TRADE becomes uniformly more negative as the firm size increases across Columns 2 to 4 in Table 6. Further, we find that improvements in DOMC significantly affect the trade-off between FIN and TRADE for the smallest and middle terciles of firms, but have no effect on the largest firms in the economy. For small and mid-size firms, as DOMC decreases, there is a weaker trade-off between FIN and TRADE (i.e. the coefficient gets further from negative one). We do not observe such a relationship for large firms, perhaps because for large firms there are fewer information asymmetry or agency issues to be resolved. Overall, the findings suggest a substitution effect between FIN and TRADE that depends on the availability of domestic credit in the country and the extent of the agency and information problems as represented by the firm’s relative size in the economy.
Large changes in domestic credit
So far all our results have been in the cross-section. We used industry and year fixed effects and so the results should be interpreted as being relative to other firms in the same industry and year. We also clustered standard errors at the country and year level to account for
28 within country and within year residual correlation. Nonetheless, any cross-sectional analysis is subject to the criticism that the independent variables are only proxies for other persistent omitted variables that drive the true relations. To address this concern, we examine the relation between annual changes in FIN and changes in the independent variables. Any persistent omitted variable should be cancelled out in this design. Because our main variable of interest, DOMC is itself relatively persistent, we focus on the country-years in the top or bottom 10 percent of annual changes in DOMC. For the top decile this corresponds to a 17 percent average increase in DOMC involving 216 country-years and for the bottom decile this corresponds to a 10 percent average decrease in DOMC involving 209 country-years.18
Because changes in the availability of domestic credit will take time to flow through to firms’ financing decisions and the financing contribution to performance, we associate the change in DOMC in year t with the change in FIN in year t+1. However, we still need to control for the concurrent operating performance and trade performance, so we include in the regressions the changes in OP and TRADE in year t+1. As before, we cluster the regression standard errors by country and year.
As a starting point, Panel A of Table 7 shows that the Spearman correlation between the change in DOMC and the next year’s change in FIN are positively correlated. The change in DOMC is also correlated with the future change in OP and TRADE, but because changes in OP and TRADE are highly correlated, it is hard to identify the marginal relation. Panels B and C present the main regression results. Because the underlying economic factors that precipitate
18 Country-years included in the bottom decile often represent periods of financial crises. For example, Argentina
and Brazil experienced a large drop in DOMC (-59% and -58% respectively) in 1990. Both countries suffered a sovereign debt crisis in 1990. Brazil in 1994 and Mexico in 1996 are included in the bottom decile sample and coincide with the banking crisis years (Kaminsky and Reinhart 1999). Country-years in the top decile often represent credit expansion years immediately following a crisis. For example, South Korea in 1998 (immediately after the Asian crisis) is included in the top decile sample.
29 large increases in domestic credit are likely to be different from the factors that precipitate large decreases, we estimate separate regressions for each.
The results in Column 1 of Table 7, Panels B and C, are remarkably consistent with the cross-sectional results in Tables 5 and 6. For both DOMC increases (Panel B) and DOMC decreases (Panel C), the pooled results in Column 1 show that the future change in FIN is positively associated with the current change in DOMC. The estimated size of the effect is small, although highly significant. When countries experience large increases or decreases in available domestic credit, the firms in the economy respond with different financing decisions and experience the associated changes in the financing contribution to ROE from those financing decisions.
The results for the other change variables also echo the cross-sectional conclusions. For both subsamples, the future change in FIN is positively related to the concurrent future change in OP, and negatively related to the concurrent future change in TRADE, as seen in Panels B and C. The relation between OP and FIN, now measures in concurrent annual changes, is noticeably larger for the biggest tercile of firms in the economy than for the smallest firms. For the large increase subsample in Panel B, the coefficient of 0.601 on the change in future OP shown in Column 4 implies that, for the largest firms in the economy, just over 60 percent of the change in OP spills over to a change in FIN. This figure is reduced to 25 percent for the smallest firms in the economy. There is a similar pattern in the subsample of large DOMC decreases, although the coefficient estimates are smaller.
The results for the change in TRADE also resemble the cross-sectional results. In the pooled model given in Column 1, for both subsamples, future changes in TRADE are negatively associated with future changes in FIN. For both subsamples in Column 1, the coefficient is
30 about -0.57, implying that the trade-off between TRADE and FIN is less than perfect, but certainly significant. A one percent increase in the contribution from TRADE is associated with roughly a -.57 decrease in FIN. Looking at Columns 2-4 in Panels B and C, we see that this relation does not vary much with the size of the firm. It moves slightly more towards perfect substitution as firm size increases in the large increase subsample shown in Panel B, but has no clear pattern in the large decrease subsample in panel C.
In sum, for large increases or decreases in available domestic credit, the relations we find between future changes in the financing contribution and the other variables are remarkably consistent with the cross-sectional results reported earlier. Changes in the future financing contribution to ROE are positively related with changes in domestic credit, positively related with changes in the operating contribution, and negatively related to changes in the contribution from trade credit.
Sensitivity analysis
Excluding Japan
As previously discussed, companies from Japan constitute a large portion of our sample and, at the same time, Japan has the highest level of available domestic credit. To ensure that our results are not unduly influenced by Japanese firms, in Table 8, Panel A we exclude all firms from Japan and re-estimate our regressions. The results are very similar to those reported in Table 5. The coefficient on DOMC increases monotonically from Column 2 to Column 4. Domestic credit availability has no effect on the financial contribution for the smallest firms in the economy but for largest firms a one unit increase in DOMC generates a two percent increase
31 in the financing contribution to ROE. Also consistent with our prior results, Table 8 Panel A shows that increases in OP flow through to increases in FIN, at least for the middle and largest firms in the economy, and there is a partial substitution between TRADE and FIN that is relatively insensitive to firm size.
Including Bond Market Data
Our DOMC measure captures the depth of credit availability in the banking sector and is the most common measure of a country’s financial development used in the prior literature. However, the measure does not include financial credit from publicly issued corporate bonds. The two measures of financial credit are highly correlated (0.77), but to the extent that firms gain debt financing from corporate bond markets, and this is not perfectly correlated with the amount of bank credit in country, DOMC has measurement error. As discussed earlier, there is no good solution to this problem. The only country-level measure of bond issuances mixes together bonds issued by financial and non-financial firms, but our study excludes financial firms because the distinction between operating and financing activities does not apply to financial firms. Nonetheless, we repeat the analysis after adding the bond market data to the domestic credit data and then scaling by GDP. In Table 8, Panel B we report the result of estimating equation (2) after replacing DOMC with our alternative measure. Again, the results are very similar to the results in Table 5. The coefficient on DOMC increases monotonically from Column 2 to Column 4, although compared to Table 5 the economic size of the effect is slightly reduced.
32 Throughout our analysis, we have decomposed ROE into its operating, financing and trade components assuming that the underlying accounting items are comparable across countries. This is a simplification because different countries have different accounting regimes and so the OP, TRADE and FIN ratios do not measure precisely the same thing in each country. To see if this is a significant source of noise in our model, in Table 8 Panel C we restrict our analysis to country-years that report under either IFRS or US GAAP.19 As seen in the table, the results are similar to those reported in Table 5 suggesting that a lack of accounting comparability does not influence our inferences significantly. As before, the coefficient on DOMC increases monotonically and, for the largest firms, a one unit increase in DOMC is associated with a 2.1 percent increase in the financing contribution to ROE. The results for OP and TRADE are also similar in magnitude and significance to those reported in Table 5.
6. Conclusion
What does this teach us that might be useful for financial statement analysis? Where a firm resides, and its relative size in that country, has a major impact on how the firm’s profitability is affected by its financing activities. Large firms in countries with well-developed banking systems enjoy the largest financing contributions to ROE. This occurs despite the fact that they lower their leverage as their operating profit increases. The largest firms also come the closest to a perfect substitution between trade credit and financial credit, and this financial flexibility is not limited to the most well-developed countries.
19 Even though the US has not adopted IFRS, after 2005 US GAAP converged significantly with IFRS (Hail et al.
33 In contrast, the smallest firms gain the least from financing activities, regardless of the development of their home country’s banking system. In fact, because they often have negative leverage, increases in their pure operating profit actually lower the financing contribution to ROE. The development of the banking system has a significant impact on the ability of the smallest firms to substitute trade credit for financial credit, but in an interesting direction. While one might hypothesize that the smallest firms in countries with little domestic credit are forced to substitute more trade credit for the lack of available bank credit, we find the opposite; the substitution becomes more perfect as the banking system becomes more developed. We posit that this is due to changes in the non-financial purposes of trade credit as available domestic credit increases.