NIST Standard Reference Database 1A
NIST/EPA/NIH Mass Spectral Library (NIST 14) and
NIST Mass Spectral Search Program (Version 2.2)
For Use with Microsoft
®Windows
User’s Guide
The NIST Mass Spectrometry Data Center
Stephen E. Stein, Director
Evaluators:
Anzor Mikaia, Principal Edward White V (EI) Vladimir Zaikin (EI) Damo Zhu (EI)
O. David Sparkman (EI) Pedatsur Neta (MS/MS) Igor Zenkevich (RI)
Programmers: Peter Linstrom Yuri Mirokhin
Dmitrii Tchekhovskoi Xiaoyu Yang
Documentation and Help: W. Gary Mallard
O. David Sparkman
May 2014
U.S. Department of Commerce
National Institute of Standards and Technology Standard Reference Data Program
The National Institute of Standards and Technology (NIST) uses its best efforts to deliver a high-quality copy of the Database and to verify that the data contained therein have been selected on the basis of sound scientific judgment. However, NIST makes no warranties to that effect; and NIST shall not be liable for any damage that may result from errors or omissions in the Database.
© 1987, 1988, 1990, 1992, 1994, 1995, 1996, 1997, 1998, 1999, 2000, 2001, 2002, 2005, 2008, 2011, 2014 copyright by the U.S. Secretary of Commerce on behalf of the United States of America. All Rights Reserved.
No part of this Database may be reproduced, stored in a retrieval system, or transmitted, in any form or by any means, electronic, mechanical, photocopying, recording, or otherwise, without the prior written permission of the distributor. Portions of this program are also copyrighted by Microsoft Corp. and © 1984–1996 FairCom Corporation.
.
Microsoft is a registered trademark of Microsoft Corporation, and Windows is a trademark of Microsoft Corporation. ISIS is a trademark of MDL Information Systems, Inc. "FairCom" and "c-tree Plus" are trademarks of FairCom Corporation and are registered in the United States and other countries. All Rights Reserved.
Certain trade names and company products are mentioned in the text to
specify adequately the computer products and equipment needed to use this
software. In no case does such identification imply endorsement by the
National Institute of Standards and Technology of these computer products
and equipment, nor does it imply that the products are necessarily the best
available for the purpose.
Contents
Installation ... 1
OS Compatibilities ... 2
Features in NIST 14 Library and the MS Search Program ... 3
NIST 14 ... 3
Version 2.2 of the MS Search Program ... 3
GC Methods / Retention Indices Library ... 4
The NIST MS/MS Library ... 5
Software Changes from earlier versions of the Search Program ... 7
Version 2.0g of the MS Search Program ... 7
Version 2.0f of the MS Search Program ... 8
Guide to the Program ... 9
The Lib. Search Tab ... 10
Title Bar, Tool Bar, and Status Bar ... 16
Neutral Loss Display ... 18
The Other Search Tab ... 19
The Names Tab ... 21
The Compare Tab ... 22
The Librarian Tab ... 22
Spectral Analysis Utilities for NIST 14 ... 23
Automated Mass Spectrometry Deconvolution and Identification System (AMDIS) ... 23
MS Interpreter ... 24
Example Searches ... 27
Library Spectrum and Structure Searches ... 27
Library Search Options ... 30
MS/MS ... 30
Libraries ... 30
Retention Index Data ... 31
Automations ... 33
Limits ... 33
Constraints ... 33
The Search Menu (displayed by Selecting Search on the Menu Bar) ... 34
Search by Any Peaks... 35
Exact Mass Search ... 38
Search by Name - Browse ... 39
Sequential Method ... 39
Basis for Interpretation of the Library Search Results ... 40
Substructure Information ... 41
Example of the Use of Substructure Information in Making Determination about an Unknown Mass Spectrum obtained by using CID ... 43
Use with Instrument Data Systems ... 44
Use with Third-Party Drawing Programs ... 47
User Libraries ... 48
NIST Text Format of Individual Spectra... 51
Import and Export of Retention Indices with a Spectrum ... 52
RI Export with a Spectrum in a MSP or JCAMP file ... 52
RI Import with a Spectrum in a MSP or JCAMP file ... 53
APPENDIX 1: Creating AUTOIMP Files Used in NIST MS Search ... 54
APPENDIX 2: Using the NIST MS Search Program with ChemStation ... 55
APPENDIX 3: Copy ChemStation and Other Database to NIST User Library Format ... 58
APPENDIX 4: Using the NIST MS Search Program with Thermo Fisher Corporation Xcalibur Software ... 61
APPENDIX 5: Search Algorithms ... 62
Screening ... 62
Search ... 63
APPENDIX 6: Syntax for Some Constraints in Searches ... 64
Syntax of Name Fragments Constraint ... 64
Syntax of Tags in Comment Constraint ... 64
Tags in Comment Constraint for MS/MS Text Information ... 68
MS/MS Instrument Type Constraint ... 69
APPENDIX 7: Contributing EI Mass Spectra to the NIST/EPA/NIH Mass Spectral Library ... 70
Installation
Windows NT 4.0, Windows 2000, Windows XP, Windows Vista, Windows 7, 8, 8.1
Select the Start button on the lower left of the screen. Then select Run from the Start menu. (under Windows 8 or 8.1, open Windows Explorer and run setup.exe from the CD)
Assuming the CD-ROM drive is D, type D:\SETUP.EXE and selectOK. If the CD-ROM drive is a device other than D, replace D with the appropriate drive letter.
Follow the instructions presented by the SETUP program.
In upgrading from a previous version of the NIST MS Library, there is a possibility to keep both versions.1 The Installer may behave differently under Windows Vista, 7, 8, 8.1 due to User Account Control security features.
Note: AMDIS, MS Interpreter, and Lib2NIST are not compatible with Windows NT 4.0.
1
In upgrading from a previous version, the Database and Programs will be overwritten by default. To avoid this, (1) the Database should be installed in a new folder, and (2) a new Program Folder should be selected for the Start Programs shortcuts.
(1) To retain the previous version of the NIST MS Search Program and its associated Database, select No in the Question dialog box below.
Question dialog box: Select overwriting the previous installation, or retain the previous installation and install NIST 14 in a new folder.
(2) When the dialog box shown below appears, the name of the Program Folder must be changed to NIST 14 Mass Spectral Database. If this is not done, the contents of the existing Program Folder, NIST Mass Spectral Database, will be overwritten, and the previous version of MS Search and its Database will no longer be accessible from the Start menu.
The name of the Program Folder must be changed if a previous version of MS Search and its Database are to be retained.
OS Compatibilities
NIST 14 and MS Search are NOT compatible with Windows 3.x, 95, 98, Me, NT 3.x
NIST 14 and MS Search are fully compatible with Windows 2000, XP, Vista, Windows 7 (XP, Vista, and Windows 7 in both 32- and 64-bit editions) and Windows 8.
NIST 14 and MS Search are partially compatible with Windows NT 4.0. Only NIST MS Search, which provides access to NIST 14 MS Library, will work. NIST 14 version of AMDIS, MS Interpreter, and Lib2NIST are not compatible with Windows NT 4.0. Also needed are:
Adobe PDF reader to access the NIST 14 Manual
WinNT4Sp3+MSIE4.0/4.01/4.01SP1+hhupd.exe or WinNT4Sp6+MSIE4.01SP2 or later version of IE to access NIST MS Search html Help
Windows NT 4.0 SP1 and WinNT4Sp3+MSIE4.01Sp1+hhupd.exe under MS Virtual PC 2007 are the earliest versions of Windows that NIST 14 and MS Search have been tested with.
The latest version of AMDIS known to be compatible with Windows NT 4.0 SP1 and MS Search as distributed with NIST 14 is version 2.64 (build Jan. 13, 2006).
Features in NIST 14 Library and the MS Search Program
NIST 14
The 2014 version of the NIST/EPA/NIH Mass Spectral Library(NIST 14) contains four mass spectral libraries and a Library of retention index (RI)/GC Method. There are two EI Libraries, mainlib and
replib.The number of compounds with GC Methods/RI Library in the EI MS Library (mainlib) is 56,216.
Contents of the NIST/EPA/NIH (NIST 14) Mass Spectral Library
Library
Name Library Description Library Contents
mainlib Main EI MS Library 242,466 spectra
replib Replicate spectra
Library 33,782 spectra
nist_msms MS/MS Library of small molecules 193,119 MS/MS spectra for 41,752 ions nist_msms2 MS/MS Library of commercial peptides 41,165 MS/MS spectra for 3,546 ions
nist_ri Retention Index Library 387,463 RI values for 82,868 compounds
Version 2.2 of the MS Search Program
Whereas the basic software has not changed since version 2.0g distributed with NIST 11, there have been a number of important features added. These are summarized below.
Features Relevant to Electron Ionization Mass Spectra (Low Resolution)
Use of Retention Index in library searching: Deviation of experimental RI from the library value optionally used to penalize the Match Factor.
Older user libraries with RI values can be indexed to allow the RI values to be used in library searching
Display RI values in a hit list column
Import, export, and edit compound RI value(s)
New definitions of derivatives are used for finding replicate spectra Optionally display derivative precursor in the Lib. Search hit list Features Relevant to All Mass Spectra
All small molecule mass spectra in NIST libraries have InChIKeys linked to PubChem (NIH). These InChIKeys may also be used for searching compound information on the Web or for exact structure searches within NIST libraries.
Set Prepend/Overwrite/Ask automatic mass spectrum import option.
Import and display Glycan structures in KEGG Chemical Function (KCF) format and add them to user library mass spectra
Features Relevant to Tandem and High Resolution Mass Spectra Display additional MS/MS information in hit lists
In-source tandem spectra or EI with accurate m/z spectra - High resolution mass spectra
o Import of ‘in-source/EI with accurate m/z’ spectra, which do not include a defined m/z of the precursor ion. To import these spectra, select "In-source /EI (accurate m/z)" in Spectrum Import Options.
o In-source/EI with accurate m/z spectra have accurate ion peak m/z and intensities. The accuracy is set in Spectrum Import Options.
o In-source/EI with accurate m/z spectra may be searched in In-source/EI with accurate m/z and/or MS/MS library with the new In-source HiRes search (ion peak m/z tolerance down to 0.015 ppm or 6x10⁻⁵ m/z units), Similarity Simple, Identity Normal or MS/MS Presearch OFF search options. For this purpose, adding Reverse Search option may useful.
o In-source/EI with accurate m/z spectra may be added to a user library. Currently, in-source/EI with accurate m/z spectra added with NIST MS Search to a user library may be searched with In-source HiRes search only with Presearch OFF option. Rebuild the library with Lib2NIST to get in-source HiRes search benefits2.
A new MS/MS search for small molecules
o Improved ability to identify compounds with a few dominant peaks – a common situation for Tandem MS.
o More robust scoring for spectra acquired on imperfectly-tuned instruments New Mass Spectrum Import Options
o Control the number of decimal places in the input m/z
o Set peak intensity threshold
o Import in-source or EI spectrum with accurate ion peak m/z and intensities.
o Import MS/MS and in-source/EI with accurate m/z spectra from JCAMP files (October 2012, nistms32.dll version 2.1.5.3 or later)
GC Methods / Retention Indices Library
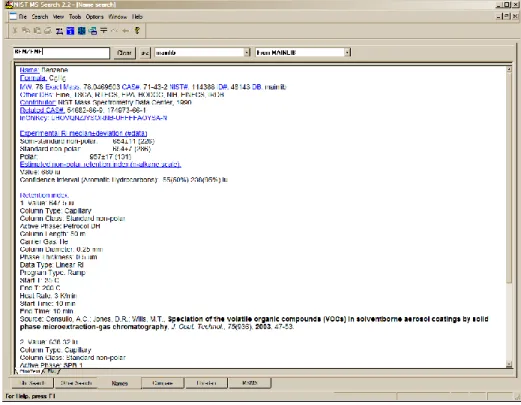
The GC Methods/Retention Indices library has been extended by including summary statistical analysis of all data in the record. This information will be displayed in the spectrum text information even if the Retention Indices box is unchecked in the properties box. The summary data are given in terms of the type of column (standard non-polar(DB-1), semi-standard non-polar(DB-5), or
polar(carbowax)), the median value of the retention data for that column type, the deviation and the number of experimental determinations. Note the deviation is calculated as the median absolute deviation. In the example below (for 6,6-Dimethyl-2-methylenebicyclo[3.1.1]heptan-3-ol or pinocarveol ), there are 13 values for the DB5 series of data, 9 for the DB 1 and 12 for the polar column with median absolute deviaions of 4,7 and 8 respectively.
Experimental RI median±deviation (#data) Semi-standard non-polar: 1138±4 (13) Standard non-polar: 1135±7 (9) Polar: 1654±8 (12)
The data will also optionally be shown in the hit list, and the column that will be shown is user selectable.
The Retention Indices checkbox controls the display of the detailed experimental data. The number of GC Methods/Retention Indices displayed is controlled by selecting All or First and entering the
2
number of values to be displayed. The default is to display the first two values. Displaying all values will cause the display to be slow if there are a very large number of literature values.
In addition, for many compounds, an Estimated Kovats Retention Index will be displayed based on the structure associated with the spectrum. These values are reported in index units (iu) with a confidence interval; e.g., “Confidence interval (Ketones): 57(50%) 246(95%) iu” reported for acetone. This means that there is a 50% probability the true value falls within 57 iu of the estimated value and 95% of the time the true value falls within 246 iu of the estimated value. The analysis is based on error measurements of all the data for the class of the compound given; i.e., in this example, ketones. These estimates only display if Retention Indices has been checked in the properties box. The estimates are not displayed in hit lists. If spectra in a user library have associated structures, an Estimated Kovats RI may also be listed for these spectra if the calculation is possible.
The NIST MS/MS Library
MS/MS spectra, along with an increased number of fields relevant to MS/MS data, are provided in a set of files separate from the Main and Replicates data files that comprise the Library of EI spectra. The MS/MS spectra have been provided by contributors, measured at NIST, and extracted from the literature. The preparation of the MS/MS Library revealed that at sufficiently high signal-to-noise measurement conditions, modern instruments are capable of providing very reproducible “library-searchable” spectra. Although collision energy is an important variable in Q-tof and related instruments, spectra vary in an understandable way depending on the compound and instrument type as well as collision-energy conditions. Energy-dependent variation is accounted for by including spectra for most compounds over a wide range of collision energies, ranging from slight to complete dissociation of the precursor ion.
The MS/MS spectra in NIST 14 are provided in two libraries, nist_msms and nist_msms2. The nist_msms library is described in detail below. The second MS/MS library, nist_msms2, contains spectra of compounds that do not have chemical structures displayed. They mostly are commercially available peptides. Spectra from the nist_msms2 library are not displayed in the MSMS tab. Otherwise, the format of the two libraries is similar.
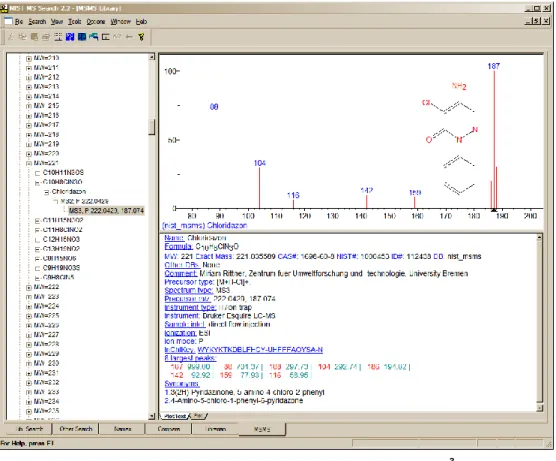
The MSMS tab allows access to the spectra in the nist_msms library. The first time this tab is selected, the three panes of the display are blank with the exception of a single entry in the ion list
pane, which is on the left of the tab’s display. This entry is the MS/MS Library. There is a box on the left that has a plus sign . Placing the Mouse pointer on this box and clicking expands to the first two levels (Positive Ions and Negative Ions). There are plus boxes next to both the Positive Ion and the Negative Ion. Clicking on one of these plus boxes results in the display of the next level. This is a list of molecular weights of analytes for which a spectrum was obtained by MS/MS. Clicking on the plus box next to one of these molecular weight listings results in the display of a list of elemental compositions that will also have plus boxes next to them. Clicking on one of the elemental composition plus boxes will result in a display of a list of the compound names that have that elemental composition. In most cases, this is only a single compound. Clicking on the plus box next to the compound name will result in the display of a list of the spectra acquired under MS/MS conditions for this compound. If more than one spectrum was acquired, there is a separate entry for each spectrum. Clicking on the spectrum entry will result in displaying the spectrum information. The listing of each spectrum begins with MS2.
Figure 1. MSMS tab for data acquired using “triple quad”.
For beam-type instruments (e.g., triple quadrupoles, HCD, and Q-tof instruments), the MS2
designation refers to spectra generated by dissociation in a collision cell of a selected precursor ion. For ion trap instruments, the MS2 designation refers to dissociation in the trap after following the isolation of the precursor ion.
In the case of data acquired using an ion trap mass spectrometer, the MS2 may have a plus box next to it. Clicking on this plus box results in a subsequent spectrum listed as MS3, which may also have a
plus box. Selection of the plus box next to the MS3 spectrum can result in an MS4 spectrum, which is obtained by the isolation of a product ion as a precursor ion for a subsequent iteration of MS/MS. Clicking on the MS3 results in the display of the spectrum as seen in Figure 2. The MS2 designation is followed with the precursor ion m/z value and the collision energy for beam-type instruments (Figure 1).
As can be seen from Figure 1 and Figure 2, there is a great deal more information provided in a text format for the spectra in the nist_msms library.
The MS/MS Library can be searched with any of the Other Searches or the Incremental Name Search. All that is necessary is to include the nist_msms library in the Include Libs column of the
Search dialog box for the Other Searches or as the single library to be searched in the Incremental Name Search. The Library Spectrum Search and Structure Similarity Search are also applicable. However, the user must understand that MS/MS spectra in general are different from EI spectra as well as the fact that structures in the MS/MS Library refer to the neutral form of the precursor ions. If the nist_msms library is not present, the MSMS tab is not displayed.
Software Changes from earlier versions of the Search Program
Version
2.0g
of the MS Search Program
Below is a list of features new to the previous version, 2.0g, which was distributed with NIST 11.
A new Exact Mass Search allows searching for exact mass of a precursor (exact molecular weigh) using its mass or exact m/z of a product ion. It takes into account the presence or absence of an electron, adducts or losses; accepts uncertainty in ppm or millimass units; and allows searching for isotopic or monoisotopic peaks.
A new Exact Mass Constraint similar to Exact Mass Search.
Ability to use accurate mass to search exact fragment ion mass values in NIST libraries
mainlib, replib, and nist_msms using the Any Peaks Search.
Display of the exact mass with any spectrum that has an associated chemical formula.
Manage and search as many as 127 separate MS libraries instead of 16, which was the limit in previous versions.
Optional display of columns in Hit Lists containing the number of synonyms and the number of Other Databases in which the Hit appears. The Hit List can be sorted according to the values in these columns.
Full compatibility with most recent NIST Peptide MS/MS Libraries.
Copy selected lines from Hit List or Spec List into Windows Clipboard as tab-delimited Unicode text; this may be conveniently pasted into Excel.
Spectra in the MSP text format can be imported from the Windows Clipboard into the Spec List
Searching for words in mass spectrum Text Information Window.
Optional exclusion of Homologues from the results of Structure Similarity Search. Import spectra from mzXML and mzData files.
Multiple CAS Registry numbers for a spectrum. A small fraction of spectra in NIST 14 has more than one CASrn. Each CASrn may be used in a CASrn Search.
The MS Interpreter program now enables high mass accuracy for both molecular ions and product ions.
An alternative peak matching method to improve the reliability of the score when searching noisy MS/MS spectra.
Several convenience features.3
Version
2.0f
of the MS Search Program
Below is a list of features new to the previous version, 2.0f, which was distributed with NIST 08.
A new spectrum search for MS/MS spectra in MS/MS libraries, including the NIST MS/MS libraries.
Spectra of stereo isomers, tautomers, and derivatives are displayed as replicate spectra.
Tags (which can act as Field Names) can be entered into the “Comments” field of a user library along with the Field’s contents.
Hit List can be sorted alphabetically.
Five new Constraints have been added: Tags in Comment, Peptide Sequences, Peptide Mobile Protons, Peptide Charge, and Peptide Number of Residues. Tags in Comment
Constraint, for example, allows searching for the name of the contributor in the EI Library. A search for information in the ”Contributor/Comment” field, which may be particularly useful for
certain types of information relevant to MS/MS.
Flexibility has been added to searches using a “Name Fragment in Constraints”. It is now possible to specify the presence or absence of any arbitrary part or parts of a name.
The Program does not use or require the installation of special NIST fonts.
3 New convenience features added to version 2.0g included:
Default view of Constraints and Other Searches dialog boxes changed to provide more convenience to the users. Ability to Sort the Spec List alphabetically, by number of synonyms, by number of other databases.
Toggle between Tab views (Lib. Search, Other Search, Name, Compare, Librarian, and MSMS Windows) using Crtl-Tab or Ctrl-Shift-Tab.
Guide to the Program
The Program uses tab displays. The tabs:
Lib. Search, Other Search, Names, Compare,Librarian, and MSMS tabs
which are located at the bottom of the Main Window. Selecting a tab results in the display of a different Window. All tab displays have moveable divider bars (splitters), some of which can be re-orientated as well as tabs associated with various panes (windows) within a view. Selecting Window / Tile Vertically or Window / Tile Horizontally from the main menu displays all windows.
Lib. Search tab (Figure 3) is used for all searches based on comparison of spectra or structures to a library.
Other Search tab is used for most non-spectral searches, i.e. CAS number, Molecular Weight, Formula, etc.
Names (Incremental Name Search) tab allows you to type in a name and have the program match the name as you type. This search uses all names and synonyms in the specified library
Compare tab allows for easy comparison between spectra. It is, by default, automatically refreshed with the latest spectral search of the library. You can put your own spectra into also.
Librarian tab keeps a history of the recent spectral searches and also can be used for import, editing and user library construction.
MSMS tab gives you access to all the MS/MS data by molecular weight, formula, compound and precursor ion for both positive and negative ions.
In every window, properties of the pane may be controlled using the Right Mouse Button (RMB) to bring up a menu from which the context sensitive properties box may be accessed. Alternate layouts can be selected using the Change layout button in the Tool Bar which is just under the Main Menu. A Tool Tip (the name of a button) is displayed when the Mouse pointer is placed over a Tool Bar button. There is also a Tool Bar button to restore the default layout (Set default layout). Alternatively, Default Layout and Change Layout in the Window menu may be used.
All the tab displays have the same Main Menu. The various menu selections available for each of these tabs are described in more detail throughout the manual. The File menu has Save Configuration and Restore Configuration selections which allows all the various tab display configurations to be saved to a specific file name and then recalled. Multiple users may have different ways of configuring each tab that is best for them. This way, each one can restore a specific set of display options. This does not include data search history. There is no change in the search history or Spec List resulting from a Restore Configuration.
The Search selection on the Main Menu allows for quick selection of non-spectral type search. Depending on the choice the selection will transfer you to the correct tab and bring up the options for that search.
The View option on the Main Menu (top of Figure 3) allows the display of the Tool Bar and/or the
Status Bar (bottom portion of Figure 3 containing For Help press F1 and Ident). There are also options to turn off the display of the Compare pane in the Lib. Search and Compare tab views. Tab displays can be brought into focus by placing the Mouse pointer on the tab name at the bottom of the desktop and clicking the left Mouse button. It is also possible to switch between tab views using the hot keys Ctrl-Tab and Ctrl-Shift-Tab.
Many of the controls for individual window are similar from tab to tab. These are covered in detail for the Library Search Tab but apply for most of the tabs.
The Lib. Search Tab
The first tab (lower left of the Program’s display), Lib. Search, is used with a search of a spectrum or structure against mass spectral libraries: a user library and/or the NIST 14 Libraries (Figure 3). The spectrum and structure searches can be done against multiple libraries (maximum of 127), and the selected libraries can be different from those selected for the various searches found in the Other Search tab. Spectra can be imported into the Spec List from linked mass spectral data systems software, text files containing one or more spectra in the NIST format, or from the Windows Clipboard. Structures in a MOL file format can be pasted into the Spec List for searching from the Windows Clipboard or an ACSII file.
The top pane on the left side of the Lib. Search tab is Spec List (known as the Clipboard Window in previous versions of the Program). The middle pane is a Hit Histogram, showing the distribution of Hits according to the Match Factor values. This Histogram can be displayed with either a linear or log scale on the y axis. The lower left pane contains the Hit List at the bottom. By default, the columns for the number of synonyms, presence in other databases and retention index are not displayed. On the right side of the movable vertical divider bar are three separate Windows: Search Spectrum/Spec List Spectrum, top; Compare, middle; and Hit List Spectrum, bottom. There are vertical divider bars associated with Spectrum/Text tabs of the top and bottom panes. By selecting
View from the Main Menu Bar, the display of the Compare pane can be deselected, it may also be minimized using the splitter bars. If the Mouse pointer is in the Search Spectrum/Spec List Spectrum Window or the Hit List Spectrum pane, the RMB (Right Mouse Button) menu option
Change Splitter Orientation can be used to change the orientation (back and forth between vertical and horizontal) of the divider bar between the plot of and text information for the spectrum. In all cases the RMB can be used to access the properties dialog box for each pane within the window. The pane on the top left of the Lib. Search tab is used for the Spec List, and the pane on the lower left of this Window is used for the Hit List. Note that both the top pane and the bar graph of match factors can be minimized using the splitter bars to maximize the hit list space. The pane on the left of the Other Search and Names tabs is used for the Hit List, and the pane in this position on the
Librarian and MSMS tabs is a list of spectra that can be displayed. It is important to know that the
Spec List in the Lib. Search tab and the Spec List in the Librarian tab are the same list. Spectra may be copied to the Spec List, edited, and deleted from it. The Hit Lists are read-only. All of these lists can be displayed as text or as graphic structures by selecting the Names or Structures tab at the bottom of the pane, except for the MSMS tab which does not have this alternate display option. Note, only name, match factor, reverse match factor and probability of correct hit are displayed in the graphic mode.
Each Hit List (except the one in the Names tab) and the Spec List can be sorted alphabetically by clicking on the Name Bar at the top of the pane. The Hit Lists in the Lib. Search tab and the Other Search tab have optionally displayed columns showing the number of synonyms, the number of other databases containing the compound and the retention index. These Hit Lists can also be sorted by these columns by pointing to the column header and clicking the left Mouse button.
To copy lines selected in a Hit List or Spec. List into Windows Clipboard in tab-separated text format, press Ctrl+K keyboard keys.
Figure 4. Figure 5a Figure 3. Lib. Search tab.
In some cases, the Hit Lists will also have a plus box in front of the Hit number This symbol means that there are replicate spectra for that Hit. Placing the Mouse pointer on the plus box and clicking the left Mouse button will cause a list of the replicates to appear below the Hit. Some of the names of the replicates will be preceded by R or an M, and some by m or r. If an R or M precedes the name, the spectrum is of the same compound as the Hit and is in the NISTreplibLibrary or the NIST mainlib Library. If the name is preceded by an m or and r it means that the replicate is a derivative or isomer of the Hit, with m being a spectrum in the NIST mainlib and r being a spectrum in the NISTreplib. The display of spectra of derivatives and isomers as replicates of a
compound is controlled through the Replicates Display Options
dialog box selected from Options/Replicates using the Main Menu
(Figure 4). Details are found by clicking on the Help button.
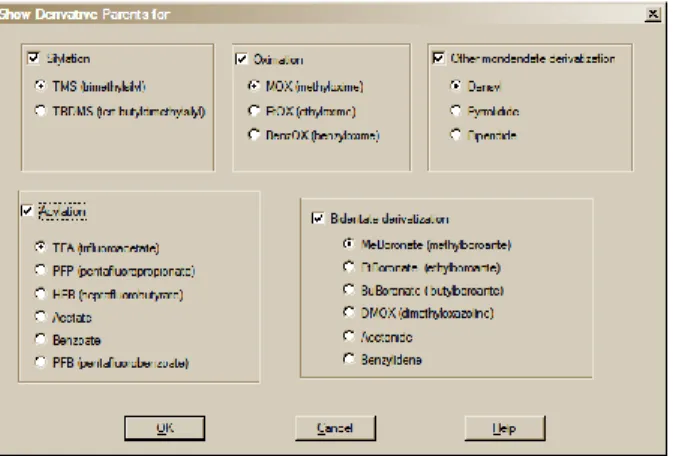
Selecting View/Derivative Parent (Precursor4) menu opens Show Derivative Parent for dialog box (Figure 5). Selecting derivative type(s) affects Lib. Search hit list: structures of derivative precursors are displayed instead of derivatives. Only mainlib and replib hits are
affected. Deselecting displayed derivative type(s) immediately changes structure display back to derivative. See MS Search help topic "Show Derivative Parent" for more details.
The Spectral Plot presentation pane (upper right of the Window in the default display) of all tab views except the Compare tab, have settable attributes that are found in the Properties dialog box described below. By default, the Plot pane displays the primary name of the spectrum in the lower left hand corner of the pane. In addition the library from which the spectrum was drawn precedes the name in parenthesis. Optionally, the compound’s Molecular Weight (nominal mass), CAS registry number, and Formula (elemental composition) can be displayed. This legend display can be forced to
4
wrap so that all characters will be visible (Figure 6). Also optional, a structure (if associated with the spectrum) can be displayed on the spectrum. If a structure has been requested and one is not assorted with the spectrum, a colored ? will appear. Labeling of the peaks is either by default or the
Plot tab of the Properties dialog box has a “Label peaks greater than (%)” option followed by a text entry box allowing for the input of a number. If the spectrum is to be displayed without peak labeling, enter 100 in this box or deselect m/z Label and Text Label options. It is also possible to use this
Properties dialog box to change the colors of the mass spectral peaks, scale, labels, bonds and rings in structures, atomic symbols in structures, and the spectrum’s background. Selecting the Set default layout button on the Tool Bar will restore colors to the original values.
Figure 5. Select anyone of the five Derivative type check boxes; then select the subcategory radio button.
The Text Info pane, by default, is to the right of the Spectral Plot presentation in the Lib. Search tab. This orientation can be changed so that the Text Info pane is just below the Plot presentation by using the RMB menu selection Change Splitter Orientation. In the other tab views where both the plot of the spectrum and the text information are displayed, these two panes are oriented by default with the Plot pane above the Text Info pane. Again, this orientation can be changed using the appropriate selection on the RMB menu when the Mouse pointer is on either of the two panes. The
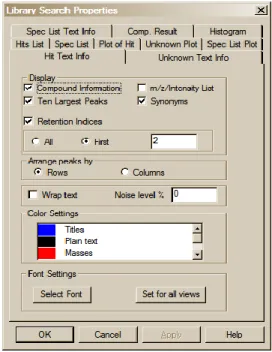
Hit Text Info tab (Text Info tab in some tab views) of the Properties dialog box has a number of selectable display options in the form of check boxes (Compound Information, m/z intensity list,
Ten Largest Peaks, Synonyms, and Retention Indices). The Compound Information is: the primary name associated with the spectrum in its source library; the Formula (elemental composition); MW (nominal mass); Exact Mass (if there is an elemental composition associated with the spectrum); CAS registry number; NIST Number (sequential number assigned to spectra in the NIST EI Archive); ID number (position in the library containing the spectrum); name of the library containing the spectrum; names of Other databases in which the compound can be found, if any (displayed only with
mainlib and replib spectra); Contributor (NIST Library)/Comments (user libraries); and Related CAS registry numbers, if any (NIST DB only). The other check boxes of these first four selections are self-explanatory.
If Retention Indices is checked and there are records containing literature GC methods and Retention Indices, these records will be displayed following the display of synonyms (if selected). As pointed out earlier, by default, only the first two records are displayed. If there are more than two records, <…> will appear just below the last line of the bottom record. The Properties dialog box allows the setting for the display of a larger selected number of records or all of the records. The record is searchable using the Find selection on the RMB menu when displayed in a Text Info pane. All text is searched so column types, active phases, authors or text in the article titles can be searched. Only the records displayed are searched (Figure 7).
Figure 6. The Spectral Plot display of a spectrum in the Name tab with the nominal mass, CAS registry number, elemental composition name of the library containing the spectrum, and the name associated with the spectrum. The display is wrapped, the structure is shown, and the peaks are not labeled.
Figure 7. The Text Info display with Compound Information and Retention Indices as the only selected display options.
It should be noted that the GC Methods/RI Library is also available separate from NIST 14 with its own Search program, which allows for more extensive use of this Library.
Figure 8. Properties dialog box displayed by selecting Properties on the RMB menu displayed when the Mouse pointer is on one of the panes of the Lib. Search tab.
The RMB menu selection Properties will result in the display of a multiple-tab dialog box (Figure 8). The tabs at the top are self-explanatory. This allows customization of the appearance of the display and control of what is displayed such as a structure on a spectrum, the 10 most intense peaks in the spectrum in the text display, etc. Colors of structures, mass spectral peaks and axes, and fonts used for alphanumeric characters can also be set. Each pane can have its own customized set of attributes. This customized display can be saved using the File/Save Configuration command from the Main Menu Bar. Different saved configurations can be recalled by using the
File/Restore Configuration command from the Main Menu Bar. Separate customizations can be established for each of the six separate tabs. This includes selected libraries to be searched.
At the top left of the Lib. Search tab view (Figure 3) is the Button Bar. The meaning of each of these buttons is shown below:
Figure 9. Lib. Search’s Button Bar.
The Go button will launch a search of the highlighted spectrum in the Spec List. The Structure Search button will perform a structure similarity search of the highlighted structure in the Spec List. The Import button (with the file folder icon) is used to import spectra from a text file. The Library Search Options button is used to display the dialog box used in selecting libraries to be searched, search types, and other factors associated with the search of spectra and structures.
The drop-down list box contains the Search History. A previous search’s display can be restored by
highlighting an entry in this list. NOTE: the Program can be set to automatically clear the Hit List
and/or the Spec List by selecting the Clear History on Exit check box in the Hit List tab and/or
Plot/Text of the Spec List tab in the Library Search Properties dialog box displayed by selecting
Properties from the RMB menu.
The Clear History button is used to clear the search history. The Replicates On/Off button will toggle the listing of replicate spectra on and off when the mainlib Library of the NIST/EPA/NIH Library is searched. View sub- struc-ture identifi- cation View hitlist search options
Best matching only Clear history Replicates Off/On History list Library search options Import Structure search Library Spectrum Search
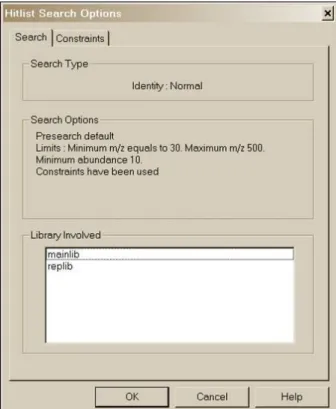
Figure 11. List of libraries used in a Library spectrum Search along with the Search Options
Figure 10. List of Constraints used for a specific search along with their values.
The Best matching only button will force the hit list to display only the hit with the highest match factor for any given CASrn. This is the. This feature is especially useful when more than one library is being searched, and some of the spectra in these libraries have the same CASrn’s associated with them. In the case of an MS/MS Search, the best matching spectrum is selected out of Hits that have the same CASrn or names and charge.
The View hit list search options button will result in the display of a dialog box with two tabs if constraints have been used in the search. The Search or Options tab (depending on whether the Hit List Search Options are for a Lib. Search or an Other Search carried out) lists the libraries searched (and type of Search and Search Options for Library spectrum Searches only). The
Constraints tab (if present) lists all different constraints along with values used in the search (Figure 10 and Figure 11).
It should be noted that even though a Library spectrum Search is carried out against a list of libraries (Figure 28) that does not include mainlib and replib, these two libraries will be listed as having been included (Figure 11) as long as the Display InChI Replicatescheck box is selected in the Replicates Display Options dialog box (see Figure 4). This will result in the display of the symbol indicating replicates were found when the user-only library was searched. This means that InChI search options are available for those spectra in libraries like the Wiley Registry of Mass Spectra and various other libraries provided by Wiley and Others in the NIST format, which have CASrn present in mainlib.
Two other Important Points about the use of Constraints:
When a Constrained Search is carried out, the Search is performed as if there was no constraint. Only the spectra that were found in the Search that fall within the constraint criteria appear in the Hit List.
The number of different constraints that are available exceeds the display area; a slider bar on the right side of the Constraints Window in the Search dialog box allows access to all constraints. The
Constraint Window will only allow for the display of six constraint options at a time. Once values have been entered for any of these options, those values will remain until individually changed or deleted. Once an available Constraint has been selected (check mark in check box entered by putting the Mouse pointer on the check box and clicking the left Mouse button), the values previously entered for that constraint will be used when a Constrained Search is performed. Because if a Constraint is selected and is not visible in the Window, a bad result may occur, the program displays the number of constraints selected. A Clear All button has been added tothe Constraints tab of the Search dialog box. The Clear All button removes the checks in the various constrains, it does not change the values in each of the constraints. It is recommended to click on this button before starting a new
Constrained Search and reselecting any desired Constraints. Whenever any Constraint is selected, the Use Constraints check box is automatically selected. Clicking on any individual Constraint’s
check box in the Constraints Window causes appearance of the Constraints tab of the Search
dialog box to change to allow for the entry (or edit) of values for that Constraint at the same time the Constraint is selected or deselected. The appearance can also be changed to that for a specific constraint by clicking on the constraint description away from the check box.
The last button on the right, the View substructure information button, displays the Substructure Information dialog box. The Substructure Information dialog box contains a list of the probability of the presence and absence of substructures that may be associated with a compound that produced the searched mass spectrum along with additional predictions about this compound’s molecular weight and estimate of the numbers of atoms of chlorine and/or bromine that may be contained. This is especially useful with a Neutral Loss, Hybrid Neutral Loss Similarity, or MS/MS In EI Similarity Search. An example of the use of Substructure Information resulting from an MS/MS in EI Similarity Search of the EI Library is provided later in this manual.
Title Bar, Tool Bar, and Status Bar
At the top of the display of each of the Program’s tab is a Title Bar. The contents of a title bar of the active tab are also displayed in the Title Bar of the Program Window. When the Lib. Search or
Other Search tab is displayed, this Title Bar will contain information about the currently displayed search. In the case of a Library spectrum Search, this will include the search type used, whether or not constraints were used, and if any type of limits were applied to the search. In the case of the
Other Search tab, the Title Bar will contain the type of search that was done (i.e., Formula, Molecular weight, Any peaks, etc.) and whether or not constraints were used. When the Compare
tab is displayed, the Title Bar contains the number of spectra available for comparison regardless of the number displayed.
At the bottom of the Program’s display, below the Program’s tabs, is the optionally displayed Status Bar. The Status Bar’s display can be turned off by selecting or deselecting Status Bar from the View
menu. When a Library spectrum Search is being conducted, the left side of the Status Bar will have displayed “Comparing XXX Library spectra with submitted spectrum” where XXX is the number of spectra that were found during the Presearch (see Search Algorithms in Appendix 5). If Off has been selected in the Presearch area of the Search tab of the Library Search Options dialog box, XXX will represent the total number of spectra in the libraries being searched.
There are five fields on the right side of the Status Bar. The left-most of these five fields will have displayed the selected search type in the “Spectrum Search Type” area of the Search tab of the
Library Search Options dialog box (Neutral Loss, Hybrid, or Simple if the Similarity Search is selected; and Quick or Ident depending on whether a Quick or Normal Identity Search has been selected).
The next four fields to the right of the box indicating the selected search type pertain to the currently displayed search results. The first box to the right contains the type of search that was used in the displayed search results. The next box to the right will have contained “Rev” if the Hit List is sorted according to the Reverse Match value (the Match Factor obtained by ignoring all peaks that are in the sample spectrum but not the library spectrum). To set this mode, select Reverse Searchcheck box in the “Spectrum Search Options” section of the Search tab of the Library Search Options dialog box. The third box will contain the number used as a precursor MW value in a Neutral Loss or Hybrid SimilaritySearch. If an IdentitySearch has been carried out, the fourth box will contain “Penalize” if
the Penalize rare compoundscheck box was selected in the “Spectrum Search Options” section of
the Search tab of the Library Search Options dialog box.
The Tool Bar’s display (Figure 12) is optional by selecting it from the View menu. The functionality of its button Switch to Caller and Print Report is also available on the File menu; MS Interpreter, and
AMDIS also may be launched from the Tools menu.
Figure 12. NIST MS Search Tool Bar.
A Tool Tip is associated with each of the buttons with an explanation of the button’s function. The button will return all displays on the currently viewed tab to the default values. The button toggles through three separate views for the currently displayed Program’s tab.
The m/zrange button displays a dialog box (Figure 13) to fix the starting and ending m/z values for bar-graph spectra displays, and to choose whether the peaks should be labeled with neutral losses or with their m/z value.
An explanation of each of the items in this dialog box can be found by selecting the dialog box’s Help
button. The Anchors dialog box is used when viewing spectra with a neutral loss label. Selecting
Anchors will result in the display of the Anchors dialog box, which is explained by selecting the Help
button in that dialog box.
The two radio buttons at the top of this dialog box have to do with labeling spectra normally or with natural loss values. Normaldisplay isthe most common.
Cut Copy About Switch to Caller m/z range Change layout Set default layout Paste
Print Report
AMDIS MS Interpreter
Neutral Loss Display
Figure 13. m/z range (for Spectra Display) dialog box.
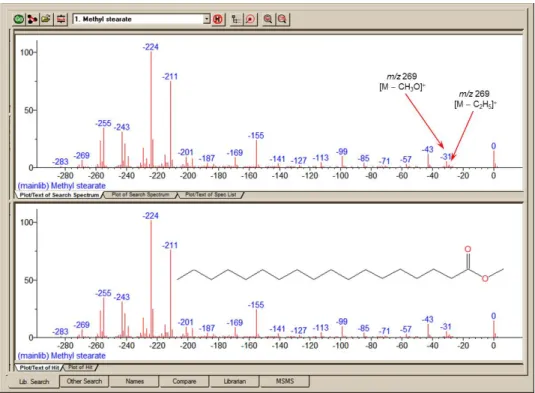
One of the important tools in deducing a structure from a mass spectrum is to look at the mass spectral peaks as losses from the molecular ion rather than as individual peaks. In this way of viewing the mass spectrum, the peak at m/z 269 in methyl stearate becomes the [M 29] peak (loss of an ethyl radical) and the peak at m/z 267 becomes the [M 31] peak (loss of a methoxy radical). See Figure14.
The program can display a spectrum with neutral loss labeling with the library spectra and search spectrum be labeled as neutral losses with the first label on the right-most peak being 0 (Figure 15). To activate this display, select Neutral Loss Display from the RMB menu. Selecting Neutral Loss Anchors is explained in the Help files (topic m/z range). NOTE: If you do not know the molecular weight of the search spectrum, the program will attempt to estimate it. This value may be overridden by using the librarian to edit the spectrum and specifying a molecular weight and then using the edited spectrum to run the library search.
Figure 14. Nominal spectrum labeling where the top spectrum is of an unknown compound and bottom spectrum is of the first Hit from a search of the NIST/EPA/NIH Mass Spectral Library (NIST 14).
Figure 15. Neutral Loss spectrum labeling where the top spectrum is of an unknown compound and bottom spectrum is of the first Hit from a search of the NIST/EPA/NIH Mass Spectral Library (NIST 14).
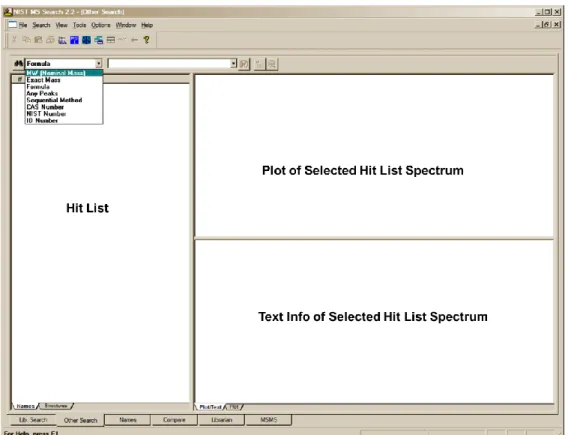
The Other Search Tab
The second tab display, Other Search (Figure 16), is used to perform a MW (Nominal Mass), Exact Mass, Formula (elemental composition), Any Peaks, Sequential Method, CAS registry number,
NIST Number, or ID Number Search. The NIST Number Search can only be carried out on the
NIST Main Library (mainlib) and the Replicates Library (replib). NIST Numbers establish correspondence between spectra in different releases of the NIST/EPA/NIH MS Library. The ID NumberSearch can only be carried out on one library at a time. The other options in this group can search multiple libraries (maximum of 127), and different sets of libraries can be specified for each different type of search.
As shown in Figure 17, another new feature in v.2.2 of the Program is the display of columns showing not only the number of synonyms, the number of other databases in which the Hit can be found but also the retention index (RI) if available. Not only are these columns available for the Hit List of searches performed in the Other tab, but also in the Hit List displayed in the Lib. Search tab. The display of these columns is controlled by the Hit List tab of the Properties dialog box displayed by selecting the Properties option from the RMB menu displayed when the Mouse pointer is in a Hit List
Figure 16. Other Search tab.
Figure 17. Results of a Formula Search showing the number of “synonyms” for the Hits ,the number of other “databases” in which the Hits can be found and the RI value (if present) columns.
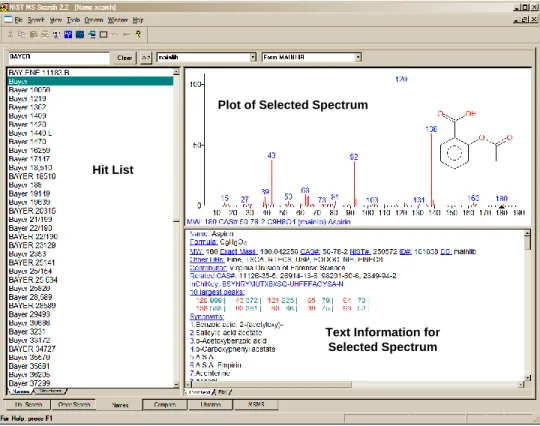
The Names Tab
The third tab, Names, is used for the NIST signature Incremental Name Search (Names) (Figure 18). The Name Search can only be performed against one mass spectral library at a time. The library to be searched is selected by use of the Library to search drop-down list box next to the a–z button. If the a–z button is selected, the only input in the text entry field on far left just below the button bar that will be taken is that of letters a–z. If the a–z button has not been selected, numbers as well as letters can be input. Names containing Greek alphabet characters can be pasted into the text entry field. Typed dashes and other punctuation characters will not be used. All letters are entered as upper case regardless of the input.
NOTE: The drop-down list box just to the right of the a–z button is used to select the library to be searched. This search method allows for the browsing of user libraries.
The second list box only appears when the library selected is one of the NIST mainlib is searched. It is used to display replicate spectra for the NIST 14mainlibLibrary. If there are no replicate spectra for the highlighted selection in the Hit List, this list box will not appear on the display. When Replicates are available they will appear in the list box as either Replicate followed by a sequence number or *Replicate. Replicate is a spectrum of the same compound that is in the replibLibrary.
*Replicate, according to Replicates options identifies a spectrum that is of a heavy isotope variant of the compound, a stereoisomer of the compound, or a compound, which has the same derivative precursor.
The NameSearch used with the NIST/EPA/NIH Mass Spectral Library uses not only the main name but also any synonyms. As an example, the mainlib compound name for acetylsalicylic acid is the common name Aspirin. This compound has 157 synonyms and its spectrum can be displayed by entering any of these names including trade names like Bayer (Figure 18).
Figure 18. Incremental Name Search tab.
Note, the use of synonyms is also supported in user libraries. Thus if a spectrum is given a synonym “Lab Book 4-PG-22”, then the data can be retrieved by that name using the incremental search.
Hit List
Plot of Selected Spectrum
Text Information for Selected Spectrum Hit List
Plot of Selected Spectrum
Text Information for Selected Spectrum
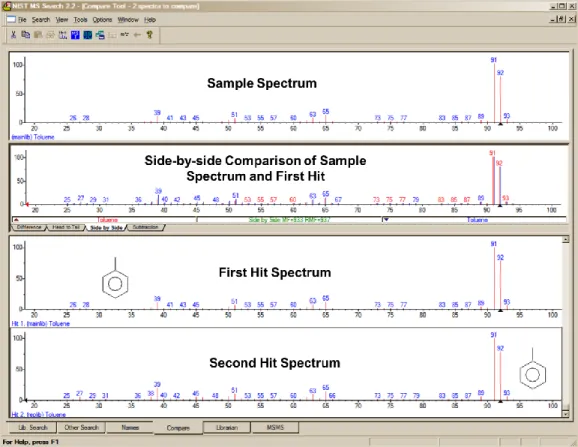
The Compare Tab
The fourth tab, Compare (Figure 19), allows the display of a sample spectrum and multiple spectra from the Hit List. Other spectra can also be put into the Compare display. A selected spectrum in the lower part of the Compare tab can be displayed as various types of comparisons with the spectrum in the upper part of the display by selection of one of the tabs in the Compare pane (Difference, Head-to-Tail, Side-by-Side, Subtraction).
Figure 19. Compare tab.
The Librarian Tab
The fifth tab, Librarian (not shown), is used to deal with spectra that are in user libraries or that are to be added to user libraries, or have been imported or searched. The layout of this tab is the same as the tab used for the Incremental Name Search with the exception that the far left pane contains the
Spec List rather than a Hit List. This is the same Spec List as displayed in the upper left pane of the
Lib. Search tab. The Librarian tab allows for the editing or creating of spectra. This editing not only allows m/z intensity pairs to be edited, deleted, or added; but also allows CAS registry numbers, elemental compositions, structures, names, synonyms, and structures to be edited, added, or deleted. When a splitter bar divides a pane, the position can be changed by selecting Change Splitter Orientation on the RMB menu, displayed when the pointer is in the pane.
Zoom. Placing the Mouse pointer on a mass spectrum plot or spectra comparing bar-graph plot, holding the left Mouse button down and dragging the Mouse pointer along a diagonal will result in drawing a zoom rectangle. After releasing the Mouse button, a zoomed spectrum will be displayed; the cursor will change to a magnifying glass. To return to the normal display, select Zoom Out from the RMB menu or double-click.
Additional information on the Librarian and MSMS tabs is provided later in this manual under User Libraries and MS/MS Searching.
Spectral Analysis Utilities for NIST 14
Automated Mass Spectrometry Deconvolution and Identification
System (AMDIS)
Included as a separate utility, AMDIS attempts to reconstruct original mass spectra for individual components in arbitrarily complex GC/MS and LC/MS chromatograms; and if a target library is provided, AMDIS can directly identify target compounds. AMDIS is especially useful when a single reconstructed total ion current (RTIC) chromatographic peak represents multiple components. Regardless of each component’s concentration, pure mass spectra are deconvoluted for analyses.
AMDIS was developed by NIST under a contract from the Defense Threat Reduction Agency (DTRA), Department of Defense, for verifying of compliance with a major international treaty (Chemical Weapons Convention) as ratified by the United States Senate in 1997. In order to meet the rigorous requirements for this purpose, AMDIS was tested against more than 30,000 GC/MS data files accumulated by the EPA Contract Laboratory Program without a single false-positive for the target set of known chemical warfare agents. Although this level of reliability may not be required for all laboratories, this shows the degree to which the algorithms have been tested. AMDIS can also be used to identify individual non-target components in complex samples. It has been widely used in the flavors and fragrance industry, forensics, the study of natural products, and for the identifications of metabolites.
AMDIS has been designed to reconstruct “pure component” spectra from complex RTIC
chromatograms even when components are present at trace levels. For this purpose, observed chromatographic behavior is used along with a range of noise-reduction methods. AMDIS is distributed with specialized libraries (environmental, flavor and fragrance, and drugs and toxins) that were derived from the NIST 02 MS Library. AMDIS has a range of other features including the ability to search the entire NIST 14 MS Library with any of the spectra extracted from the original data file. It can also employ retention-index windows when identifying target compounds and can make use of internal and external standards maintained in separate libraries. A history list of selected performance standards is also maintained.
The instruments that are supported in their native file format are: † Agilent ChemStation (GC-MS & LC-MS) and MS Engines BrukerDALTONICS GC-MS (*.MSF)
Finnigan (GCQ, INCOS, ITDS, ITS-40, ITD-700/800, ITMS) Inficon (*.acq)
JEOL/Shrader (*.lrp) Kratos Mach3 (*.run)
Micromass (MassLynx, NT Formats) (RAW) mzXmL/mzData
Perkin-Elmer TurboMass (RAW) and ITD-700 (*.ms) Shimadzu MS Files QP5000 and QP5050 (*.R##) Thermo Fisher Xcalibur (RAW)
Varian (MS, SMS, XMS)
In addition, the NetCDF format, which is supported by many manufacturers, is supported by AMDIS. Other formats will be added in future releases. Contact NIST for future information.
†
The use of specific product and trade names does not indicate an endorsement by the National Institute of Standards and Technology. The specific file formats are supported in order to ensure that the data is transferred to AMDIS with no information loss. The specific formats and names are covered by the respective copyrights of the individual companies.
Figure 21. View of MS Interpreter’s isotope calculator used to compare observed abundances to theoretical values.
Figure 20. The main Window of MS Interpreter. The black lines indicate the peaks in the mass spectrum that the MS Interpreter can explain. The white lines indicate the ones it cannot. The color coding is settable by the user to allow specific types of ion formation
mechanisms to be shown.
MS Interpreter
This tool was developed to aid NIST evaluators in their analysis of mass spectra. In one integrated program, it enables a variety of calculations on a mass spectrum, using a proposed chemical structure if available. Spectra and structures are associated in the spectral editing component of the Librarian
tab of the MS Search Program discussed in USER DATABASES section and APPENDIX 3 of this manual. MS Interpreter is activated for an individual spectrum with the Mouse Pointer on a Plot or
Text Information pane or by highlighting the name or structure of a compound in a Hit List and selecting MS Interpreter on the Send To menu of the RMB menu. This action opens MS Interpreter
with the spectrum and associated structure (Figure 20). MS Interpreter can also be opened from the
Tools menu or a button on the Tool Bar. If a spectrum/structure has been opened in MS Interpreter
and then the program closed and then reopened from either the Tools menu or the button on the
Toolbar, the last contents will be displayed. If MS Interpreter is started by either of these two actions just after starting the Program, both the Structure pane and the Spectrum pane will be empty. Spectra can be imported from MSP files (text files containing spectra in the NIST MS Search format), JCAMP-DX, and SDfiles. If the folder also contains a *.STB structure file that has the same name as the MSP file, that structure will be associated with a spectrum in MS Interpreter. When a structure/spectrum pair is Saved from the MS Interpreter’s File Menu, two files are created: one containing the spectrum (*.MSP) and the other a structure (*.STB).
Peaks in the spectrum originating as a logical fragment of the molecule (M or MH) are marked at the top of the spectrum display; and corresponding fragments, derived from thermodynamic approximation, may be highlighted by clicking on one of these marks. It also allows for keeping track of important neutral losses, both from the precursor or a derived ion and to find all possible formulas for any peak or neutral loss. Isotopic patterns (Figure 21) for any cluster can be separately examined. These isotope clusters can be compared to theoretical predictions subject to a number of user-specified constraints. MS Interpreter is a separate program that also has an icon in the NIST Mass Spectral Database program folder. It also has a simple Help screen that can be called from the program by selecting Help on its Menu Bar or by pressing the F1 key. Information about the control
currently located under the mouse pointer and possible user actions is displayed in the Status Bar located at the bottom of the program’s
main Window. Placing the Mouse Pointer in the mass spectrum display and clicking the Right Mouse button will result in a somewhat self-explanatory RMB menu. Before using the program, explore this RMB menu (Figure 22).
Figure 22. Right Mouse button menu displayed when the Right Mouse button is on the Plot portion of the MSI Program.
Figure 23. Fragment options dialog box.
Selected ions on the plot of the mass spectrum can be sent to Formula Calculator and the Isotope Calculator using selections on this menu. A specific m/z value can be locked as the position to display calculated losses from. In addition, the Fragment options dialog box can be displayed (Figure 23).
More detailed information can be obtained about the use of this utility by pressing the F1 key with the Mouse pointer in one of the Program’s panes.
Exact masses of fragment ions
Structure view displays not only nominal m/z but also exact mass of the predicted fragment ion.
Pasting a chemical structure into the Structure view
Copy a structure from a structure editor (molfile format) into Windows Clipboard; In MS Interpreter, click Structure view title bar to activate it;
Click Paste button or select from the menu: Edit/Paste or press Ctrl-V.
Pasting a mass spectrum or a chemical structure into Mass Spectrum view
Contents of a file containing a mass spectrum or a structure or both (SDfile) may be pasted into the Mass Spectrum view.
Pasting a peak list into the Mass Spectrum view
Copy a peak list into the Windows Clipboard;
In MS Interpreter, click Mass Spectrum Window to activate it;
Click Paste button, or select from the menu: Edit/Paste, or press Ctrl-V.
Notes
the peak list must be made out of m/z and intensity pairs separated by any of the following characters:
space , ; : ( ) [ ] } | Tab
each line must contain one or more m/z and intensity pairs;
if at least one line contains an odd number of values, then the program reads only first two numbers (one peak) from each line; a warning is displayed;
all peaks must be in order of either ascending or descending m/z; all m/z are rounded to the nearest integer by the MS Interpreter; there is no need to normalize intensities to 999.
Pasting MSP, SDF, MOL, and JDX (JCAMP-DX) files from Windows Explorer
MSP, SDF, MOL, and JDX files may be copied from the Windows Explorer and pasted into the Structure or Mass Spectrum view of MS Interpreter.
The files of the same type may be dragged from the Windows Explorer and dropped into the same MS Interpreter views. In all cases, only the first spectrum and/or structure from the first selected file is/are imported.
The name of the imported file appears on the MS Interpreter Title Bar and in the MRU (most recently used) list in the File menu.
Copying calculated isotope envelope table from the Isotope Calculator into Windows Clipboard
Right-click any line in the Isotope Calculator table Select Copy.
This will copy into the Windows Clipboard a tab-delimited text, which is suitable for pasting into a MS Excel spreadsheet or text editor. The context menu and the text contain words “Default Isotope Table” or the name of the file from which a custom isotope composition was imported (see the next section.)
Using custom isotope composition table in Isotope Calculator and Formula Calculator
Open file MS_Interpreter_isotope_table_test_01.itbl in a plain text editor. This file is installed in the same folder as MS Interpreter, typically, c:\nist11\mssearch
Read the notes in the file
Edit the file and save it under another name
From MS Interpreter menu, select File/Import Isotope Table
In the Open Isotope File dialog box, select the newly created file and click the Open button. To restore the original table, import file MS_Interpreter_isotope_table_default.itbl. The original
table is restored automatically after both MS Interpreter and MS Search are shut down. Every time a *.itbl file is imported, a *.itbl.log file is created or appended. This file contains the
date, time, a full pathname of the .itbl file, and a list of differences (if any) between the current and the imported isotope table or a reason for the failure to import the new table.
Example Searches
Library Spectrum and Structure Searches
The Program can be used to find spectra that are similar to that of an unknown compound. This can be accomplished by importing the spectrum from a third-party mass spectral data analysis program or from a text file (*.MSP). A spectrum can a