ISSN: 2038-6087
Working Paper
5/2011
Dipartimento di Scienze Economiche Università di CassinoGabriele Ruiu
(1)and Gaetano Lisi
(2)University of Cassino and EIEF;
University of Cassino and CreaM
Tax Morale, Slippery-Slope Framework and Tax Compliance:
A Cross-section Analysis
Dipartimento di Scienze Economiche
Università degli Studi di Cassino
Via S.Angelo Località Folcara, Cassino (FR) Tel. +39 0776 2994734 Email [email protected]
Tax Morale, Slippery-Slope Framework and Tax Compliance:
A Cross-section Analysis
Gabriele Ruiu*
University of Cassino and EIEF University of Cassino and CreaMGaetano Lisi
Abstract
Following two important strands of tax compliance literature, this empirical paper develops a cross-section analysis in order to test both the role of tax morale on tax compliance decisions and the main predictions of the slippery slope framework. Using data from the World Value Surveys (WWS), we find empirical support for the slippery slope framework, since trust in and power of tax authorities are negatively and significantly related to a proxy for tax non-compliance behavior given by the size of the hidden economy. In particular, trust in tax authorities exerts a larger effect on shadow economy than the power of tax authorities. Instead, the relation between tax morale and our proxy for tax evasion is not statistically significant.
JEL Classification: A13, H26, K42, C31
Keywords: tax morale, tax compliance, tax evasion, slippery-slope framework, cross-section analysis
*Corresponding author: Gabriele Ruiu, Department of Economics, University of Cassino (Italy) and
Einaudi Institute of Economics and Finance (EIEF). E-mail: [email protected].
A previous version of this paper was presented at the ‘II Workshop ME@Ravello: Personnel Economics and the Public Sector’, Ravello, May 13-15, 2011. All the partecipants at the meeting are gratefully acknowledged. The authors wish to thank also an anonymous referee for his useful comments on a previous version of this paper. The usual disclaimer applies.
«Every tax, however, is, to the person who pays it, a badge, not of slavery, but of liberty» (Adam Smith)
1. Introduction
The concept of ‘tax morale’ and the ‘slippery slope’ framework were developed to
address the puzzling findings in tax compliance decisions, the so-called tax compliance puzzles.
Indeed, traditional economic models of income tax evasion à la Allingham and Sandmo (for a
review see Sandmo, 2005), based above all on monitoring probability and expected penalty, predict far too little compliance and far too much tax evasion (Feld and Frey, 2002). Furthermore, the empirical support for the deterrent effect of audits and fines is weak and
unstable (for a review see Kirchler et al., 2008b).
The concept of tax morale – which is usually defined as “the intrinsic motivation to pay taxes, a moral obligation to pay taxes, a belief in contributing to society by paying taxes” (Torgler, 2007; Torgler and Schneider, 2007) – was introduced in tax compliance literature to explain both the high degree of tax compliance in many countries where the level of deterrence is too low (Torgler, 2007; Slemrod, 2007) and the huge differences in tax compliance between countries or regions despite the same tax and punishment policies, the so-called ‘Palermo-Milano puzzle’ (Rothstein, 2000). In theoretical models, tax morale is usually modeled as an ‘internalized social norm’ for tax compliance or against tax evasion which renders evasion costly (Elster, 1989; Falkinger, 1995; Kolm and Larsen, 2002; Traxler, 2010; Lisi and Pugno, 2011). However, the less people evade taxes, the more attractive it is to follow the social norm. Therefore, these models can account for the main shortcomings of the standard tax evasion model, i.e. Allingham and Sandmo’s (1972) model, thus supporting the empirical evidence that differences in the proportion of tax evasion between regions and countries may be due to different moral costs. Empirical studies in fact show the existence of a strong negative correlation between the level of tax morale and the extent of tax evasion (Torgler, 2005; Alm
and Torgler, 2006; Alm et al., 2006; Barone and Mocetti, 2009). Furthermore, there is evidence of
a bi-causal link between tax morale and tax evasion,1 since tax morale affects compliance
behavior, i.e. a higher (lower) tax morale reduces (increases) the level of tax evasion (Halla,
2010), but, at the same time, a lower (higher) level of tax evasion also implies ceteris paribus, a
higher (lower) tax morale (Frey and Torgler, 2007; Halla, 2010).
1 This ‘virtuous or vicious circle’ is captured by Lisi and Pugno’s (2011) model in which multiple
equilibria emerge. In short, economies with lower tax morale can end up in equilibrium where the irregular sector is larger, and economies with higher tax morale can end up in equilibrium where the irregular sector is smaller.
The ‘slippery slope’ framework (Kirchler, 2007; Kirchler et al., 2008a) distinguishes two forms of tax compliance: voluntary and enforced compliance. Voluntary compliance depends on trust in tax authorities, whereas enforced compliance depends on the power of tax authorities to clamp down on tax evaders. Furthermore, the ‘slippery slope’ framework
stresses the crucial interaction of power and trust (Kirchler et al., 2008a; Muehlbacher and
Kirchler, 2010). Hence, besides the well-studied instruments of deterrence, the interaction of power of and trust in tax authorities is crucial in tax compliance decisions (Kirchler, 2007;
Kirchler et al., 2008a; Muehlbacher and Kirchler, 2010). As a result, with the right mix of policy
tools of deterrence and trust in tax authorities, it is possible to foster and stabilize the voluntary cooperation of honest taxpayers (Muehlbacher and Kirchler, 2010). From a theoretical point of view, attempts have recently been made to formalize the assumptions from the ‘slippery slope’ framework about the effects of trust in and power of tax authorities on tax compliance (se e.g.
Prinz et al., 2010; Lisi, 2011). As regards the empirical support of the ‘slippery slope’
framework, a laboratory experiment and an online experiment showed that trust and power positively influence tax payments (Wahl, Kastlunger and Kirchler, 2010).
Among this important literature, our paper is most related to that of Torgler (2003a, b) and Schneider & Fischer (2009). Torgler (2003a) shows the relevance of tax rules to understand tax morale. In particular, he finds that vertical trust (trust in tax authorities) have a significant positive effect on tax morale, whereas the same tax rules can have different compliance effects. Instead, Schneider & Fischer (2009) find strong evidence for a positive interplay between trust (in) and power (of) tax authorities for tax compliance. However, both of them use tax morale (the dependent variable) as a proxy for tax compliance. Albeit tax morale constitutes a widely accepted measure of intrinsic motivation to pay taxes (Schneider and Torgler, 2006), it underestimates actual tax compliance. For this reason, in this paper we use the size of shadow economy as a proxy for tax evasion, thus capturing the “overall” tax compliance. Furthermore, in this model, we try to integrate the two strands of tax compliance literature: the tax morale approach and the ‘slippery slope’ framework.
Using data from the World Value Surveys (WWS – fifth wave), as in Torgler (2003a,b)
and Schneider & Fischer (2009), we find that tax morale and vertical trust (i.e. trust in tax authorities) are strong related to each other. Furthermore, we show that cultural variables such as horizontal trust and religious affiliation are strongly and positively related to vertical trust but not to tax morale. When we include these cultural controls in a regression of tax morale
versus vertical trust, we find that only the latter is statistically significant. This suggests that vertical trust is a channel through which culture can affect tax morale.
Using a methodology suggested by Algan and Cahuc (2007), we constructed country level indicators of both tax morale and vertical trust for 50 countries. When these two indicators are regressed together with the indicator of law enforcement (our proxy of power of tax authorities) and other controls (pro-capita GDP, level of education, level of taxation) against a proxy for tax non-compliance behavior given by the size of the hidden economy, we find empirical support for the slippery slope framework, whereas the relation between tax morale and our proxy for tax evasion is not statistically significant. Vertical trust and law enforcement are negatively and significantly related to the level of hidden economy. Furthermore, we find that vertical trust exerts a larger effect on shadow economy than law enforcement. These results are robust to different specifications of the model.
The rest of the paper is organized as follows: Section 2 presents the theoretical framework and the empirical strategy used in this work; Section 3 shows the results of the analysis, while section 4 concludes.
2. Theoretical framework and empirical strategy 2.1 The model
New empirical findings in tax behaviour literature point out that tax compliance is not only a function of purely economic factors (such as taxation, monitoring and penalty), as suggested by the standard tax evasion model (i.e. Allingham and Sandmo’s model), but also function of socio-psychological variables such as fairness and social norms or tax morale (Torgler, 2003a). Hence, taxpayers can comply because they fear the costs of non-compliance or because they feel an obligation to do so as a (good) member of a community. Expressed in mathematical terms, the general model of tax evasion (or tax compliance) is:
Tax compliance = f (taxation, power of tax authorities, tax morale)
for reason of simplicity, with the concept of power of tax authorities we refer to the overall level of enforcement (penalty and monitoring).
In addition to this, the previous model needs to take into account the role (and the interaction) of power (of) and trust (in) tax authorities for “overall” tax compliance suggested
by the ‘slippery slope’ framework.2
2 According to Kirchler et al. (p. 212, 2008a): «By trust in authorities, we mean the general opinion of individuals and social groups that the tax authorities are benevolent and work beneficially for the common good».
Precisely, Schneider & Fischer (2009) try to formalize this contribution with the
following model (in this specification, tax morale is used as a proxy of tax compliance):
Tax morale = f (vertical trust, power of tax authorities, trust*power)
if ∂(Tax morale)/∂(trust*power) > 0 there is a positive interplay between trust (in) and power (of) tax authorities for tax compliance. Hence, the effects of both dimensions of tax authority on tax compliance re-enforce each other.
However, the ‘slippery slope’ framework distinguishes between two forms of tax compliance: voluntary and enforced. In accordance with the framework, increasing power of the authorities results in an increase of enforced tax compliance, whereas increasing trust is likely to result in enhanced voluntary compliance. Hence, in mathematical terms, the ‘slippery slope’ framework should be represented by a structural model:
Voluntary compliance = f (vertical trust, power of tax authorities) Enforced compliance = f (vertical trust, power of tax authorities)
Furthermore, it predicts that trust increases and power decreases voluntary compliance, whereas power increases and trust decreases enforced compliance (Wahl, Kastlunger and Kirchler, 2010). Indeed, the authors call it a ‘slippery slope’ relation, alluding to its particular functional form.
Obviously, due to data availability, it is a difficult task to take into account the dynamic effects suggested by the slippery slope framework. However, albeit tax morale constitutes a widely accepted measure of intrinsic motivation to pay taxes (Schneider and Torgler, 2006), it
underestimates actual tax compliance (since nothing is said about enforced compliance).3 For
this reason, we use the size of shadow economy as a proxy for tax evasion, thus capturing the “overall” tax compliance. In particular, we estimate the following general model:
Overall tax compliance = f (taxation, tax morale, vertical trust, power of tax authorities)
Our empirical strategy allows us to construct an indicator of tax morale which is independent of the possible effect of vertical trust on the same tax morale. Therefore, this specification allows us to test if vertical trust works only through its relation with tax morale or if it has also an additional separated effect on tax evasion.
2.2 Main variables
3 Indeed, as acknowledged by Schneider and Fisher themselves (p. 11, 2009) « Using information on the attitude tax morale in place of a direct measure of tax evasion may well overestimate true tax honesty, so that any effects we detect in an empirical tax morale context are probably smaller for actual tax compliance ».
Following Halla (2010) our approximated measure of tax evasion (i.e. tax non-compliance behavior) is given by the size of the shadow economy (measured as percentage of
official GDP). The source of this last indicator is Schneider et al. (2010). According to Schneider
et al. (2010, p. 5), « […] the shadow economy includes all market-based legal production of goods and services that are deliberately concealed from public authorities for any of the following reasons: (1) to avoid payment of income, value added or other taxes; (2) to avoid payment of social security contributions; (3) to avoid having to meet certain legal labor market standards, such as minimum wages, maximum working hours, safety standards, etc., and (4) to avoid complying with certain administrative procedures, such as completing statistical questionnaires or other administrative forms ».
In order to measure tax morale and vertical trust we used the responses to ‘WVS – fifth
wave’ questions.4 In particular our measure of tax morale is based on the answer to the
following question: Please tell me for each of the following statements whether you think it can always
be justified, never be justified, or something in between: cheating on taxes if you have a chance . Respondents are asked to evaluate this statement on an ordered scale from “never justifiable” (1) to “always justifiable” (10). Note that an increase in this scale implies a decrease in tax morale.
Our measure of vertical trust is approximated by the confidence in government and is
based on the answer to the following question: I am going to name a number of organizations. For
each one, could you tell me how much confidence you have in them: Government. Is it a great deal of confidence (1), quite a lot of confidence (2), not very much confidence (3) or none at all (4) ? . Also in this case an increase in this scale leads to a decrease in the level of trust in tax authorities.
As regards our proxy of power of tax authorities, i.e. law enforcement, we used an
indicator proposed by Kaufmann et al. (2010), which measures the perceived quality of
contract enforcement, protection of property rights, police and the courts, as well as the likelihood of crime and violence. This indicator assumes values between –2.5 and 2.5, where an increase in the indicator means a better enforcement.
4 WVS was conducted in 2004-2008. In particular the countries and the year in which the survey
was carried out are: Andorra (2005), Argentina (2006), Australia (2005), Burkina Faso (2007), Bulgaria (2006), Brazil (2006), Canada (2006), Switzerland (2007), Chile (2005), China (2007), Colombia (2005), Cyprus (2006), Germany (2006), Egypt (2008), Spain (2007), Ethiopia (2007), Finland (2005) France (2006), United Kingdom (2006), Georgia (2008), Ghana (2007), Guatemala (2005), Honk Kong (2005), Indonesia (2006), India (2006), Iran (2007), Iraq (2006), Italy (2005), Jordan (2007), Japan (2005), South Korea (2005), Morocco (2007), Moldova, Rep. of (2006), Mexico( 2005), Mali (2007), Malaysia (2006), Netherlands (2006), Norway (2008), New Zealand (2004), Peru (2008), Poland (2005), Romania (2005), Rwanda (2007), Serbia (2006), Slovenia (2005), Sweden (2006), Thailand (2007), Trinidad and Tobago (2007), Taiwan (2006), Ukraine (2006), Uruguay (2006), USA (2006), Vietnam (2006), South Africa (2007), Zambia (2007).
In table 1 we report data on the main variables of the model, while in figures 1-2-3 we plotted our measure of tax non-compliance behavior against the indicator of tax morale,
vertical trust and law enforcement, respectively.5 In all cases, the correlations are strong,
statistically significant and of expected sign.6
========== Table 1 and Figures 1-2-3 about here (now at the end) =========
2.3 Empirical strategy
One way to analyze the relation between tax evasion, tax morale and vertical trust is to regress our measure of tax evasion against two aggregate indicators of tax morale and vertical trust given for each country by the simple average of the values obtained from the answers to the two associated WVS questions. However, this simple approach has an important limitation. In particular, cross-countries difference between this type of indicators may not reflect the role of specific national features but only the composition of the population (for instance the level of education or the age structure of the population). We could correct for this by introducing such composition variables directly into the regression for aggregate outcomes, but this would consume too many degrees of freedom.
To avoid this problem we follow an empirical strategy proposed by Algan and Cahuc (2007). In particular, in order to estimate an indicator of a country’s tax morale, we run an ordered probit regression for the associated question on a set of controls which allows to account for population composition effects and other possible confounding factors in the construction of the indicator. These controls are the level of education, the marital status, the number of children, the family income, the employment status, the perceived health status of the respondent, a measure of risk aversion and the respondent’s religious affiliation. It follows that the fixed effect obtained for each country, i.e. the “country dummy variable”, is interpreted as the indicator of the country’s tax morale. In tax morale literature it is often argued that a determinant of tax morale is the vertical trust (see for instance Torgler, 2003a; Torgler 2003b; Frey and Torgler, 2007). For this reason we also include vertical trust as a control. Furthermore, in order to distinguish between vertical trust and horizontal trust (i.e. trust among people), we also included an indicator of horizontal trust obtained through the
following question: Generally speaking, would you say that most people can be trusted (1) or that you
5 In figures 1-2-3, all four indicators have been normalized to be in the interval [0, 1]. In particular,
the indicators of tax morale and vertical trust have been normalized by dividing them by their respective sample maximum. The normalized indicator of rule of law has been obtained by adding the sample minimum to all of the observations and dividing by the sample maximum of this transformed indicator.
6 Recall that the ordering of our variable that measures tax morale implies that an increase in this
need to be very careful in dealing with people (2) ? , and then we created a dummy variable equal to one if the answer is 1 – i.e. most people can be trusted – and 0 otherwise. However, legal institutions may also affect both tax morale and the level of vertical trust. As observed by
Alesina and La Ferrara (2002, p. 210): « [...] in a community where criminal behavior is effectively
persecuted, individuals will trust more because they will feel more protected against extreme non cooperative behavior ». For this reason, we also include our proxy of law enforcement among the controls. Furthermore we believe that the inclusion of this indicator will yield an indicator of tax morale which is net of the possible reverse effect of the widespread of illegal activity on tax morale.
A similar methodology is applied in order to obtain an aggregate indicator for the trust in tax authorities (specifically, the confidence in government). Even in this case we include the control for horizontal trust and the indicator of rule of law.
In table 2 we report the fixed effects associated with tax morale and vertical trust for each county.
========== Table 2 about here (now at the end) =========
Finally, the indicators of tax morale and trust in tax authorities obtained with the methodology described above are used as regressors in an OLS estimate – together with other control variables such as pro-capita GDP, level of education, level of taxation – where the dependent variable is the shadow economy measured as percentage of official GDP.
3. Results of the analysis
3.1 Determinants of Tax Morale and Vertical trust
Table 3 reports the results about the determinants of tax morale and vertical trust (see the Appendix for details about the control variables).
========== Appendix and Table 3 about here (now at the end) =========
Both age and being female imply a higher tax morale and vertical trust (however for the
latter the second result is not statistically significant).7 As regards tax morale, these results are
in line with previous findings by other authors (see for instance Halla, 2010); while, as regards
vertical trust, Guiso et al. (2003) find the same positive relation between the process of ageing
and confidence in government, but a positive effect determined by being male. We recall that our dependent variables – tax morale and vertical trust – are ordered in such a way that a
7 In this section to simplify the exposition, we refer to the impacts of a variable on tax morale (or on
coefficient’s positive sign is to be interpreted as a negative effect on the dependent variable. The reverse is true if the sign is negative.
The relation between tax morale and vertical trust goes in the expected direction. In particular, a decrease in the level of vertical trust leads to a decrease in the level of tax morale and this relation is statistically very significant. Note that once we control for vertical trust, horizontal trust and belonging to a religious denomination are not statistically significant determinants of tax morale. At the same time, horizontal trust and belonging to a religious denomination (this is true for all of the denominations considered) have a positive effect on vertical trust. Also in this case, the positive relation between religiosity and vertical trust are in
line with Guiso et al. (2003)‘s findings. This suggests that vertical trust is a channel through
which national culture can affect tax morale.
Risk aversion is positively correlated with tax morale and this result is strongly statistically significant, whereas the relation between risk aversion and vertical trust is not.
A higher income makes tax evasion more justifiable,8 but at the same leads to higher
vertical trust. However in this latter case the evidence is weak.
The direction of the relation between education and tax morale is theoretically ambiguous. As observed by Torgler (2003b), better educated taxpayers are aware of the benefits and services provided to them by the state, but for this reason they might be more critical on how the state uses tax revenues. In particular, we find that education exerts a positive effect on tax morale but a negative effect on vertical trust. Hence, these results confirm the idea that education positively influences the awareness of the benefit of tax compliance but at the same time makes people more critical about the actions of the state (as observed by
Guiso et al., 2003). It is worthwhile noting that Guiso et al. (2003) find that even if more
educated people have less confidence in the government, they tend to trust other people more. Since horizontal and vertical trust are strongly and positively correlated, these findings suggest that there is a role for education as an instrument to foster vertical trust through the positive effect on horizontal trust.
Finally, better law enforcement leads to both an increase in tax morale and in vertical
trust.9
3.2 Determinants of Tax Evasion
8 In fact, high-income households have more opportunities to evade taxes compared to low-income
households (Halla and Schneider, 2008).
9 In fact, a strong rule of law were shown to increase tax morale (Torgler, Schaffner and Macintyre,
Table 4 shows the results of OLS regression (with or without controls) in which the dependent variable is the size of the shadow economy (measured as percentage of official GDP) and the main independent variables are tax morale, vertical trust and rule of law (see table 5 for a description of all the independent variables).
========== Tables 4 and 5 about here (now at the end) =========
To facilitate the interpretation of the reported coefficient, we normalized the indicators obtained from the two ordered probit reported in table 3 to be in the interval [0, 100]. We did this in two steps. We first obtained an indicator defined in the interval [0, 1], applying the same methodology applied to the rule of law indicator. Afterwards, these two normalized indicators were multiplied by 100. Note that the higher the value assumed by one of these indicators, the lower the tax morale/confidence.
In all cases, vertical trust and rule of law are statistically significant and the relation goes in the expected direction. A decrease in vertical trust leads to an increase in shadow economy, while the opposite is true for an increase in law enforcement. However, the relation between tax morale and our proxy for tax evasion is not statistically significant. Furthermore,
we find that vertical trust exerts a larger impact than rule of law 10 : in particular, a unit
increase in vertical trust indicator (hence an increase in the level of distrust) leads to an increase of 0.27% in the size of the hidden economy, while a unit increase in the rule of law indicator (hence a better law enforcement) leads to a decrease in the size of the hidden economy of 0.20%. Among the other control variables, only GDP per capita is significant.
Table 4 also shows the IV estimate (see column c) in which we instrumented vertical
trust using a variable obtained from the following WVS question: Do you think most people
would try to take advantage of you if they got a chance, or would they try to be fair? Respondents are
asked to evaluate this statement on an ordered scale from “people would try to take advantage of
you” (1) to “people would try to be fair” (10). Following Kawachi et al. (1997), we interpret this
variable as a dimension (the perceived lack of fairness in a society) of horizontal trust. We
named this variable advantage. We believe that the existence of a relation between vertical
trust (instrumented variable) and our instrument is unquestionable. The main issue is whether the belief regarding the opportunistic behavior of others can have a direct effect on tax evasion or whether its effect is only due to its relation with the instrumented variable. In the former case, our instrument is not valid. In general the less likely people are to pay taxes, the stronger the individual incentives to evade. However the chances to adopt opportunistic behavior are 10 In fact, voluntary tax compliance plays a much more decisive role for tax honesty compared to
determined by institutional settings and in particular by the quality of the legal institutions. Since we are controlling for the quality of legal institutions (through the indicator of rule of law) we believe that the residual possible effect on tax evasion of the belief about other people’s opportunistic behavior will be uniquely determined by the trust in the ability of the institutions to prevent and repress these behaviors.
We report the Durbin-Wu-Hausman test for endogeneity. The null hypothesis is that there are no endogenous variables or that endogeneity does not affect the OLS estimator. The null hypothesis cannot be rejected. However, note that this test is not valid if the instrument is not valid and in a just-identified model we are not able to perform a test for the validity of the instrument.
As regards the relevance of our instrument, the Anderson canonical correlation likelihood-ratio test shows that the model is well identified and the instrument is relevant. Furthermore, it also seems that weak identification cannot be claimed (see the Stock-Yogo test).
3.3 Robustness
In this section we check the robustness of our findings introducing both alternative measures of vertical trust (trust in tax authorities) and a variable that captures another dimension of morality (i.e. how much people justify corruption).
The alternative measures of vertical trust are based on the following WVS questions: I
am going to name a number of organizations. For each one, could you tell me how much confidence you have in them: Police: Is it a great deal of confidence (1), quite a lot of confidence (2), not very much confidence (3) or none at all (4) ? Justice system: Is it a great deal of confidence (1), quite a lot of confidence (2), not very much confidence (3) or none at all (4) ? Parliament: Is it a great deal of confidence (1), quite a lot of confidence (2), not very much confidence (3) or none at all (4) ? We named
these alternative measures of vertical trust police, justice and parliament, respectively.
The indicator concerning the acceptability of corruption is based on the following
question: Please tell me for each of the following statements whether you think it can always be
justified, never be justified, or something in between: someone accepting a bribe. Respondents are asked to evaluate this statement on an ordered scale from “never justifiable” (1) to “always
justifiable” (10). We named this variable bribe.
Country level indicators for bribe, police, justice and parliament are obtained with the same methodology applied to tax morale and confidence and discussed in section 2.2. Table 6 shows the results of the ordered probit regression where the dependent variables are bribe, police, justice and parliament, respectively, and the set of regressors is the same as in table 3.
========== Table 6 about here (now at the end) =========
As regards the alternative measures of vertical trust (trust in tax authorities), the results are very similar to those obtained for the confidence in government; while, as regards the acceptability of corruption it is worthwhile to note that it is not correlated with horizontal and vertical trust. An increase in education is associated with an increase in the level of morality. Risk aversion is negatively correlated with the degree of acceptability of corruption. Also, in this case, better law enforcement leads to a higher morality.
Furthermore, we also extracted the first principal component of police, justice, parliament
and confidence in government in order to obtain a variable that synthesizes the four measures of
confidence in institutions. We named this variable institution. Table 7 reports the results of a
regression of hidden economy against bribe, rule, tax morale, confidence (column a), police (column b), parliament (column c), justice (column d), institutions (column e), plus controls for GDP per capita, level of education and tax burden. All the indicators have been normalized to be in the interval [0, 100] where 100 indicates the lowest level of confidence/public morality
(see table 8 for a description of these new variables).11
========== Table 7 about here (now at the end) =========
In all cases, vertical trust (trust in tax authorities) is statistically significant and the relation goes in the expected direction. Furthermore, the indicator regarding acceptability of corruption is statistically significant and its relation goes in the expected direction, i.e. an increase in the acceptability of corruption leads to an increase in the size of the hidden economy. Finally, the acceptability of corruption, taken together with each indicator of vertical
trust (trust in tax authorities), always exerts a larger effect than law enforcement.12
4. Conclusions
Following two important strands of tax compliance literature, this empirical paper develops a cross-section analysis in order to test both the role of tax morale on tax compliance decisions and the main predictions of the slippery slope framework.
Using data from the World Value Surveys (WWS – fifth wave), we show that cultural
variables such as horizontal trust and religious affiliation are strongly and positively related to vertical trust but not to tax morale. When we include these cultural controls in a regression of tax morale versus vertical trust, only the latter is statistically significant. This suggests that
11 The indicators have been normalized using the same methodology applied to the law
enforcement indicator.
12 Note also that in column b the indicator of law enforcement (rule2) is not significant. Probably,
vertical trust is a channel through which national culture can affect tax morale. We also find that an increase in the acceptability of corruption leads to an increase in the size of the hidden economy.
Furthermore, we find empirical support for the slippery slope framework, since both trust in tax authorities and law enforcement (namely, our proxy of power of tax authorities) are negatively and significantly related to the level of hidden economy. In particular, we find that trust in tax authorities exerts a larger effect on shadow economy than law enforcement. These results are robust to different specifications of the model.
A very important policy implication is that Governments should avoid establishing a
cops and robbers climatewith tax-payers. Instead, tax authorities should try to gain the citizens’ trust. As suggested by Wahl, Kastlunger and Kirchler (2010), punishing unintentional filling errors with severe sanctions is a less effective strategy than offering services to correct fill out tax forms. At the same time, being too soft with habitual tax dodgers (e.g. frequently granting tax amnesties) may generate distrust in honest taxpayers and hence lower voluntary compliance.
APPENDIX
Definition of control variables
Religion: we created a dummy variable termed ‘atheist’ if an individual did not belong to a religious denomination and a dummy for each of the other “dominant” religions: Roman Catholic, Orthodox, Protestant, Muslim, Jewish, Buddhist, Hindu, no denominational religion (if an individual declares to being a religious person but to belong to a religion with no
denomination), and other religion (which includes all religions differing from those listed).13
The relative questions in WVS are the following: a) Do you belong to a religious denomination? In
case you do, answer which one; b) Independently of whether you attend religious services or not, would you say you are (read out and code one answer): (1) A religious person (2) Not a religious person (3) A convinced atheist. We split those declaring to not belonging to a religious denomination into two categories: atheist and belonging to a non denominational religion. In particular we define as atheist a person who has declared to being both a convinced atheist and to not belong to a religious denomination, while a person who has declared to being a religious person but to not
belong to a religious denomination enters into the category no denominational religion. Our
reference category is atheist.
Education: We created dummy variables for each of the possible levels reported on the
following WVS question: What is the highest educational level that you have attained? [NOTE: if
respondent indicates to be a student, code highest level s/he expects to complete]: (1) No formal education. (2) Incomplete primary school, (3) Complete primary school, (4) Incomplete secondary school: technical/vocational type, (5) Complete secondary school: technical/vocational type, (6) Incomplete secondary: university-preparatory type, (7) Complete secondary: university-preparatory type, (8) Some university-level education, without degree, (9) University-level education. The
reference category is no formal education. The associated dummy variables are named
respectively: noeduc, incprimary, primary, inctechnical, technical incsecondary, secondary,
someuniv, university. The reference category is noeduc.
Age : respondent’s age in our analysis. Female: a dummy variable equal to one if the
respondent’s sex was female.
Income: we built ten indicators of its level on the basis of the answers to the following
question: Here is a scale of incomes. We would like to know in what group your household is, counting
all wages, salaries, pensions, and other income that comes in. Just give the letter of the group your household falls into, before taxes and other deductions (income categories are coded by decile for each society, 1=lowest decile, 10=highest decile). These indicators are named respectively
firststep, secondstep, thirdstep, fourthstep, fivethstep, sixthstep, seventhstep, eighthstep, ninethstep, tenthstep. The reference category is firststep.
Risk aversion: This variable is obtained through the answers to the following question: Now I will briefly describe some people: Adventure and taking risks are important to this person; to have an exciting life. Would you please indicate whether that person is very much like you, like you, somewhat like you, not like you, or not at all like you ?. We created a variable that goes from 1 if the individual declares “very much like you” to 6 if the individual declares “not at all like you”. Hence an increase in this variable indicates more risk aversion. To our knowledge we are the first to include a control for risk aversion among the determinants of tax morale.
Rule of law: the normalized version of the indicator of law enforcement (named rule)
Table 1. Descriptive statistics
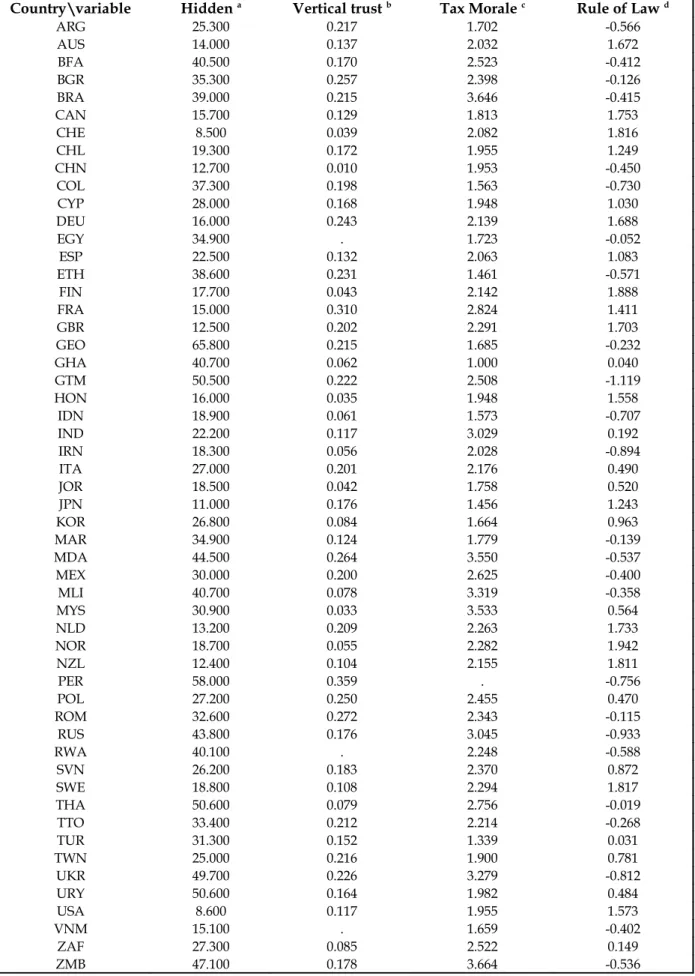
Country\variable Hidden a Vertical trust b Tax Morale c Rule of Law d
ARG 25.300 0.217 1.702 -0.566 AUS 14.000 0.137 2.032 1.672 BFA 40.500 0.170 2.523 -0.412 BGR 35.300 0.257 2.398 -0.126 BRA 39.000 0.215 3.646 -0.415 CAN 15.700 0.129 1.813 1.753 CHE 8.500 0.039 2.082 1.816 CHL 19.300 0.172 1.955 1.249 CHN 12.700 0.010 1.953 -0.450 COL 37.300 0.198 1.563 -0.730 CYP 28.000 0.168 1.948 1.030 DEU 16.000 0.243 2.139 1.688 EGY 34.900 . 1.723 -0.052 ESP 22.500 0.132 2.063 1.083 ETH 38.600 0.231 1.461 -0.571 FIN 17.700 0.043 2.142 1.888 FRA 15.000 0.310 2.824 1.411 GBR 12.500 0.202 2.291 1.703 GEO 65.800 0.215 1.685 -0.232 GHA 40.700 0.062 1.000 0.040 GTM 50.500 0.222 2.508 -1.119 HON 16.000 0.035 1.948 1.558 IDN 18.900 0.061 1.573 -0.707 IND 22.200 0.117 3.029 0.192 IRN 18.300 0.056 2.028 -0.894 ITA 27.000 0.201 2.176 0.490 JOR 18.500 0.042 1.758 0.520 JPN 11.000 0.176 1.456 1.243 KOR 26.800 0.084 1.664 0.963 MAR 34.900 0.124 1.779 -0.139 MDA 44.500 0.264 3.550 -0.537 MEX 30.000 0.200 2.625 -0.400 MLI 40.700 0.078 3.319 -0.358 MYS 30.900 0.033 3.533 0.564 NLD 13.200 0.209 2.263 1.733 NOR 18.700 0.055 2.282 1.942 NZL 12.400 0.104 2.155 1.811 PER 58.000 0.359 . -0.756 POL 27.200 0.250 2.455 0.470 ROM 32.600 0.272 2.343 -0.115 RUS 43.800 0.176 3.045 -0.933 RWA 40.100 . 2.248 -0.588 SVN 26.200 0.183 2.370 0.872 SWE 18.800 0.108 2.294 1.817 THA 50.600 0.079 2.756 -0.019 TTO 33.400 0.212 2.214 -0.268 TUR 31.300 0.152 1.339 0.031 TWN 25.000 0.216 1.900 0.781 UKR 49.700 0.226 3.279 -0.812 URY 50.600 0.164 1.982 0.484 USA 8.600 0.117 1.955 1.573 VNM 15.100 . 1.659 -0.402 ZAF 27.300 0.085 2.522 0.149 ZMB 47.100 0.178 3.664 -0.536
a size of the hidden economy as percentage of official GDP. Average 1999-2007.Source: Schneider et al. (‘10) bpercentage of people declaring “not at all” confidence in government. Source: WVS (fifth wave)
c country mean. A higher value indicates lower tax morale. Source: WVS(fifth wave)
ARG AUS BFA BGR BRA CAN CHE CHL CHN COL CYP DEU ESP ETH FIN FRA GBR GEO GHA GTM HON IDN IND IRN ITA JOR JPN KOR MAR MDA MEX MLI MYS NLD NOR NZL PER POL ROM RUS SVN SWE THA TTO TUR TWN UKR URY USA ZAF ZMB .2 .4 .6 .8 1 H id d en 0 .2 .4 .6 .8 1 Distrust in Government
The two indicators have been normalized dividing them by their maximum
(corr.=0.39;sig.=0.0048)
Hidden vs. Distrust in Government
ARG AUS BFA BGR BRA CAN CHE CHL CHN COL CYP DEU EGY ESP ETH FIN FRA GBR GEO GHA GTM HON IDN IND IRN ITA JOR JPN KOR MAR MDA MEX MLI MYS NLD NOR NZL POL ROM RUS RWA SVN SWE THA TTO TUR TWN UKR URY USA VNM ZAF ZMB .2 .4 .6 .8 1 H id d en .2 .4 .6 .8 1 Tax Morale
The two indicators have been normalized dividing them by their maximum
(corr.=0.30;sig.=0.027)
Hidden vs. Tax Morale
Figure 2
ARG AUS BFA BGR BRA CAN CHE CHL CHN COL CYP DEU EGY ESP ETH FIN FRA GBR GEO GHA GTM HON IDN IND IRN ITA JOR JPN KOR MAR MDA MEX MLI MYS NLD NOR NZL PER POL ROM RUS RWA SVN SWE THA TTO TUR TWN UKR URY USA VNM ZAF ZMB .2 .4 .6 .8 1 H id d en 0 .2 .4 .6 .8 1 Rule of LawRule of Law has been normalized by adding its minimum and then dividing by its maximum
(corr.= -0.69 ;sig.=0.000)
Hidden vs. Rule of Law
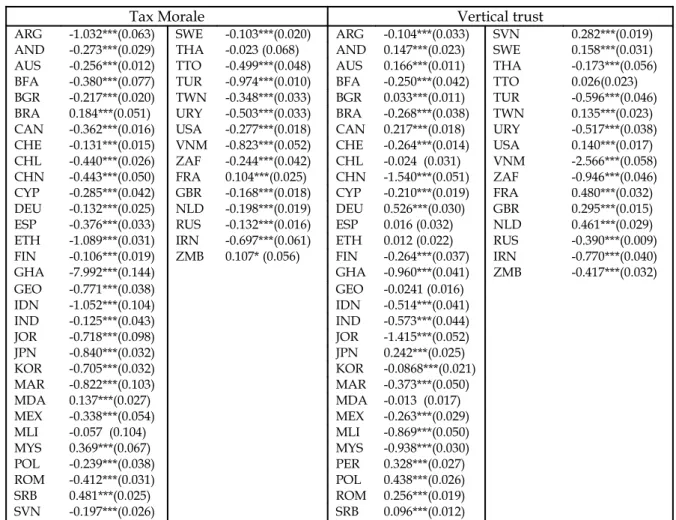
Table 2. Country fixed effects
Tax Morale Vertical trust
ARG -1.032***(0.063) SWE -0.103***(0.020) ARG -0.104***(0.033) SVN 0.282***(0.019)
AND -0.273***(0.029) THA -0.023 (0.068) AND 0.147***(0.023) SWE 0.158***(0.031)
AUS -0.256***(0.012) TTO -0.499***(0.048) AUS 0.166***(0.011) THA -0.173***(0.056)
BFA -0.380***(0.077) TUR -0.974***(0.010) BFA -0.250***(0.042) TTO 0.026(0.023)
BGR -0.217***(0.020) TWN -0.348***(0.033) BGR 0.033***(0.011) TUR -0.596***(0.046)
BRA 0.184***(0.051) URY -0.503***(0.033) BRA -0.268***(0.038) TWN 0.135***(0.023)
CAN -0.362***(0.016) USA -0.277***(0.018) CAN 0.217***(0.018) URY -0.517***(0.038)
CHE -0.131***(0.015) VNM -0.823***(0.052) CHE -0.264***(0.014) USA 0.140***(0.017)
CHL -0.440***(0.026) ZAF -0.244***(0.042) CHL -0.024 (0.031) VNM -2.566***(0.058)
CHN -0.443***(0.050) FRA 0.104***(0.025) CHN -1.540***(0.051) ZAF -0.946***(0.046)
CYP -0.285***(0.042) GBR -0.168***(0.018) CYP -0.210***(0.019) FRA 0.480***(0.032)
DEU -0.132***(0.025) NLD -0.198***(0.019) DEU 0.526***(0.030) GBR 0.295***(0.015)
ESP -0.376***(0.033) RUS -0.132***(0.016) ESP 0.016 (0.032) NLD 0.461***(0.029)
ETH -1.089***(0.031) IRN -0.697***(0.061) ETH 0.012 (0.022) RUS -0.390***(0.009)
FIN -0.106***(0.019) ZMB 0.107* (0.056) FIN -0.264***(0.037) IRN -0.770***(0.040)
GHA -7.992***(0.144) GHA -0.960***(0.041) ZMB -0.417***(0.032) GEO -0.771***(0.038) GEO -0.0241 (0.016) IDN -1.052***(0.104) IDN -0.514***(0.041) IND -0.125***(0.043) IND -0.573***(0.044) JOR -0.718***(0.098) JOR -1.415***(0.052) JPN -0.840***(0.032) JPN 0.242***(0.025) KOR -0.705***(0.032) KOR -0.0868***(0.021) MAR -0.822***(0.103) MAR -0.373***(0.050) MDA 0.137***(0.027) MDA -0.013 (0.017) MEX -0.338***(0.054) MEX -0.263***(0.029) MLI -0.057 (0.104) MLI -0.869***(0.050) MYS 0.369***(0.067) MYS -0.938***(0.030) POL -0.239***(0.038) PER 0.328***(0.027) ROM -0.412***(0.031) POL 0.438***(0.026) SRB 0.481***(0.025) ROM 0.256***(0.019) SVN -0.197***(0.026) SRB 0.096***(0.012)
Cluster Robust Standard errors in parentheses. * p<0.10, ** p<0.05, *** p<0.01
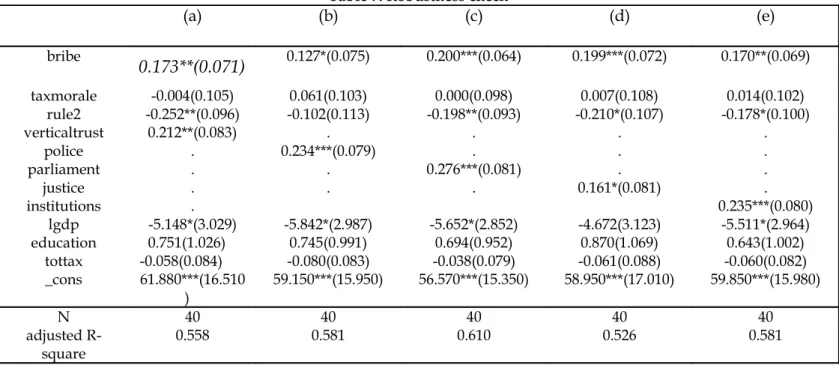
(a)
Tax Morale Vertical trust(b) age -0.005*** (0.000) -0.002** (0.000) female -0.083*** (0.020) -0.021 (0.014) horiztrust 0.027 (0.023) -0.222*** (0.020) verticaltrust 0.073*** (0.013) . nodenomrel 0.029 (0.063) -0.078* (0.047) otherrel -0.003 (0.042) -0.099*** (0.038) catholic -0.003 (0.055) -0.193*** (0.039) muslim -0.103 (0.095) -0.311*** (0.064) protestant -0.070 (0.052) -0.157*** (0.051) orthodox 0.020 (0.086) -0.159*** (0.044) buddhist 0.031 (0.058) -0.134** (0.067) riskaversion -0.069*** (0.008) 0.010 (0.007) incprimary -0.079** (0.038) 0.000 (0.043) primary -0.051 (0.036) 0.037 (0.043) technical -0.118*** (0.036) 0.129*** (0.050) inctechnical -0.071* (0.039) 0.118*** (0.045) incsecondary -0.114*** (0.037) 0.086* (0.048) secondary -0.142*** (0.038) 0.132** (0.053) someuniv -0.094** (0.041) 0.131** (0.055) university -0.184*** (0.038) 0.161** (0.065) secondstep 0.003 (0.036) -0.002 (0.032) thirdstep -0.008 (0.031) 0.011 (0.027) fourthstep 0.065** (0.029) 0.016 (0.025) fifthstep 0.039 (0.030) -0.019 (0.019) sixthstep 0.085** (0.038) -0.037 (0.028) seventhstep 0.096*** (0.033) -0.031 (0.034) eighthtstep 0.101*** (0.038) 0.008 (0.039) ninethstep 0.153*** (0.051) -0.080** (0.039) tenthstep 0.122* (0.066) -0.023 (0.055) rule -0.413*** (0.079) -0.651*** (0.040) N 61314 63981 pseudo R-square 0.049 0.096
Controlling for marital status, employment status, health status and number of children.
Marital status controls has been inserted by creating an indicator for each of the following statuses: single, cohabiting, married, separated, divorced and widowed. We also included indicators for each employment status on the basis of the question: “Are you employed now or not? If yes: About how many hours a week? If more than one job: only for the main job” (1 = full time; 2 = part time; 3 =self employed; 4 = retired; 5 = housewife; 6 = student; 7 = unemployed; 8 = other). We created an indicator equal to one for each state of health. These variables were respectively named, phealth, fhealth,
ghealth, vghealth.
Country fixed effect for column (a) and (b) are respectively reported in Table 2 Cluster Robust Standard errors in parentheses
Table 4. Tax Evasion against Tax Morale, Vertical trust, Law enforcement
(a) OLS (b) OLS (c) IV
rule2 -0.377***(0.063) -0.205**(0.100) -0.199**(0.093) verticaltrust 0.206***(0.076) 0.273***(0.084) 0.312**(0.134) taxmorale -0.083(0.107) 0.031(0.111) 0.025(0.103) lgdp -6.075*(3.220) -6.304**(3.005) education 0.299(1.081) 0.173(1.048) tottax -0.073(0.090) -0.073(0.082) (0.090) (0.082) _cons 42.43***(10.130) 73.22***(16.970) 73.68***(15.510) N 46 40 40 adjusted R-square 0.447 0.493 0.490 Tests of endogeneity of: confidence
H0:Regressor is exogenous
Durbin-Wu-Hausman chi-sq test: 0.12510 Chi-sq(1) P-value = 0.724 Underidentification test
(Anderson canon. corr. LM statistic):
Chi-sq(1) P-val:
13.182 0.000 Weak identification test (Cragg-Donald Wald F statistic):
Stock-Yogo weak ID test critical values:
10% maximal IV size 15% maximal IV size 20% maximal IV size 25% maximal IV size 16.222 16.38 8.96 6.66 5.53 Standard errors in parentheses.
Table 5. Variables: definitions and sources
Rule2
Indicator of law enforcement. It ranges from 0 to 100, where 0 indicates the
lowest level of law enforcement, while 100 the highest level. Source: Kaufmann
et al (2010)
Vertical
trust
Indicator of confidence in tax authorities (approximated with confidence in
government). It ranges from 0 to 100, where 0 indicates the highest level of
confidence, while 100 the lowest. Source: Our elaborations on WVS data
taxmorale
Indicator of tax morale. It ranges from 0 to 100, where 0 indicates the highest level of tax morale, while 100 the lowest. Source: Our elaborations on WVS datalgdp
Log of GDP pro capita at constant price and in PPP (base year 2003). For each
country we take the year correspondent to WVS year. Our elaboration on IMF
data: W. E.O. Database
http://www.imf.org/external/pubs/ft/weo/2010/02/weodata/index.aspx
education
Average year of schooling. Year: 2005. Source: Barro and Lee (2010)
tottax
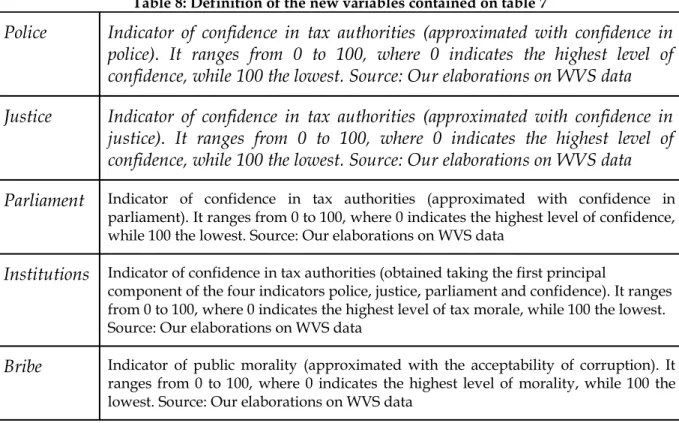
Total tax rate is the total amount of taxes payable by businesses (except for labor taxes) after accounting for deductions and exemptions as a percentage of profit. For each country we take the year correspondent to WVS year.Table 6: Determinants of Bribe, confidence in police, parliament and justice system
(a)
bribe police(b) parliament(c) justice(d) age -0.006***(0.001) -0.002**(0.001) -0.001*(0.001) 0.001(0.001) female -0.055***(0.014) -0.043***(0.013) 0.014(0.015) -0.036***(0.012) horiztrust 0.007(0.024) -0.189***(0.020) -0.196***(0.024) -0.212***(0.023) verticaltrust 0.020(0.013) . . . nodenomrel 0.049(0.044) -0.145***(0.041) -0.0670(0.055) -0.101**(0.040) otherrel 0.074**(0.031) -0.153***(0.026) -0.055(0.042) -0.098***(0.028) catholic 0.062(0.045) -0.240***(0.031) -0.175***(0.044) -0.175***(0.029) muslim 0.033(0.099) -0.299***(0.064) -0.248***(0.066) -0.271***(0.070) protestant -0.002(0.047) -0.233***(0.039) -0.134***(0.050) -0.157***(0.034) orthodox 0.043(0.077) -0.132**(0.059) -0.141***(0.051) -0.112**(0.053) buddhist 0.111*(0.057) -0.173***(0.052) -0.082(0.076) -0.070(0.068) riskaversion -0.081***(0.009) 0.001(0.007) 0.023***(0.007) 0.006(0.008) incprimary -0.038(0.042) 0.073*(0.041) 0.005(0.045) 0.015(0.044) primary -0.061(0.042) 0.120***(0.040) 0.033(0.044) 0.106**(0.046) technical -0.143***(0.047) 0.208***(0.045) 0.010**(0.047) 0.171***(0.053) inctechnical -0.066(0.040) 0.193***(0.038) 0.090**(0.039) 0.170***(0.045) incsecondary -0.164***(0.054) 0.147***(0.044) 0.044(0.065) 0.132**(0.051) secondary -0.212***(0.055) 0.228***(0.044) 0.081*(0.047) 0.177***(0.052) someuniv -0.186***(0.058) 0.257***(0.052) 0.073(0.057) 0.166***(0.055) university -0.290***(0.055) 0.284***(0.053) 0.094(0.066) 0.197***(0.067) secondstep -0.032(0.034) -0.015(0.024) 0.013(0.027) 0.009(0.032) thirdstep -0.048(0.034) -0.004(0.021) 0.001(0.0223) 0.030(0.026) fourthstep 0.006(0.029) 0.003(0.020) -0.007(0.023) 0.021(0.027) fifthstep -0.006(0.028) -0.021(0.021) -0.036*(0.019) 0.004(0.024) sixthstep 0.048(0.039) -0.068***(0.026) -0.065**(0.029) -0.060**(0.029) seventhstep 0.061(0.038) -0.043(0.029) -0.036(0.032) -0.043*(0.025) eighthstep 0.063*(0.037) -0.059*(0.033) -0.025(0.0354) -0.025(0.036) ninethstep 0.115**(0.050) -0.092**(0.045) -0.090**(0.041) -0.030(0.041) tenthstep 0.083(0.090) 0.005(0.047) -0.039(0.054) -0.047(0.051) rule -0.989***(0.083) -1.367***(0.061) -1.181***(0.049) -1.405***(0.056) N 61487 66191 63402 65360 pseudo R-sq 0.055 0.084 0.112 0.088
Controlling for marital status, employment status, health perceived status and country fixed effects. Robust cluster standard errors in parentheses
Table 7: Robustness check (a) (b) (c) (d) (e) bribe
0.173**(0.071)
0.127*(0.075) 0.200***(0.064) 0.199***(0.072) 0.170**(0.069) taxmorale -0.004(0.105) 0.061(0.103) 0.000(0.098) 0.007(0.108) 0.014(0.102) rule2 -0.252**(0.096) -0.102(0.113) -0.198**(0.093) -0.210*(0.107) -0.178*(0.100) verticaltrust 0.212**(0.083) . . . . police . 0.234***(0.079) . . . parliament . . 0.276***(0.081) . . justice . . . 0.161*(0.081) . institutions . 0.235***(0.080) lgdp -5.148*(3.029) -5.842*(2.987) -5.652*(2.852) -4.672(3.123) -5.511*(2.964) education 0.751(1.026) 0.745(0.991) 0.694(0.952) 0.870(1.069) 0.643(1.002) tottax -0.058(0.084) -0.080(0.083) -0.038(0.079) -0.061(0.088) -0.060(0.082) _cons 61.880***(16.510 ) 59.150***(15.950) 56.570***(15.350) 58.950***(17.010) 59.850***(15.980) N 40 40 40 40 40 adjusted R-square 0.558 0.581 0.610 0.526 0.581Standard errors in parentheses * p<0.10, ** p<0.05, *** p<0.01
Table 8: Definition of the new variables contained on table 7
Police
Indicator of confidence in tax authorities (approximated with confidence in
police). It ranges from 0 to 100, where 0 indicates the highest level of
confidence, while 100 the lowest. Source: Our elaborations on WVS data
Justice
Indicator of confidence in tax authorities (approximated with confidence in
justice). It ranges from 0 to 100, where 0 indicates the highest level of
confidence, while 100 the lowest. Source: Our elaborations on WVS data
Parliament
Indicator of confidence in tax authorities (approximated with confidence inparliament). It ranges from 0 to 100, where 0 indicates the highest level of confidence, while 100 the lowest. Source: Our elaborations on WVS data
Institutions
Indicator of confidence in tax authorities (obtained taking the first principalcomponent of the four indicators police, justice, parliament and confidence). It ranges from 0 to 100, where 0 indicates the highest level of tax morale, while 100 the lowest. Source: Our elaborations on WVS data
Bribe
Indicator of public morality (approximated with the acceptability of corruption). Itranges from 0 to 100, where 0 indicates the highest level of morality, while 100 the lowest. Source: Our elaborations on WVS data
References
Alesina A., and E. La Ferrara (2002), “Who trusts others ?”, Journal of Public Economics, 85(2),
207-234, August.
Algan, Y., and P. Cahuc (2007), “The Roots of Low European Employment: Family Culture ?”,
in Pissarides, C. and Frenkel, J. (eds.), NBER International Seminar on Macroeconomics
2005, MIT Press, 65-109.
Allingham, M., and A. Sandmo (1972), “Income Tax Evasion: A Theoretical Analysis”, Journal
of Public Economics, 1(3-4), 323-338.
Alm, J., G. H. McClelland, and W. D. Schulze (1992), “Why do People Pay Taxes ?”, Journal of
Public Economics, 48(1), 21-38.
Alm, J., and B. Torgler (2006), “Culture Differences and Tax Morale in the United States and in
Europe”, Journal of Economic Psychology, 72(2), 224-246, April.
Alm, J., J. Martinez-Vazque, and B. Torgler (2006), “Russian Attitudes Toward Paying Taxes –
Before, During, and After the Transition”, International Journal of Social Economics,
33(12), 832-857.
Barone, G., and S. Mocetti (2009), “Tax Morale and Public Spending Inefficiency”, Temi di
discussione (Economic working papers), 732, Bank of Italy.
Barro, R. J., and J. W. Lee (2010), “A New Data Set of Educational Attainment in the World,
1950-2010”, NBER Working Paper, 15902.
Elster, J. (1989), “Social Norms and Economic Theory”, Journal of Economic Perspectives, 3(4),
99-117.
Falkinger, J. (1995), “Tax evasion, consumption of public goods and fairness”, Journal of
Economic Psychology, 16(1), 63-72.
Feld, L. P., and B. S. Frey (2002), “Trust Breeds Trust: How Taxpayers Are Treated”, Economics
of Governance, 3(2), 87-99.
Fischer, J., and F. Schneider (2009), “The puzzle of tax compliance revisited: testing the ‘slippery slope’ hypothesis for trust and power against field data”. Downloadable from: www.sgvs.ch/congress09/upload/p_296.pdf.
Frey, B., and B. Torgler (2007), “Tax Morale and Conditional Cooperation”, Journal of
Comparative Economics, 35 (1) 136–159.
Guiso, L., P. Sapienza, and L. Zingales (2003), “People’s Opium ? Religion and Economic
Attitudes”, Journal of Monetary Economics, 50(1), 225-282, January.
Halla, Martin, and Friedrich Schneider (2008), “Taxes and Benefits: Two Distinct Options to
Halla, M. (2010), “Tax Morale and Compliance Behavior: First Evidence on a Causal Link”,
IZA Discussion Papers, 4918.
Kaufmann, D., A. Kraay, and M. Mastruzzi (2010), “The Worldwide Governance Indicators.
Methodology and Analytical Issues”, World Bank Policy Research Working Paper, 5430.
Kawachi, I., B. Kennedy, K. Lochner, and D. Pothrow-Smith (1997), “Social Capital, Income
Inequality, and Mortality”, American Journal of Public Health, 87(9), 1491-1498.
Kirchler, E. (2007) The Economic Psychology of Tax Behaviour (Cambridge, UK: Cambridge
University Press).
Kirchler, E., E. Hoelzl, and I. Wahl (2008a), “Enforced Versus Voluntary Tax Compliance: the
‘Slippery Slope’ Framework, Journal of Economic Psychology, 29(2), 210–225.
Kirchler, E., S. Muehlbacher, and B. Kastlunger, and I. Wahl (2008b), “Why Pay Taxes ? A Review of Tax Compliance Decisions”, in: Jorge Martinez-Vazquez, Benno Torgler, and
James Alm (Ed.) Developing Alternative Frameworks for Explaining Tax Compliance
(Abingdon, Oxon: Routledge).
Kolm, A. S., and B. Larsen (2002), “Social norm, the informal sector and unemployment”,
Working Papers Copenhagen Business School, 04-2002.
Lisi, G., and M. Pugno (2011), “Tax Morale, Entrepreneurship, and the Irregular Economy”,
AUCO Czech Economic Review, 5(2), forthcoming.
Lisi, G. (2011), “Job search theory and the slippery slope framework: an attempt to
integration”, Working Paper DIPSE, n. 2/2011, February.
Muehlbacher, S., and E. Kirchler (2010), “Tax Compliance by Trust and Power of Authorities”,
International Economic Journal, 24(4), 607-610.
Prinz, A., S. Muehlbacher, and E. Kirchler (2010), “The Slippery Slope Framework: An Attempt to Formalization”, mimeo.
Rothstein, B. (2000), “Trust, Social Dilemmas and Collective Memories”, Journal of Theoretical
Politics, 12(4), 477-501.
Sandmo, A. (2005), “The Theory of Tax Evasion: A Retrospective View”, National Tax Journal,
58(4), 643–663.
Schneider, F., A. Buehn, and C. A. Montenegro (2010). “Shadow economies all over the world:
new estimates for 162 countries from 1999 to 2007”, The World Bank Policy Research
Working Paper Series, 5356.
Slemrod, J. (2007), “Cheating Ourselves: The Economics of Tax Evasion,” Journal of Economic
Perspectives”, 21(1), 25-48.
Smith, Adam (1776), An inquiry into the nature and of the wealth of nations, Penn State Electronic
Classics edition, republished 2005.
Torgler, B. (2003a), “Tax Morale, Rule Governed Behaviour and Trust”, Constitutional Political
Torgler, B. (2003b), “Tax Morale and Institutions”, CREMA Working paper, n. 2003 - 09.
Torgler, B. (2005), “Tax Morale in Latin America”, Public Choice, 122(1), 133-157.
Torgler, B., and F. Schneider (2006), “What Shapes Attitudes Toward Paying Taxes ? Evidence
from Multicultural European Countries”, IZA Discussion Papers, 2117.
Torgler, B., M. Schaffner, and A. Macintyre (2007), “Tax Compliance, Tax Morale and
Governance Quality”, CREMA Working Paper Series, 2007-17.
Torgler, B. (2007), Tax Compliance and Tax Morale: A Theoretical and Empirical Analysis, Edward
Elgar, Cheltenham, UK.
Torgler, B., and F. Schneider (2007), “Shadow Economy, Tax Morale, Governance and
Institutional Quality: A Panel Analysis”, IZA Discussion Papers, 2563.
Traxler, C. (2010), “Social Norms and Conditional Cooperative Taxpayers”, European Journal of
Political Economy, 26(1), 89-103.
Wahl, I., B. Kastlunger, and E. Kirchler (2010), “Trust in Authorities and Power to Enforce Tax
Compliance: An Empirical Analysis of the Slippery Slope Framework”, Law & Policy,