Institute of Economic Studies, Faculty of Social Sciences Charles University in Prague
Could the Stability and
Growth Pact Be Substituted
by the Financial Markets?
Terezie Výprachtická
Institute of Economic Studies, Faculty of Social Sciences, Charles University in Prague
[UK FSV – IES]
Opletalova 26 CZ-110 00, Prague E-mail : [email protected]
http://ies.fsv.cuni.cz
Institut ekonomických studií Fakulta sociálních věd Univerzita Karlova v Praze
Opletalova 26 110 00 Praha 1
E-mail : [email protected] http://ies.fsv.cuni.cz
Disclaimer: The IES Working Papers is an online paper series for works by the faculty and students of the Institute of Economic Studies, Faculty of Social Sciences, Charles University in Prague, Czech Republic. The papers are peer reviewed, but they are not edited or formatted by the editors. The views expressed in documents served by this site do not reflect the views of the IES or any other Charles University Department. They are the sole property of the respective authors. Additional info at: [email protected]
Copyright Notice: Although all documents published by the IES are provided without charge, they are licensed for personal, academic or educational use. All rights are reserved by the authors.
Citations: All references to documents served by this site must be appropriately cited.
Bibliographic information:
Výprachtická, T. (2010). “Could the Stability and Growth Pact Be Substituted by the Financial Markets?” IES Working Paper 30/2010. IES FSV. Charles University.
Could the Stability and Growth Pact Be
Substituted by the Financial Markets?
Terezie Výprachtická*
*IES, Charles University Prague E-mail: [email protected]
December 2010 Abstract:
In the discussions of the need for fiscal rules and their usefulness in a monetary union researchers have not agreed on whether the financial markets have a sufficiently disciplining effect on the governments, which would mean that the fiscal rules are not necessary. This paper investigates whether the European Union’s main fiscal rule, the Stability and Growth Pact, could be substituted by the financial markets, taking into account also the effects of the latest financial and economic crisis. Our findings suggest that there is certain interaction between the financial markets and the governments’ decisions on the fiscal policies and that this reaction has become stronger after the beginning of the crisis. However, the institutional setup and market conditions in the European Union are such that this interaction is biased and thus we conclude that the Union needs to have fiscal rules.
Keywords: European Economic and Monetary Union, Stability and Growth Pact, Financial markets, Fiscal rules
JEL:C23, E44, E62, H62, H74, H87 Acknowledgements:
The author would like to express her gratitude to prof. Kateřina Šmídková and Dr. Roman Horváth for their advice and would also like to thank the Centre français de recherche en sciences sociales for their support when writing this article.
TABLE OF CONTENTS
1 Introduction ... 2
2 Related literature ... 4
2.1 Institutional setup and market conditions ... 4
2.2 The markets’ reaction... 5
2.3 The governments’ reaction ... 7
3 Data and method ... 8
3.1 The markets’ reaction... 8
3.2 The governments’ reaction ... 11
4 Estimation results ... 13
4.1 The markets’ reaction... 13
4.2 The governments’ reaction ... 16
5 Conclusion ... 18 APPENDIX ... 20 REFERENCES ... 24 ABBREVIATIONS ... 27
LIST OF TABLES
Table 1 - Estimation results 1 ... 16
Table 2 - Estimation results 2 ... 18
LIST OF FIGURES
Figure 1 - Government bond yield spreads of chosen EMU countries in 1985 – 2009 ... 10Figure 2 - Government bond yield spreads of EMU countries in 1999 – 2009 ... 11
Figure 3 - Structural primary balance of EMU countries in 1999 – 2009 ... 14
2
1
Introduction
The European Economic and Monetary Union (EMU) is a very unique project, both from the political and economic point of view. Its functioning was based on the Maastricht Treaty where, inter alia, the well-known limits on government deficit and debt ratios to GDP were set (3% and 60%, respectively).1 It, however, seems that the member states did not consider the provisions of the Maastricht Treaty sufficient to ensure fiscal discipline after the accession of the member states to the EMU, as they later concluded the Stability and Growth Pact (SGP).
The establishment of the EMU necessitated a lot of changes, such as a new currency, new institutions (especially the European Central Bank2) and the already mentioned new set of fiscal rules that should ensure a good working of the monetary union, the SGP. Ever since its adoption the SGP has been quite controversial. One reason for criticisms of the Pact is the fact that certain economists questioned the need for fiscal rules in the EMU at all. In their work researchers have identified several reasons for the application or non-application of fiscal rules in a monetary union.
First, there is the issue of the credibility of the central bank and its commitment to price stability. Researchers dealing with this, such as Eijffinger & de Haan (2000), Beetsma et al. (2001), Buiter (2006), Lindbeck & Niepelt (2006), Ardy et al. (2006) or Fitoussi & Saraceno (2007), mostly share the opinion that the absence of fiscal rules and thus the existence of expansive fiscal policies could hamper the credibility of the monetary authority and weaken its commitment to keeping the price level stable.
Second, there is the tendency of governments to run budget deficits. Researchers generally agree that this is a legitimate reason for the existence of fiscal rules (see e.g. Eijffinger & de Haan (2000), Kopits (2001), Stark (2001), Schneider & Hedbavny (2003), Wyplosz (2006), Catenaro & Morris (2008)).
Third, the impact of unsound fiscal policies on union-wide interest rates is often discussed. Most of the researchers treating this issue are of the opinion that this effect may be dangerous (see e.g. Feldstein (2005), Ardy et al. (2006), Lindbeck & Niepelt (2006), Catenaro & Morris (2008)). However, certain authors disagree, such as Wyplosz (2006) or Fitoussi & Saraceno (2007).
1 One of the clauses of the Maastricht Treaty that is very important for our analysis is Article 104b of the TEU
(in original version) that provides for a non-bailout clause: neither the Community, nor any of its members should be liable for the commitments of a member state’s government or other public authorities.
2 Its main task was set to ensure the stability of the new currency through a stable price level. Furthermore it was
decided that the ECB ought to be independent of the national and Community political authorities and is prohibited from providing any type of credit to the member states’ governments or Community institutions.
Many arguments why fiscal rules should not be used in a monetary union also exist. These are mentioned e.g. by Beetsma et al. (2001), Kopits (2001) and Woods (2008). They cover effects of fiscal rules like the governments’ limited scope for reaction to shocks or their resort to creative accounting.
Another one is the claim that fiscal rules are actually not needed because they can be substituted by the disciplining effect of the financial markets. Fitoussi & Saraceno (2007) recall two papers (by Alesina et al. (1992) and Bernoth (2004)) which conclude that markets are able to monitor fiscal performance and put pressure on governments through the spreads between different bonds and that they have not lost this ability after the introduction of the EMU.
Eijffinger & de Haan (2000) claim that markets may not be disciplining enough. They explain that the markets might not differentiate between a fiscally disciplined and undisciplined country within a monetary union by demanding different yields on their government bonds because they may expect that even if, in the case of the EMU, the Maastricht Treaty provided for a no-bail-out clause, the Union would help a member state in troubles for political reasons. This view is supported by Hedbavny et al. (2004) who, when comparing the EU with the US, claim that the markets have a higher probability of expecting a bail-out in the EU because this union has fewer member states than the US and thus all countries have a greater influence on all important decisions. This view is, however, opposed by Schucknecht et al. (2008) who claim that based on their findings the no-bailout clause in the Maastricht Treaty seems to be credible.
Furthermore, according to Eijffinger & de Haan (2000), markets tend to react slowly to an unsustainable fiscal position and then, when they finally (and often very strongly) react, such event can have contagion consequences. This was in fact confirmed in 2010 when we saw a sudden significant increase in spreads of Greece and then also of certain other countries (especially Ireland and Portugal).
Woods (2008) agrees that until 2008 the markets have not been differentiating significantly among different euro government bonds. He reminds that we can expect that the markets may not reflect the individual countries’ situation properly, but also that their reactions might be ‘abrupt and potentially very disruptive’. This is very well in line with the conclusions of Eijffinger & de Haan (2000) and also with the findings of Schucknecht et al. (2010) according to whom markets reacted 3-4 times more strongly to deficit differentials and 7-8 times more strongly to debt differentials after the beginning of the financial crisis.
Kopits (2001) argues that well designed fiscal rules could have the same effect as the markets on the governments’ fiscal behaviour, but in a quicker and more efficient way and without their reactions’ adverse consequences such as high risk premiums or abrupt outflows of capital.
We investigate the question of the substitutability of the SGP by the financial markets by analysing three different issues: first, the financial markets’ reaction to changing fiscal
4
behaviour of the states; second, the governments’ response in terms of fiscal behaviour to the markets increasing their costs of borrowing; and, third, the question whether the market conditions and institutional setting in the EMU do not hamper these reactions or do not make them biased and inefficient. Therefore we test whether the government bond yield spreads change in reaction to increasing budget deficits and public debts, assuming that when a state’s fiscal stance starts to deteriorate, financial markets begin to ask a higher risk premium and thus the country’s government bond yields (and therefore also the spread relative to a benchmark) increase. Then we test whether the governments improve the structural primary balance when the spreads of their bonds increase, assuming that when the yields on government bonds increase, the costs of borrowing for a given country also grow and such country’s government reacts to this by increasing its structural primary balance, trying to reverse the trend. To do this we use data until the end of year 2009 to see what the impact of the recent crisis was.
The paper is organized as follows: in Section 2 we provide an overview of the related literature and also discuss the institutional conditions in the EMU that may significantly influence our conclusions. In Section 3 we present the data used for the investigation of the financial markets’ and the governments’ behaviour, performing also tests of statistical properties of the data. We then outline the method used for the estimation. In Section 4 we show our estimation results and in Section 5 we conclude.
2
Related
literature
To tackle the question whether the Stability and Growth Pact could be substituted by the financial markets requires investigating three issues: first, whether the institutional setup and market conditions in the EMU enable an efficient working of the financial markets and a responsible behaviour of the governments; second, whether the financial markets react to a worsening fiscal stance of a government; and third, whether governments change their fiscal behaviour appropriately to the market signals. While many researchers have studied what drives yields (or spreads) of government bonds, only a few have explored the reaction of the governments to the market signals.
2.1
Institutional
setup
and
market
conditions
At the beginning of their paper, Balassone et al. (2004) remind that there are many prerequisites for the financial markets to be effective in disciplining the fiscal behaviour of the governments. They mention eight important, partly overlapping conditions that were outlined by Bishop et al. (1989) and Lane (1993). These can be summarized as follows: first, there is free movement of capital. Second, governments do not have privileged access to the market. Third, markets have access to all necessary information on sovereign borrowers. Fourth, bail-out is not allowed, there is no external guarantee and debts cannot be monetized. Fifth, the financial system can absorb the bankruptcy of a sovereign borrower. Finally, borrowing governments do respond to market signals.
Balassone et al. (2004) argue that many of these conditions have already been fulfilled in the EMU, but several remain problematic. This can be confirmed today: first, information necessary for evaluating the financial reliability of governments is available to the markets with delay (e.g. in 2010 Eurostat released a lot of important statistics from the first quarter of the year with a four months lag, i.e. in July). Furthermore, we have to remind that the data are not 100% reliable - for example in the case of Greece they have become doubtful when this country’s creativity in producing statistics was discovered and these had to be reviewed several years backwards.
Second, it is unsure whether the markets would be able to absorb the bankruptcy of a sovereign borrower. Blundell-Wignall & Slovnik (2010) showed that nearly 60% of the foreign-owned part of the Greek public debt was held by German and French banks and in case Greece defaulted on its obligations, the banking systems of these two countries may be significantly weakened because the Greek debt represented 12% and 6% of the banks’ Tier 1 capital, respectively.
Third, the borrowers’ response to market signals is uncertain but this is something that we can test for. Finally, the greatest problem seems to be the issue of ()bail-out and non-existence of external guarantee. Bail-out is prohibited in the EMU3 but the credibility of this ban has become more doubtful than ever, given the situation in Greece and Ireland and the loans that have been granted to them by other EU countries and the IMF, which is seen by many to be very close to a bail-out. This example would support the claim of Eijffinger & de Haan (2000) that fiscal rules in a monetary union are necessary.4
We have to bear all this in mind when drawing conclusions from our estimation results.
2.2
The
markets’
reaction
Researchers generally agree that government bond yield spreads are determined by several factors: default risk, exchange rate risk and liquidity premiums, and factors such as transaction costs and differences in tax treatment or different sensitivities to common shocks. To this Lemmen & Goodhart (1999) note that in a monetary union the default risk is higher as the countries cannot inflate their debts or devalue their currencies. However, as we could see after the inception of the EMU, higher probability of bail-out in a monetary union may go in the opposite direction as far as the default risk is concerned.
There are two main lines of research in the current literature that are connected with the issue of the reaction of the financial markets to the fiscal stance of governments. While the first one
3 It was already banned by the Maastricht Treaty.
4 However, recently we have seen discussions about the possible introduction of the ‘bail-in’ of creditors which
may be able to prevent investors from considering placing their money into the banks as risk free (expecting that governments will always bail the banks out). This would be done e.g. in the way that when a bank gets into financial problems its debt held by third parties would automatically be converted into common equity. See European Commission (2010).
6
investigates the effect of fiscal variables on the government bond yields, the second one tries to assess their effect on government bond yield spreads.
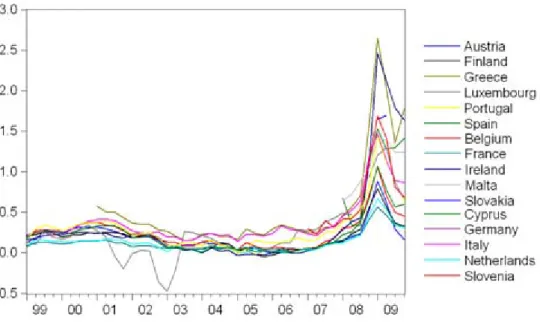
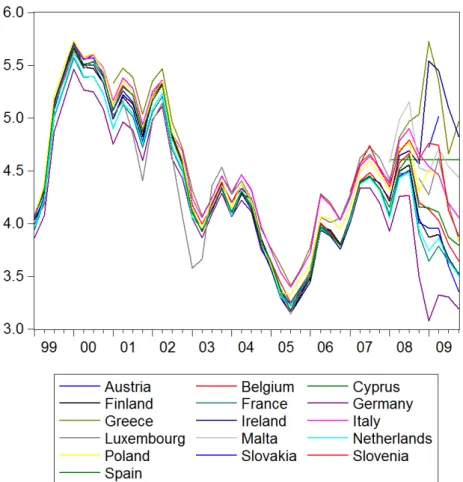
The first line of research is much less widespread than the second one. For this analysis the most relevant paper is that by Ardagna et al. (2004).5 These authors worked with a panel of 16 OECD countries and a time period of more than 40 years, using annual data. They did the estimation for two different periods, one using OLS estimation with country specific fixed effects and one using the GLS estimator. The effect of both the primary deficit as share on GDP and the gross public debt as share on GDP on the 10-year government bond yields was significant in most specifications and was estimated to be around 0.1 and 0.01, respectively. However, as Gale & Orszag (2002) note, the overall level of long-term bond yields is affected by many factors and not only the fiscal policy. It may therefore be better to investigate the bond yield spreads relative to another country if we want to trace the effect of fiscal policy on the markets’ pricing of the costs of borrowing. This was confirmed by the recent development of the government bond yields that is illustrated in Figure A1 in the Appendix. We can see that after an increase in the bond yields of all governments between 2005 and 2007, many government bonds yields started to decrease in 2008, but the spreads among them have increased and this is what we are interested in.
The literature aiming to explain the government bond yield spreads is very wide and usually Germany is used as the benchmark. It is generally accepted that the spreads in a monetary union are caused by differences in credit and liquidity risk premiums. Many researchers have also found that government bond spreads are driven by a common factor, usually referred to as international risk aversion. Manganelli & Wolswijk (2009) tried to find what drives this international risk aversion and they claimed that it was related to the level of short-term interest rates.6
Codogno et al. (2003) worked with monthly data for 10 EMU countries between 1995 and 2002. Because of the period chosen, the authors took into account the exchange rate risk components of the government bond yield spreads in the regression. They also included in their model two variables that should approximate risk premiums. These were both related to the US economy (spreads between interest rates on US swaps and the federal government bond yields and between the yields on AAA US corporate bonds and the federal government bond yields). The authors came to the conclusion that government bond spreads in the Eurozone are mainly driven by credit risk and international factors and not so much by liquidity factors.
Bernoth et al. (2006) used yield-at-issue data on spreads for 14 EU countries and the US federal government in the period from 1993 to 2005, taking into account only DM, then EUR issues and USD issues to avoid the influence of exchange rate risk on the yields. They used
5 Other papers are e.g. Laubach (2003), Pesani and Strauch (2003), Tavares and Valkanov (2001). 6 For a detailed description of how the interest rates affect the government bond spreads see Manganelli &
the 2SLS estimation technique adding both country- and time-specific fixed effects. The authors also included investors’ risk aversion into the regression. They proxied for it using the spread between BBB US corporate bond yields and the US government bond yields. The authors concluded that yield spreads do respond to government indebtedness but that after the start of the EMU the markets’ attention moved from government debts and deficits to debt service-to-GDP ratios.
Paesani et al. (2006) investigated the period between 1983 and 2003 for the USA, Germany and Italy, estimating a VAR model. They came to the conclusion that fiscal developments have influenced significantly the long-term interest rates.
Schuknecht et al. (2008) investigated the government bond risk premiums for the EMU and Canada using data on bond yield spreads at issue from 1999 to 2005. Then, in Schuknecht et al. (2010), they reviewed their previous findings for the EMU, extending the period until May 2009 and thus taking into account also the impact of the financial crisis. In both papers they estimated an OLS model with time fixed effects, including into the regression also two proxies for international risk aversion: the BBB US corporate bond yield spreads and also the short-term interest rates (3-month EURIBOR concretely). Their conclusion in 2008 was that yield spreads over an appropriate benchmark do respond to indicators of fiscal performance. In 2010 they added to this that the markets’ reaction to fiscal imbalances has become stronger after the fall of the Lehman Brothers. However, they did not account for the effect of the crisis itself (their crisis dummy was only included in the regression in interaction with other variables), which would very likely have an impact on their results.
Alexopoulou et al. (2009) used monthly data for 8 new EU member states from 2001 to 2009 and did the estimation using the pooled mean group technique.7 They also took into account the global financial conditions and proxied for them using the stock market volatility of the Dow Jones Eurostoxx 50 index. These authors’ conclusion was that for most of the countries government bond yield spreads responded significantly to fiscal fundamentals.
Haugh et al. (2009) estimated a simple panel model for 10 EMU countries over the period from December 2005 to June 2009, using quarterly data. These authors also included in their regression a proxy for risk in the form of spreads between high yield corporate bonds and government bonds. They concluded that differing fiscal policies have an important impact on government bond yield spreads. They, however, noted that this was not so evident in the pre-crisis times when the general risk aversion was very low.
2.3
The
governments’
reaction
Literature dealing with our second research question is rather limited. The only paper that we were able to find is the already mentioned work by Balassone et al. (2004). These authors test for different time periods (1981 – 2003, 1981 – 1991, 1992 – 1998 and 1999 – 2003) using the Arellano-Bond estimation technique how the governments change their structural primary
8
budget balance in response to a change in the market price of public borrowing and come to the conclusion that the governments tend to react with a delay to changing market conditions and that the spreads have a different impact on the fiscal behaviour of the state depending on the chosen time period (the effect being the strongest after the introduction of the EMU).
3
Data
and
method
3.1
The
markets’
reaction
To investigate the issue of the financial markets’ reaction we used quarterly data from 1999 until the end of 20098 for 16 EMU countries.
While many researchers work with data on bond yields at issue, we used data on (long-term) government bond yields provided by the IMF (International Financial Statistics), as the former were not available to us.9 The rest of our data comes from the Eurostat except for data on US spreads that are also taken from the IMF.
We decided that the beginning of the period investigated would be year 1999 when the euro was introduced. It was shown e.g. by Blanco (2001) that the influence of the exchange rate risk on the yield spreads in the pre-EMU era was very significant. This is illustrated by Figure 1 where we can see that after the elimination of national currencies the long-term government.
Figure 1 – Long-term government bond yield spreads of chosen EMU countries
in 1985 – 2009 (in %)
Source: IMF, International Financial Statistics.
8 Working also with data for the first quarter of 2010 would have been very interesting but they were not
available when the empirical part of this paper was written.
9
Note that in the International Financial Statistics database the IMF does not do a precise distinction between different maturities of government bonds. It explains that ‘Government Bond Yield refers to one or more series representing yields to maturity of government bonds or other bonds that would indicate longer term rates‘ – see
http://www.imfstatistics.org/imf/IFSIntRa.htm . ‐2,00 0,00 2,00 4,00 6,00 8,00 10,00 12,00 14,00 16,00 18,00 1985 1987 1989 1991 1993 1995 1997 1999 2001 2003 2005 2007 2009 Austria Belgium Finland France Germany Greece Ireland Italy Luxembourg Netherlands
bond yield spreads, i.e. the difference between the long-term government bond yields of a given country and of Germany, decreased to very low numbers. The exchange rate risk is therefore something that has to be taken into account. Some researchers, such as Codogno et al. (2003), have treated the exchange rate risk component of the yield spreads using data on swap contracts denominated in different currencies, but we do not have access to such data. As our estimation begins in 1999, we do not need to proxy for the exchange rate risk
Several countries from our sample, namelyGreece, Cyprus, Malta, Slovenia and Slovakia, did not join the EMU already in 1999. These countries were only comprised in the estimation from their entrance into the EMU onwards.
Looking at Figure 2, we can see that while until 2007 EMU long-term government bond yield spreads were very low, in 2008 they started to rise quite significantly. In the Appendix we included the spread figures for each country separately (Figure A2).
Figure 2 – Long-term government bond yield spreads of EMU countries in 1999 - 2009 (in %)
Source: IMF, International Financial Statistics.
As we have already mentioned, researchers generally agree that spreads are mainly influenced by the default risk, exchange rate risk and liquidity premiums, and factors such as transaction costs and differences in tax treatment or different sensitivities to common shocks. We assume that transaction costs and tax treatment are similar in the EMU and that exchange rate risk is not relevant any more. We therefore proxy for the default risk by using different fiscal indicators and we proxy for liquidity premiums and different sensitivities to shocks using other variables. Our regression is the following:
10
Our dependent variable, Spread, is the difference between a country’s long-term government bond yield and the German long-term government bond yield, both expressed in percentage points.
All our indicators of fiscal performance refer to the general government. The key fiscal indicators that we use in our estimation are the following: budget balance (or net lending) as share on GDP, expressed in percentage points, relative to Germany10 (NetLending) that is expected to have a negative effect on the dependent variable, gross public debt as share on GDP relative to Germany (GrossDebt) that is expressed in percentage points and is expected to have a positive effect on the dependent variable, and the share of interest payable on governmental revenues (Int/Rev) that is expressed in percent and is also expected to have a positive effect on the dependent variable.
To take into account the external position of the given countries, we also include in our estimation the current account as share on GDP (CA), expressed in percent.
Based on Bernoth et al. (2006) we use as proxy for liquidity of a government’s debt the share of this debt on the sum of debts of all EMU countries (DebtShare), expressed in percent.11 To proxy for international risk aversion we use two variables: the short-run interest rates in the EMU - 3-month EURIBOR (SR_IntRate) and the spread between the US bank prime loan rate and the US 10-year government bond yield (US_spread), as defined by the IMF.12 We also controlled for changes in GDP using the variable GDPgrowth, expressed in percent.
We use several time dummy variables. crisis has the value of 0 until the second quarter of 2008 and 1 from the fall of the Lehman Brothers on, i.e. from the third quarter of 2008 until the end of 2009, which is also the end of our dataset. To be also able to distinguish the period of the crisis from the preceding period of turmoil when we could already observe some signs of the upcoming crisis, we use the variable turmoil which has the value of 1 from the third quarter of 2007 to the second quarter of 2008 and 0 otherwise. To make sure that it is correct to suppose that it is important to differentiate between the period of turmoil and the crisis period, we also try to do our estimation with variable turmcris which does not take the difference into account, having the value of 1 from the third quarter of 2007 on and 0 otherwise.
10 I.e. the variables are expressed as difference from the German figures. This is because in our dependent
variable we also compare the countries’ yields to those of Germany that has historically been considered as a benchmark. To provide an example: a positive figure, such as 0.5, means that a country’s net lending as share on GDP is higher than Germany’s by 0.5 percentage points.
11 Some authors use data on bid-ask spreads to proxy for the liquidity risk, but such data were not available to us.
12 We wanted to follow previous research using the US corporate bond yields instead of the bank prime loan rate,
We also used dummy variable South for southern EMU states13 and dummy variable HighDebt for those EMU states whose gross public debt in the period under investigation was higher than 60% of their GDP on average.14
During our estimation we tried to include into the regression the squared terms of NetLending and GrossDebt and different interactions of the explanatory variables .15
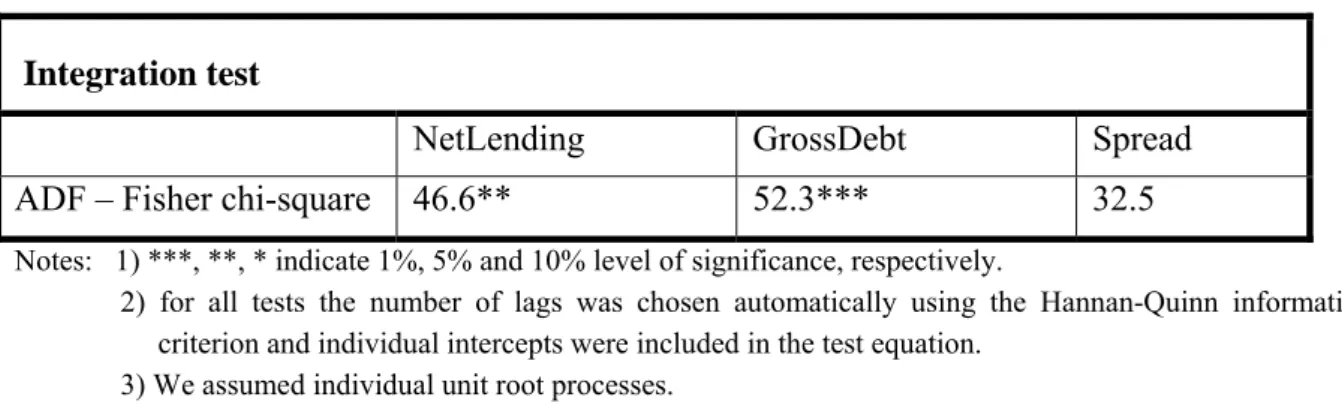
We also looked at the statistical properties of the key variables. We tested Spread, NetLending
and GrossDebt for stationarity. We examined these time series using the Fisher-ADF panel
unit root test. While for NetLending and GrossDebt we rejected the null hypothesis of unit root, in the case of Spread we could not reject this null hypothesis. The results are shown in the Appendix, Table A1. Looking back to Figure 2 where we can see a clear rise in the spreads, this is not surprising. However, we suppose that such result of the test is mainly due to the possible presence of a structural break in the data connected with the latest financial and economic crisis.
We therefore estimate an OLS model, checking whether the inclusion of the country-specific fixed effects is appropriate.
3.2
The
governments’
reaction
To investigate the issue of the governments’ reaction to the financial markets we used annual data from 1999 to 2009 for 16 EMU countries. We could not use quarterly data because the variable that we decided to use as dependent variable is only available on an annual basis. Data on government bond yield spreads were taken from the IMF (International Financial Statistics) and all other variables were taken from the AMECO database of the European Commission.
Based on Balassone et al. (2004) we estimate a regression showing how governments adjust their fiscal policies in reaction to rising spreads. However, we also try to capture the effect of the latest crisis on the governments’ behaviour.
Our regression is the following:
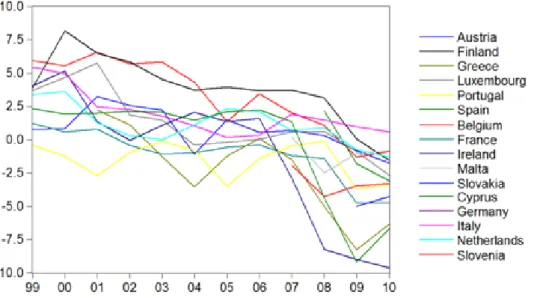
Our dependent variable which should capture the fiscal behaviour of governments is StrPrBal (the structural primary balance, defined by Eurostat as net lending excluding interest, cyclically adjusted based on trend GDP, expressed as share on GDP in percent. We use cyclically adjusted figures because these should reflect governments’ fiscal behaviour better
13 Namely Cyprus, Greece, Italy, Malta, Portugal, Spain.
14 Namely Austria, Belgium, France, Germany, Greece, Italy, Malta.
15 E.g. the interaction of crisis (or turmoil) and different fiscal or liquidity indicators; the interaction of country
dummies and different fiscal or liquidity indicators; the interaction of crisis and country dummies and different fiscal or liquidity indicators; the interaction of proxies for international risk aversion and different fiscal indicators.
12
than not adjusted figures, as the governments clearly cannot influence the economic cycle (or events such as the latest crisis which caused a great economic slowdown in most countries). The development of this variable in the period under investigation is shown in Figure 3. Our key explanatory variable is Spread, i.e. the difference between a country’s long-term government bond yield and the German long-term government bond yield which is expressed in percentage points and which shows how the markets value the given country’s government bonds. We expect that as Spread increases, the government starts reducing its borrowing to make the markets decrease the yields and thus lower its costs of borrowing.
As other factors that are likely to have an impact on a country’s structural primary balance we use the lagged value of the dependent variable because the speed at which governments can increase revenues or decrease expenses is rather limited and thus the structural primary balance usually does not change very quickly; the gross public debt as share on GDP (GrossDebt) that is expected to have a positive effect on the dependent variable (we assume that a higher stock of debt induces the government to start pursuing more responsible fiscal policies) and the current account as share on GDP (CA) that is expected to have a negative effect on the dependent variable (we expect that lower current account balance will make the government decrease its net lending). All these variables are expressed in percent.
We again include into the estimation the dummy variable HighDebt in interaction with other explanatory variables to see whether high debt countries are adjusting their fiscal policies in a different way than countries with low public debts.
Figure 3 – Structural primary balance of EMU countries in 1999 – 2010 (in % of GDP)
Source: IMF, International financial statistics.
We use several time dummy variables that theoretically should be the same as in the previous estimation where quarterly data were used. However, as this time we use annual data, we need to simplify these variables: turmoil thus has the value of 1 in 2007 and 0 otherwise; crisis has
the value of 1 in 2008 and 2009 and 0 otherwise; and turmcris has the value of 1 from 2007 on and 0 otherwise. In our estimation we try to include different interactions of the explanatory variables.
We also looked at the statistical properties of our key variables. We tested StrPrBal, Spread and GrossDebt for stationarity. We examined these time series using the Fisher-ADF panel unit root test. While for StrPrBal we rejected the null hypothesis of unit root, in the case of Spread and GrossDebt we could not reject this null hypothesis. The results are shown in the Appendix, Table A2. However, as we work with very short time series, we have to bear in mind that we cannot draw strong conclusions from the tests, also given that the end of our sample is strongly influenced by the crisis.
As we use the lagged value of the dependent variable as one of the explanatory variables which could give rise to autocorrelation, we apply the Arellano-Bond estimator (a dynamic panel data estimation technique, taking a partial adjustment based approach).16 This is also consistent with the approach of Balassone et al. (2004).
4
Estimation
results
4.1
The
markets’
reaction
Table 1 presents our estimation results. In all the models the coefficients have the expected signs.
We begin our estimation by the inclusion of NetLending and GrossDebt only in Model 1. We can see that the effect of both these variables on Spread is relatively high. However, the coefficient on NetLending diminishes by one half when we include also the turmoil and crisis dummies which can be seen in Model 2.17 By doing this we try to estimate how the spreads were affected by the recent crisis. When we add also other variables, mainly interactions of different variables with the crisis dummy, the coefficient on NetLending gets even closer to 0. This suggests that in normal times the markets do not price the government bonds based on the states’ deficits.
GrossDebt has a positive effect on Spread: when a country’s gross debt increases by 1 percentage point relative to Germany, the spread of this government’s bond yields relative to Germany increases by 0.009 - 0.01 percentage point, depending on the model. According to our estimation, the turmoil period had a significant effect on the spreads of government bond yields relative to Germany: in this period, spreads increased by 0.07 – 0.14 percentage points, depending on the model. Nevertheless, the effect of the crisis was even stronger: it caused an increase in spreads by at least 0.7 percentage points.
16
For more details on this method see Arellano & Bond (1991).
17 The inclusion of these two dummy variables proved to be better than the inclusion of only one of them or the
14
Table 1 – Estimation results 1
Dependent variable:
Spread Model 1 Model 2 Model 3 Model 4 Model 5
Const 0.3626 *** 0.2372 *** 0.2197 *** 0.0614 * 0.1956 *** NetLending -0.0285 *** -0.0102 ** -0.0045 *** -0.0029 -0.0036 ** GrossDebt 0.0109 * 0.0129 *** 0.0102 *** 0.0088 *** 0.0106 *** Turmoil 0.1373 *** 0.1365 *** 0.0668 * 0.1263 *** Crisis 0.7561 *** 0.7188 *** 0.7896 *** 0.7431 *** Crisis*NetLending -0.0329 *** -0.0349 *** -0.0334 *** Crisis*DebtShare -0.0205 *** -0.0225 *** -0.0205 *** Crisis*GDPgrowth -0.0178 *** -0.0171 *** -0.0175 *** South*crisis*GrossDebt 0.0129 *** 0.0134 *** 0.0129 *** SR_IntRate 0.0471 *** US_Spread 0.0153 *** Adjusted R2 0.4246 0.7828 0.8526 0.8651 0.8548 Akaike criterion 207.09 -239.05 -413.64 -453.36 -419.76 DW statistic 0.6876 0.9516 1.1996 1.3465 1.2187 Test statistic for common
intercept 6.9252 *** 19.4176 *** 20.3802 *** 20.1988 *** 21.1285 *** Test statistic for
normality of residuals 229.55 *** 229.36 *** 278.06 *** 343.85 *** 265.68 *** Number of observations 460 460 460 460 460 Note: 1) ***, **, * indicate 1%, 5% and 10% level of significance, respectively
2) standard errors are HAC robust
During the crisis, the importance of the height of the budget deficit increased significantly: an increase in NetLending by 1 percentage point resulted in a 0.03 percentage point decrease in Spread. Other two factors have also become important during the crisis: DebtShare, proxying for the liquidity premium, and GDPgrowth. In the time of crisis, the markets valued better bonds of countries with higher GDP growth (with a 1 percentage point increase in GDPgrowth, Spread decreased by nearly 0.02 percentage points) and also of those countries whose debt had a higher share on the whole euro-area debt (with a 1 percentage point increase
in DebtShare, Spread decreased by 0.02 percentage points). This would suggest that the
largest Eurozone economies, such as Germany or France, were perceived as relatively safer borrowers.
In the time of crisis the importance of GrossDebt increased especially for southern EMU members. For these a 1 percentage point increase in the gross debt relative to Germany meant an additional 0.01 percentage point increase in the bond yield spread. It thus seems that during the crisis the financial markets started to be sensitive to many more factors than in the previous times.
Based on previous research papers we also tried to proxy for international risk aversion. In Model 4 we used the short-term interest rate (SR_IntRate) and in Model 5 we used
US_Spread. Mostly the inclusion of these variables did not change much the coefficients of the other explanatory variables. This holds especially for Model 5 where the fit of the model increased only slightly. Nevertheless, in Model 4 the fit increased significantly, the biggest change in coefficients or their significance appearing in the case of NetLending and turmoil. It thus seems that the inclusion of the proxies for international risk aversion is relevant. An interesting finding is that in Model 4 the significance of turmoil has decreased with the inclusion of the proxy for international risk aversion. This would suggest that these two variables are somehow interconnected. The same cannot, however, be said about variable crisis.
Many variables that we expected to be important were not significant in our estimations. These were first, the squared terms of NetLending and GrossDebt. Second, the current account, CA, and the share of interest payable on the revenues, Int/Rev. These two variables were not significant even in interaction with crisis or South dummies. Third, variables such as DebtShare and GDPgrowth were not significant when included by themselves, but in interaction with the crisis dummy they turned out to be significant. Fourth, variable GrossDebt was not significant in interaction with crisis, but when these two were interacted also with the dummy variable South, the term was significant. Fifth, when we included interactions of different fiscal indicators with proxies for international risk aversion, these terms did not turn out to be significant.
Finally, the dummy variable HighDebt was not significant, neither in interaction with fiscal indicators, nor with fiscal indicators and the crisis dummy, which would suggest that the markets did not perceive high-debt countries disproportionately differently from the low-debt countries. However, this would probably be different if we could have included data for year 2010 as spreads of many high-debt countries (such as Greece, Portugal) have risen significantly.
For all the models we have checked that neither pooled OLS, nor a random-effects model would be more adequate than the fixed-effects model: the test statistic for common intercept is highly significant in all cases (see Table 1) and according to the Hausman test GLS estimators would not be consistent.
Comparing our results with the previous research we note that our coefficients are mostly lower. Taking e.g. Schuknecht et al. (2010), we can see that our coefficients both on NetLending and GrossDebt are significantly lower and the same holds for the interaction of these variables with the crisis dummy. We attribute this especially to the fact that we have included the turmoil and crisis dummy variables also separately into the regression, not only in interaction with other variables. It thus seems that due to this we estimated the reaction of the markets to fiscal developments both before and during the crisis to be significantly lower than in the above mentioned paper, which would weaken the conclusions of its authors.
16
As we can see in Table 1, in none of the models the residuals have a normal distribution. We show in Figure A3 in the Appendix that their main problem is probably too high kurtosis for having a normal distribution.
Our estimation suggests that financial markets do change their pricing of a government’s bonds when its fiscal stance deteriorates. While before the start of the crisis government bond spreads basically responded to the level of gross public debt only (the budget deficits affected the spreads only very slightly or not at all), when the crisis began the importance of the budget deficits increased. Furthermore, southern states started to be penalized by the markets for the size of their public debt more than other Eurozone countries. This is very likely due to the fact that these states are often perceived as having relatively worse fundamentals.
4.2
The
governments’
reaction
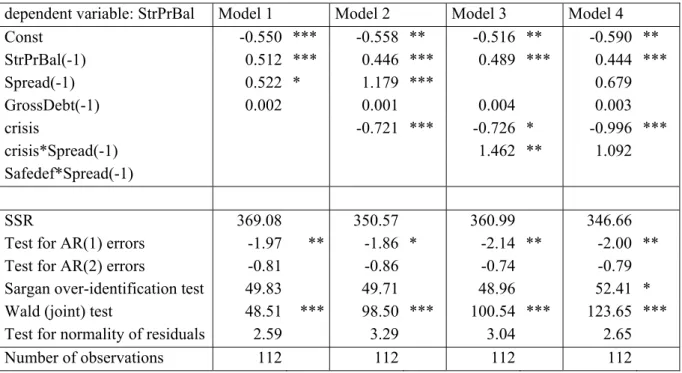
Table 2 presents our estimation results. Of the four models, Model 2 seems to be the most appropriate: it has the best statistical properties as at the 5% level of significance it is not over-identified and the errors are not AR(2). All coefficients have the expected sign. However, GrossDebt is not significant in any of the models.
Table 2 – Estimation results 2
dependent variable: StrPrBal Model 1 Model 2 Model 3 Model 4
Const -0.550 *** -0.558 ** -0.516 ** -0.590 ** StrPrBal(-1) 0.512 *** 0.446 *** 0.489 *** 0.444 *** Spread(-1) 0.522 * 1.179 *** 0.679 GrossDebt(-1) 0.002 0.001 0.004 0.003 crisis -0.721 *** -0.726 * -0.996 *** crisis*Spread(-1) 1.462 ** 1.092 Safedef*Spread(-1) SSR 369.08 350.57 360.99 346.66
Test for AR(1) errors -1.97 ** -1.86 * -2.14 ** -2.00 **
Test for AR(2) errors -0.81 -0.86 -0.74 -0.79
Sargan over-identification test 49.83 49.71 48.96 52.41 *
Wald (joint) test 48.51 *** 98.50 *** 100.54 *** 123.65 ***
Test for normality of residuals 2.59 3.29 3.04 2.65
Number of observations 112 112 112 112
Note: ***, **, * indicate 1%, 5% and 10% level of significance, respectively
We can see that StrPrBal is strongly influenced by its past value. Furthermore, in Model 1 we can see that with a 1 percentage point increase in Spread, StrPrBal increases by 0.5 percentage points but only at the 10% level of significance. This would suggest that the structural primary balance is strongly influenced by its height in the previous period but that it is independent of the financial markets’ signals.
In all the other models we also take into account the effect of the crisis: variable crisis has a significant negative effect on the dependent variable. This event caused a decrease in the structural primary balance relative to GDP by 0.7 – 1 percentage points. Model 2 suggests that governments react to the bond yield spreads even at the 1% level of significance: with a 1 percentage point increase in Spread, StrPrBal increases by 1.2 percentage points relative to GDP in the following period.
We included into Model 3 the interaction of crisis and Spread instead of Spread only. The effect of this term was greater than the effect of only Spread itself: during the crisis a 1 percentage point increase in Spread made the governments improve the structural primary budget balance by 1.5 percentage points relative to GDP in the following period. The coefficient was, however, slightly less significant. When in Model 4 both Spread and crisis*Spread were included in the estimation, they both turned out to be insignificant while the coefficient of crisis decreased to nearly -1.
However, when we tested the hypothesis that the coefficient on Spread was the same before and during the crisis, i.e. that coeff(Spread_1)=1.462 and coeff(crisis*Spread_1)=1.179, in neither of the two cases we could reject the null hypothesis that the reaction of governments to increasing costs of borrowing did not change after the start of the crisis. The result of this test is reported in the Appendix, Table A3.
When we included into our estimation an interaction of HighDebt and Spread, and also HighDebt and GrossDebt, they both turned out to be insignificant.
Comparing our estimation results with Balassone et al. (2004) for the period 1999 – 2003 in their paper, we note the following: in our Model 1, which is the closest one to theirs, the estimate of the effect of the past value of the dependent variable is slightly higher in our estimation (0.51 compared to 0.45) and the effect of Spread is slightly lower (0.52 compared to 0.67). Unlike Balassone et al. (2004) our effect of GrossDebt is not significant.
However, when we take into account the effect of the crisis, the impact on the past value of the dependent variable is very similar to theirs (also 0.45) and the effect of Spread very significantly increases (the coefficient rises to 1.18 compared to 0.67 in their estimation). As we only did our estimation for the period of time when the EMU was already in place, it is impossible for us to distinguish whether the governments improved the structural primary balance in response to the financial markets' signals or whether they did so because according to the SGP their deficits must not exceed 3% of GDP.
In this respect we may base our conclusions on the results of Balassone et al. (2004) who did their estimation for several time periods and in each of them they obtained different results: in the period 1992 – 1998 (which can be considered a time of a run up to EMU), the reaction of the structural primary balance to the spreads was significantly lower than for the period 1999 – 2003 when the SGP was already in place (0.16 compared to 0.67). This difference was even more significant for the period 1981 – 1991 (the coefficient on the spread was only 0.05)
18
when EU countries were not bound by any supra-national fiscal rule and the introduction of such rule was not even planned.
Our estimation suggests that governments do react to increasing costs of borrowing (or spreads). However, given that spreads were mostly quite low after the inception of the EMU (in terms of tenths of percentage points, or tens of basis points, before the start of the crisis as we could see in Figure 2), an increase by 0.5 percentage points is already very big – such a thing happened e.g. to Greece between 2007 and 2008 (during this time its budget deficit increased from below 4% to 7.8% of GDP, i.e. it nearly doubled) or to Italy between 2008 and 2009 (during this time its budget deficit increased from below 2.7% to 5.2% of GDP) – and this would only trigger, according to Models 2 and 5, a 0.5 - 0.6 percentage point improvement in the structural primary balance in the following period. Given that such big increase in spreads only happened when budget deficits increased a lot, such governments’ reaction may simply not be sufficient to maintain fiscal discipline.
Therefore it seems that even if the SGP very likely contributed to a more responsible fiscal behaviour of the governments, it was not powerful enough and did not keep Eurozone countries from having excessive deficits. This can be documented by the fact that most countries whose spreads increased significantly in 2008 often corrected their deficits only slightly in 2009 and continued breaching the Pact.
5
Conclusion
The aim of this paper is to answer the question whether in the case of a monetary union the financial markets have a sufficiently disciplining effect on the governments’ fiscal behaviour and whether thus fiscal rules are redundant. To do this we needed to investigate three issues: the institutional setup and market conditions in the EMU, the reaction of the markets to changing fiscal stances of governments and the reaction of governments to a change in the markets’ pricing of their bonds.
Our results suggest that the markets do react to fiscal indicators but that this reaction was much weaker before the start of the latest financial and economic crisis than at the end of 2008 and in 2009. Before the crisis, government bond spreads reacted mainly to the gross public debt. However, the crisis has brought, apart an overall increase in the level of spreads, a reaction of the financial markets to budget deficits and, in the case of southern EMU states, an even stronger reaction to the height of the gross public debt. We expect that if 2010 data were included to the estimation, both these effects would probably become even stronger. Concerning the governments’ reaction to the change in financial markets’ pricing of their bonds, our results suggest that the governments do react to increasing spreads of their bond yields relative to Germany by improving their structural primary budget balance but that the reaction is not very strong and we assume that before the introduction of the EMU it was even
weaker. Also, we have found that this reaction was not affected significantly by the latest crisis.
Our conclusion could thus be that the financial markets could potentially have a disciplining effect on the governments. This is, however, spoiled by the rather weak reaction of the governments to changing market conditions. Furthermore, reminding the importance of the institutional setup and market conditions in the EMU, we have to note that there are many obstacles to the effectiveness of this setting. First, official data on government finance are released with a significant delay. Second, although bail-out is prohibited by the Treaty, these days we may suppose that the reaction both of the financial markets and of the governments is biased because of the behaviour of the EMU towards its members that got in financial troubles: the loans granted to Greece and Ireland are considered by many to be very close to a bail-out.
We are aware of the fact that the Stability and Growth Pact has not been powerful enough to keep the states fiscally disciplined even before the crisis, but we suppose that without this set of fiscal rules the member states’ situation would probably be even worse. Given all the problems mentioned above our conclusion therefore is that the Stability and Growth Pact cannot be effectively substituted by the financial markets and the EMU thus needs to have fiscal rules, probably even stricter than the SGP itself.
20
APPENDIX
22
Figure A3 – Test for normality of residuals
Model 1 Model 2
Table A1 – Panel integration and cointegration tests
Integration test
NetLending GrossDebt Spread
ADF – Fisher chi-square 46.6** 52.3*** 32.5
Notes: 1) ***, **, * indicate 1%, 5% and 10% level of significance, respectively.
2) for all tests the number of lags was chosen automatically using the Hannan-Quinn information criterion and individual intercepts were included in the test equation.
3) We assumed individual unit root processes.
Table A2 - Panel integration test
Integration test
StrPrBal Spread GrossDebt
ADF – Fisher chi-square 40.8** 20.2 18.3
Notes: 1) ***, **, * indicate 1%, 5% and 10% level of significance, respectively.
2) for the test the number of lags was chosen automatically using the Hannan-Quinn information criterion and individual intercepts were included in the test equation.
3) We assumed individual unit root processes.
Table A3 – Hypothesis testing
Null hypothesis Test statistic P-value coeff[spread_1] = 1.462 1.57304 0.2098 coeff[crisis*spread_1] = 1.179 0.233236 0.6291
24
REFERENCES
Alexopoulou, I.; Bunda, I. & Ferrando, A. (2009). 'Determinants of Government Bond Spreads in New EU Countries', ECB working paper no. 1093.
Ardagna, S.; Caselli, F. & Lane, T. (2004). 'Fiscal Discipline and the Cost of Public Debt Service - Some Estimates for OECD Countries', ECB working paper no. 411.
Ardy, B.; Begg, I.; Hodson, D.; Maher, I. & Mayes, D. G. (2006). 'Adjusting to EMU', Palgrave Macmillan, New York.
Arellano, M. & Bond, S. (1991). 'Some tests of specification for panel data', The Review of Economic Studies, vol. 58, no. 2, pp. 277-297.
Balassone, F.; Franco, D. & Giordano, R. (2004). 'Market-induced fiscal discipline: Is there a fall-back solution for rule failure?', Banca d'Italia - conference research paper, pp. 389-426. Beetsma, R.; Debrun, X. & Klaassen, F. (2001). 'Is fiscal policy coordination in EMU desirable?', Swedish Economic Policy Review vol. 8, pp. 57-98.
Bernoth, K.; von Hagen, J. & Schuknecht, L. (2006). 'Sovereign Risk Premiums in the
European Government Bond Market', Discussion Papers 151, SFB/TR 15 Governance and the Efficiency of Economic Systems, Free University of Berlin, Humboldt University of Berlin, University of Bonn, University of Mannheim, University of Munich.
Blanco, R. (2001). 'The Euro-Area Government Securities Markets. Recent Developments and Implications for Market Functioning', Paper prepared for the BIS Autumn Central Bank Economist's Meeting, Banco de Espaňa.
Blundell-Wignall, A. & P. Slovik (2010). 'The EU Stress Test and Sovereign Debt Exposures', OECD Working Papers on Finance, Insurance and Private Pensions, no. 4, OECD Financial Affairs Division.
Buiter, W. H. (2006). 'The 'Sense and Nonsense of Maastricht' Revisited: What Have We Learnt about Stabilization in EMU?', Journal of Common Market Studies vol. 44 (4), pp. 687-710.
Catenaro, M. & Morris, R. (2008). 'Fiscal policy and implementation in EMU', in Farina, F. & Tamborini, R., ed. Macroeconomic Policy in the European Monetary Union. Routledge, New York. pp. 19-44.
Codogno, L.; Favero, C. & Missale, A. (2003). 'Yield Spreads on EMU Government Bonds', Economic Policy, CEPR, CES, MSH vol. 18(37), pp. 503-532.
Eijffinger, S. C. W. & de Haan, J. (2000). 'European monetary and fiscal policy', Oxford University Press.
European Commission (2010). Memo/10/506 (20 October 2010) – An EU framework for Crisis Management in the Financial Sector – Frequently Asked Questions.
Feldstein, M. (2005). 'The euro and the stability pact', NBER working paper no. 11249. Fitoussi, J.-P. & Saraceno, F. (2007). 'Fiscal discipline as a social norm: The European stability pact', Documents de Travail de l'OFCE 2007-22, Observatoire Francais des Conjonctures Economiques (OFCE).
Gale, W. G. & Orszag, P. R. (2002). 'The Economic Effects of Long-Term Fiscal Discipline', Urban-Brookings Tax Policy Center Discussion Paper.
Haugh, D.; Ollivaud, P. & Turner, D. (2009). 'What Drives Sovereign Risk Premiums? - an Analysis of Recent Evidence from the Euro Area', OECD Economics Department Working Paper no. 718.
Hedbavny, P.; Schneider, O. & Zápal, J. (2004). 'Does the Enlarged European Union Need a Better Fiscal Pact? ', UK FSV – IES Working Paper no. 55.
Kopits, G. (2001). 'Fiscal rules: Useful policy framework or unnecessary ornament?', IFM working paper no. 01/145.
Lemmen, J. J. & Goodhart, C. A. (1999). 'Credit Risks and European Government Bond Markets: A Panel Data Econometric Analysis', Eastern Economic Journal vol. 25 (1), pp. 77-107.
Lindbeck, A. & Niepelt, D. (2006). 'The Stability Pact - Rationales, problems, alternatives', KYKLOS 59, no. 4, pp. 579-600.
Manganelli, S. & Wolswijk, G. (2009). 'What Drives Spreads in the Euro Area Government Bond Market?', Economic Policy, CEPR, CES, MSH vol. 24, pp. 191-240.
Paesani, P.; Strauch, R. & Kremer, M. (2006). 'Public Debt and Long-term Interest Rates - The Case of Germany, Italy and the USA', ECB working paper no. 656.
Schneider, O. & Hedbavny, P. (2003). 'Fiscal Policy: Too Political', UK FSV – IES Working Paper no. 37.
Schuknecht, L.; von Hagen, J. & Wolswijk, G. (2010). 'Government Bond Risk Premiums in the EU Revisited - The Impact of the Financial Crisis', ECB working paper no. 1152.
Schuknecht, L.; von Hagen, J. & Wolswijk, G. (2008). 'Government Risk Premiums in the Bond Market - EMU and CAnada', ECB working paper no. 879.
Stark, J. (2001). 'Genesis of a Pact' in Brunila, A.; Buti, M. & Franco, D., ed. The Stability and Growth Pact. Palgrave, New York, pp. 77-105.
Woods, R. (2008). 'Notes on the reformed SGP: creating and implementing effective
macroeconomic frameworks' in Talani, L. S. & Casey, B., ed. Between growth and stability - The demise and reform of the European Union's Stability and Growth Pact. Edward Elgar Publishing Limited, Massachusetts, pp. 129-169.
Wyplosz, C. (2006). 'European Monetary Union - The dark sides of a major success', Economic Policy April 2006, pp. 207-261.
26
LEGISLATION
'Treaty on European Union', Official Journal C 191, 29 July 1992.
'Treaty of Lisbon amending the Treaty on European Union and the Treaty establishing the European Community', Official Journal C 306 of 17 December 2007.
ABBREVIATIONS
2SLS – Two-Stage Least Squares
AR(1), AR(2) – Autoregression of order 1 and 2, respectively DM – Deutsche Mark
ECB – European Central Bank
EMU – European Economic and Monetary Union EU – European Union
EUR – euro FE – Fixed Effects
GDP – Gross Domestic Product GLS – Generalized Least Squares IMF – International Monetary Fund
OECD – Organization for Economic Co-operation and Development OLS – Ordinary Least Squares
SGP – Stability and Growth Pact TEU – Treaty on the European Union US, USA – United States of America USD – US Dollar
VAR – Vector Autoregression
IES Working Paper Series
2010
1. Petra Benešová, Petr Teplý : Main Flaws of The Collateralized Debt Obligation’s Valuation Before And During The 2008/2009 Global Turmoil
2. Jiří Witzany, Michal Rychnovský, Pavel Charamza : Survival Analysis in LGD Modeling 3. Ladislav Kristoufek : Long-range dependence in returns and volatility of Central European
Stock Indices
4. Jozef Barunik, Lukas Vacha, Miloslav Vosvrda : Tail Behavior of the Central European Stock Markets during the Financial Crisis
5. Onřej Lopušník : Různá pojetí endogenity peněz v postkeynesovské ekonomii: Reinterpretace do obecnější teorie
6. Jozef Barunik, Lukas Vacha : Monte Carlo-Based Tail Exponent Estimator 7. Karel Báťa : Equity Home Bias in the Czech Republic
8. Petra Kolouchová : Cost of Equity Estimation Techniques Used by Valuation Experts 9. Michael Princ : Relationship between Czech and European developed stock markets: DCC
MVGARCH analysis
10.Juraj Kopecsni : Improving Service Performance in Banking using Quality Adjusted Data Envelopment Analysis
11.Jana Chvalkovská, Jiří Skuhrovec : Measuring transparency in public spending: Case of Czech Public e-Procurement Information System
12.Adam Geršl, Jakub Seidler : Conservative Stress Testing: The Role of Regular Verification 13.Zuzana Iršová : Bank Efficiency in Transitional Countries: Sensitivity to Stochastic
Frontier Design
14.Adam Geršl, Petr Jakubík : Adverse Feedback Loop in the Bank-Based Financial Systems 15.Adam Geršl, Jan Zápal : Economic Volatility and Institutional Reforms in Macroeconomic
16.Tomáš Havránek, Zuzana Iršová : Which Foreigners Are Worth Wooing? A Meta-Analysis of Vertical Spillovers from FDI
17.Jakub Seidler, Boril Šopov : Yield Curve Dynamics: Regional Common Factor Model 18.Pavel Vacek : Productivity Gains From Exporting: Do Export Destinations Matter?
19.Pavel Vacek : Panel Data Evidence on Productivity Spillovers from Foreign Direct Investment: Firm-Level Measures of Backward and Forward Linkages
20.Štefan Lyócsa, Svatopluk Svoboda, Tomáš Výrost : Industry Concentration Dynamics and Structural Changes: The Case of Aerospace & Defence
21.Kristýna Ivanková : Isobars and the Efficient Market Hypothesis
22.Adam Geršl, Petr Jakubík : Relationship Lending, Firms’ Behaviour and Credit Risk: Evidence from the Czech Republic
23.Petr Gapko, Martin Šmíd : Modeling a Distribution of Mortgage Credit Losses
24.Jesús Crespo Cuaresma, Adam Geršl, Tomáš Slačík : Global Financial Crisis and the Puzzling Exchange Rate Path in CEE Countries
25.Kateřian Pavloková : Solidarita mezi generacemi v systémech veřejného zdravotnictví v Evropě
26.Jaromír Baxa, Roman Horváth, Bořek Vašíček : How Does Monetary Policy Change? Evidence on Inflation Targeting Countries
27.Radovan Parrák, Jakub Seidler : Mean-Variance & Mean-VaR Portfolio Selection: A Simulation Based Comparison in the Czech Crisis Environment
28.Vladimír Benáček : Aspekty efektivnosti při volbě profese a školy: Přizpůsobují se pražské střední školy potřebám podniků?
29.Kamila Fialová : Labor Institutions and their Impact on Shadow Economies in Europe 30.Terezie Výprachtická : Could the Stability and Growth Pact Be Substituted by the
Financial Markets?
All papers can be downloaded at: http://ies.fsv.cuni.cz
Univerzita Karlova v Praze, Fakulta sociálních věd Institut ekonomických studií [UK FSV – IES] Praha 1, Opletalova 26