Full Terms & Conditions of access and use can be found at https://tandfonline.com/action/journalInformation?journalCode=tejr20
European Journal of Remote Sensing
ISSN: (Print) 2279-7254 (Online) Journal homepage: https://tandfonline.com/loi/tejr20
Size distributions of slums across the globe using
different data and classification methods
John Friesen, Hannes Taubenböck, Michael Wurm & Peter F. Pelz
To cite this article: John Friesen, Hannes Taubenböck, Michael Wurm & Peter F. Pelz (2019): Size distributions of slums across the globe using different data and classification methods, European Journal of Remote Sensing, DOI: 10.1080/22797254.2019.1579617
To link to this article: https://doi.org/10.1080/22797254.2019.1579617
© 2019 The Author(s). Published by Informa UK Limited, trading as Taylor & Francis Group.
Published online: 01 Mar 2019.
Submit your article to this journal
Article views: 188
Size distributions of slums across the globe using different data and
classification methods
John Friesen a, Hannes Taubenböck b, Michael Wurm band Peter F. Pelza
aChair of Fluid Systems, Technische Universität Darmstadt, Darmstadt, Germany;bEarth Observation Center, German Aerospace Center, Oberpfaffenhofen, Germany
ABSTRACT
More than 900 million people worldwide live in slums. These slums mainly can be found in cities of the global south and are characterized by poor living conditions and usually insufficient access to basic infrastructure such as water or energy. In order to improve the living conditions of slum inhabitants, information about the number, location and size of the slums is required to plan supply infrastructure. We therefore identify morphological slums in eight different cities in Africa, South America and Asia, using remote sensing data and analyse their size distributions. We show that 84.6% of all observed morphological slums have a size between 0.001 and 0.1 km2. These results rely on a consistent approach using a clear ontology and conceptual frame for classification. However, classification methods for these underserved areas differ. We show slum classifications based on different methods reveal a strong dependency between the particular method and the resulting size distribution. The study shows the relevance of remote sensing for the investigation of slums and the results can be used for infrastructure planning, as infrastructure improvement projects are often limited to the large known slums. Whereas, the large number of small slums distributed across the city is often neglected.
ARTICLE HISTORY Received 19 July 2018 Revised 19 December 2018 Accepted 4 February 2019 KEYWORDS
Slums; morphological slums; informal settlements; size distributions; remote sensing
Introduction
More than half of the world’s population lives in cities (United Nations, 2016). According to several studies, the urban population is expected to con-tinue to grow rapidly over the next few years, especially in Asia and Africa (Kraas & Schlacke,
2016; United Nations, 2016). Connected with the strong urban growth in these regions of the world is the emergence of slums or informal settlements. It is estimated that about 25–50% of the world’s urban population lives in slums and that the abso-lute number of slum dwellers will increase in the next years up to 2 billion (Kraas & Schlacke, 2016). The United Nations defines slums as areas with high population density, poor infrastructure and bad living conditions (Habitat, United Nations,2016). According to several studies, these living conditions have a signifi-cant negative impact on both the physical (Ezeh et al.,
2017) and mental health (Subbaraman et al.,2014) of their inhabitants and therefore, it is important to improve the water supply and sanitation infrastructure in slums (Lilford et al., 2017; Van der Bruggen, Borghgraef, & Vinckier,2010). In their global sustain-able development goals, the United Nations are there-fore striving to improve the supply infrastructure in these settlements (United Nations,2015).
In order to be able to plan or provide holistic supply strategies in terms of water, energy, sanitation and others for these settlements (Friesen, Rausch, & Pelz, 2017; Rausch, Friesen, Altherr, Meck, & Pelz,
2018), it is necessary to obtain information on the number, location, size and size distribution of the respective slums.
In the literature, there are numerous studies on the description and analysis of slums, their morphology, size and structure. Detailed summaries and systema-tic reviews can be found in the works of Mahabir, Croitoru, Crooks, Agouris, & Stefanidis (2018) and Mahabir, Crooks, Croitoru, & Agouris (2016). In recent years, the analysis of slums using remote sen-sing data has increased, mainly due to the now avail-able high-resolution data. A detailed review of recent studies about slum mapping using remote sensing data can be found in the work by Kuffer, Pfeffer, & Sliuzas (2016).
Taubenböck and Kraff (2014) empirically show that morphological slums can be distinguished from formal structures in cities. In a further study, Wurm and Taubenböck (2018) prove that a physical approach on morphological slum struc-tures allows to locate the social group of urban poor to a certain degree. They also analyse the diversity in morphology of these settlements all
CONTACT Peter F. Pelz [email protected] Chair of Fluid Systems, Technische Universität Darmstadt, Otto-Berndt-Str. 2, Darmstadt 64287, Germany
https://doi.org/10.1080/22797254.2019.1579617
© 2019 The Author(s). Published by Informa UK Limited, trading as Taylor & Francis Group.
This is an Open Access article distributed under the terms of the Creative Commons Attribution License (http://creativecommons.org/licenses/by/4.0/), which permits unrestricted use, distribution, and reproduction in any medium, provided the original work is properly cited.
over the world and calling them arrival cities, since often these settlements are the place where immigrants arrive (Taubenböck, Kraff, & Wurm,
2018).
In addition to these works, however, the question of similarities between the different slum systems in different parts of the world arises. A previous study by the authors showed that slums in different metro-politan regions of the world have a similar size (Friesen, Taubenböck, Wurm, & Pelz, 2018). They investigated morphological slums in four different cities around the world using remote-sensing data.
The morphological slums were, according to
Taubenböck and Kraff (2014), distinguished from other settlement areas on their building structure and morphology. The study shows that the geometric mean of slums in different cities varies between
0.0085 km2 (Manila) and 0.0198 km2 (Rio de
Janeiro) and have an average size of 0.016 km2 for all considered cities.
Since the used database in the paper of Friesen et al. (2018) is small (four cities), we extend the previous study by four additional cities. Furthermore, the size distributions are examined in more detail in order to identify similarities and differences between the cities. Beyond, we also investigate in three cases the influ-ence of different classification methods onto the resulting size distributions.
The structure of this paper is as follows: First, we briefly introduce the different datasets used for the investigation and the metrics used for analysis and comparison. In thesecond step, we present the results.
Finally, we discuss and summarize the results and give a short outlook for further research.
Materials and methods
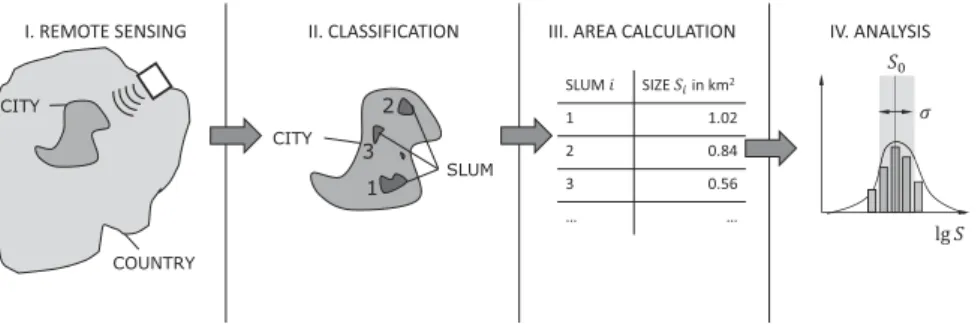
The general workflow of our approach relies on the study by Friesen et al. (2018). The main steps are as follows: we use optical high-resolution remote sen-sing data (i), locate slum areas within the city (ii), calculate the sizes of the slums (iii) and analyse their size distributions (iv). The workflow is shown in the followingFigure 1.
Datasets
The data used in this paper come from different sources. We investigate slums in the Metropole regions of Cairo (Egypt), Cape Town (South Africa), Manila (Philippines), Mumbai (India), Dhaka (Bangladesh), Caracas (Venezuela), Rio de Janeiro and Sao Paulo (Brazil). The cities listed are all located in the Global South and have different politically, culturally, econom-ically, topographically backgrounds. They all also have a very large population of several million inhabitants: Dhaka has 14.4 million (2015), Mumbai 12.4 million (2011), Manila 12.9 million (2015), Caracas 4.1 million (2017), Rio de Janeiro 7.5 million (2015), Sao Paulo 12.1 million (2017), Cape Town 3.7 million (2011) and Cairo 18.3 million (2017) according to the latest available census data.
For all cities listed, we used one consistent classi-fication method, based on physical parameters of the observed settlements, using very high-resolution optical satellite data. The classification relies on the ontology introduced by Kohli, Sliuzas, Kerle, and Stein (2012) and the empirical classification for morphologic slums shown by Taubenböck et al. (2018). For the mapping approach, visual interpre-tation of the high-resolution basemap images included in ESRi ArcMap was performed. Slums were characterized as such based on physical para-meters such as the organic pattern, high densities or small building sizes of the settlements. As a compar-able spatial entity, the mapping relied on the spatial level of the city block, focusing on the derivation of homogenous patches of similar building structure with adjacent homogenous patches forming the spa-tial entity of a slum which are usually circumscribed by significant street networks or natural boundaries (Wurm & Taubenböck, 2018). For separating indi-vidual slum patches, a minimum distance of 10 m was defined. This framework is applied onto all mentioned cities.
However, we also investigate the influence of different classification methods onto the resulting size distributions. For Cairo, we investigate, next to our consistent approach identifying morphologic slums, different classification methods, using the
Figure 1.Workflow of our study: we analyse the size distribution of morphological slum detected by remote sensing. The Figure is adapted based on Friesen et al. (2018).
information from Sims, Sejoume, & El Shorbagi (2003). They divide the informal settlements in Cairo into different slum types with different prop-erties (A, B, C).
The typology of slum type A “is defined as private residential building constructed on agricultural land purchased from farmers in areas where there were no subdivision plans and where building permits were not given”. The second typology B “is defined as private residential buildings constructed on vacant state land by citizens’ under the process of ‘hand claim’”. The third typology C represents “neighbourhoods with a high percentage of old, crowded, and deteriorated structures within the medieval urban fabric”.
The division in these different types is necessary, since the morphology of the slums in Cairo usually deviates very strongly from the other areas in other cities known to us. While on the one hand, slums of type A actually have the structure of formal develop-ment and are only classified as slums, because they were built illegally, slums of type C on the other hand consist of simply dilapidated, historic buildings in the city centre (Kraas & Schlacke,2016; Sims et al.,2003). In this paper, our analysis will primarily focus on type B “Informal Areas on Former Desert State Land”, as this type corresponds best with the mor-phologic classification mentioned above.
We also investigate a dataset of Sao Paulo with data collected by the Brazilian Institute of geography and statistics (IBGE) in the Census 2010. The Brazilian census classified the slums (favelas) as subnormal agglomerations or Aglomerados subnormais, when they have at least 51 shacks or houses and fulfil other criteria like:“non-standard urbanization–reflected by narrow, irregularly aligned roads, unevenly sized plots and shapes, and unregulated constructions by public agencies”. Details of the data collection are summar-ized by Demográfico (2010).
The last comparison is the comparison of our dataset of Dhaka with the slum classification from Gruebner et al. (2014), who mapped the slums of Dhaka for the years 2006 and 2010, by visual inter-pretation of Quickbird satellite imagery. Detailed information about the data collecting can be found in the work by Gruebner et al. (2014).
The only pre-processing step performed with all datasets is a merging of slums with touched bound-aries. All datasets used are summarized inTable 1.
Methods and metrics for comparison of slum sizes
In order to be able to compare the slums in the before mentioned cities, we use different methods and metrics. Since we want to identify the dominant size of the different urban systems, we calculate the geo-metric mean S0 ¼ ffiffiffiffiffiffiffiffiffiffiffiffiffiffiffiffi YN i¼1Si N r (1) with the ground areaSi of slumi and the number of slums N within a city. Connected with this value is the logarithmic standard deviation
σ¼ ffiffiffiffiffiffiffiffiffiffiffiffiffiffiffiffiffiffiffiffiffiffiffiffiffiffiffiffiffiffiffiffiffiffiffiffi 1 N XN i¼1log 2S i=S0 r ; (2)
to determine how much the different slum sizes within a city deviate from the geometric mean S0
calculated above. Beside the area, we calculate the typical length of slum systems as a metric for the planning of infrastructures l0 ¼ ffiffiffiffiffi S0 p (3) Finally, we analyse the size distribution of the differ-ent cities in particular. Therefore, we divide the whole distribution in five size sectors I–V. Size sector I covers all NI slums SI;k with an area 0.0001
km-2 < S
I < 0.001 km2, size sector II allNII slums with
an area 0.001 km2< SII < 0.01 km2 and so on. The
different sectors are shown inFigure 2.
We work on a logarithmic scale, because the sizes of the different morphological slum cover a wide range of magnitudes. While the smallest detected morphological slum for example in Caracas has a ground area of just 0.001 km2, the largest slum has an area of 3 km2.
For each of the before mentioned five sectors, we calculate the relative area of slums in relation to the total areaASlum;Total¼
PN i¼1Si of slums within a city aI¼ PNI k¼1SI;k ASlum;Total (4)
For explanatory purposes, we show the definitions for sector I only, but of course, they also apply to all other sectors. We also calculate the relative number of slums
bI¼ NI
N (5)
with the number NI of slums in sector I and N the
number of slums within a city. We do so to identify the dominant magnitude in slum sizes. A last metric is the size relation between larger and smaller slums
c¼ aIVþaV aIþaIIþaIII
(6) Thus, the total area of all slums larger than 0.1 km2 (sectors IV and V) is compared with the total area of all slums smaller than 0.1 km2(sectors I–III). In this context, we define the threshold at 0.1 km2. This value can of course also be shifted, which would lead to a change in the results.
Finally, we use images from Google Earth and the connected timeline for demonstration purposes to compare the classifications.
Results
After describing the size distributions of morphological slums in the different cities in general, we compare the size distributions of different classification methods for the cities of Dhaka, Sao Paulo and Cairo in particular.
Size distribution of cities
InFigure 3, the geometric mean of the different cities is plotted over the number of classified slums within the respective city. The number of observed morpho-logical slums per city differs between 41 for Cairo and 2125 for Dhaka. The size of the slum area in a city does not seem to correlate with the number of slums, as the slum areas of Sao Paulo and Caracas are similar, while the number of slums detected differ
greatly. On the other hand, Dhaka and Cape Town both have relatively small slum areas, while also in this case the number of slums differs greatly.
The geometric mean ranges between 0.0572 km2 for Cairo and 0.0021 km2for Dhaka. Connected with the geometric means are the typical lengths of the respective slum systems. Their values vary between 239.2 m for Cairo and 45.8 m for Dhaka by almost one order of magnitude.
Table 2 shows the results for size distributions of slums in the different investigated cities.
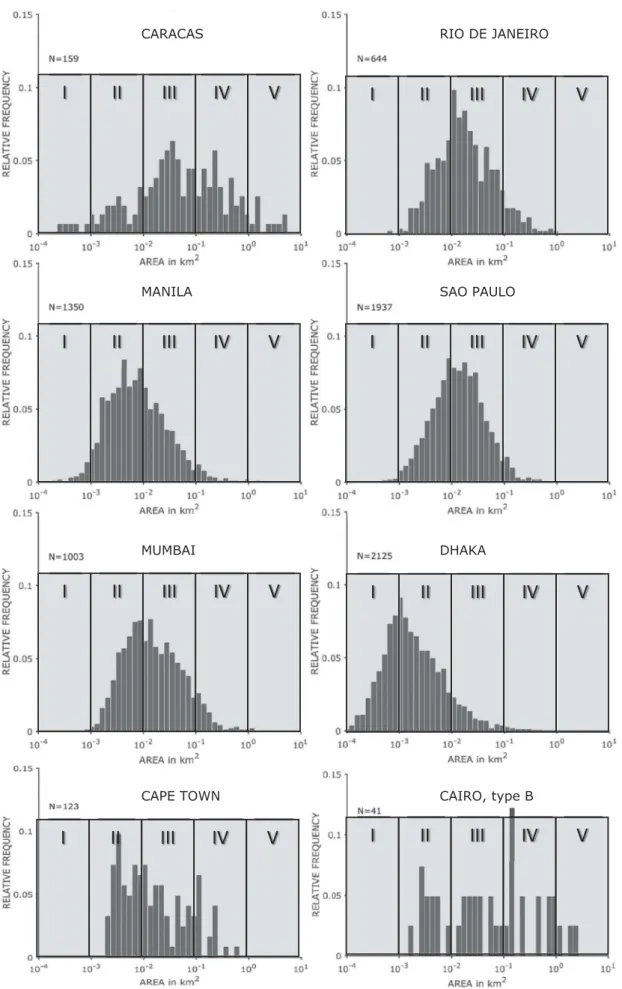
An analysis of the different size sectors shows the following picture: In Sao Paulo, Rio de Janeiro, Mumbai, Manila more than 90% and in Cape Town more than 80% of all slums have a size between 0.001 and 0.1 km2 (sectors II and III) and similar size distributions (Figure 4). Besides that, the size distri-butions in Cairo, Caracas and Dhaka are different.
In Dhaka, the share of small slum units is much higher than in the other cities. Nearly 90% of all detected morphological slums are smaller than 0.01 km2(sectors I–III). By contrast, in Cairo a large proportion (41.5%) of the morphological slums are larger than 0.1 km2(sectors IV and V), which corre-sponds to an area share of more than 95%.
Caracas is a special case. Although the number of slums is relatively evenly distributed over the differ-ent orders of magnitude, the majority of the area with 62.8% is concentrated in the large slums with an area larger than 1 km2.
Analysing the area share of slums, the majority of slum areas lies in size sectors III and IV. It is also interesting that the relative number of slums in a parti-cular size sector within a continent is similar. In all three South American cities surveyed, the size sector III has the largest share of slums. In Asian cities, this trend is shifting towards smaller slum sizes.
This is different in African cities included in this study. While the relative number of detected
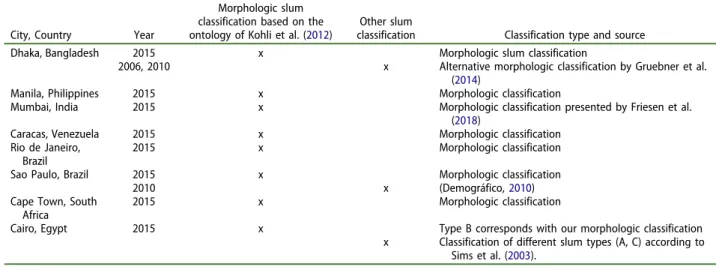
Table 1.List of investigated cities, year of data collection and source of data. Unless otherwise stated, the same morphologic classification as by Friesen et al. (2018) is used.
City, Country Year
Morphologic slum classification based on the ontology of Kohli et al. (2012)
Other slum
classification Classification type and source Dhaka, Bangladesh 2015 x Morphologic slum classification
2006, 2010 x Alternative morphologic classification by Gruebner et al. (2014)
Manila, Philippines 2015 x Morphologic classification
Mumbai, India 2015 x Morphologic classification presented by Friesen et al. (2018)
Caracas, Venezuela 2015 x Morphologic classification Rio de Janeiro,
Brazil
2015 x Morphologic classification
Sao Paulo, Brazil 2015 x Morphologic classification
2010 x (Demográfico,2010)
Cape Town, South Africa
2015 x Morphologic classification
Cairo, Egypt 2015 x Type B corresponds with our morphologic classification x Classification of different slum types (A, C) according to
Sims et al. (2003).
morphological slums decreases to larger sectors, the area share of these slums of the total slum area within a city increases.
Beside these findings, the geometric means of the slum sizes in the different cities are similar. On aver-age, the geometric mean value
S¼
Pn
j¼1S0;j
n (7)
for the n¼8 considered cities is S¼ 0.0231 km2. The standard deviation
σ¼ ffiffiffiffiffiffiffiffiffiffiffiffiffiffiffiffiffiffiffiffiffiffiffiffiffiffiffiffiffiffiffi Pn j¼1 SS0;j 2 n s (8) for all cities isσ = 0.0181 km2. The high deviation is mainly caused by Cairo and Caracas, as the means are much higher than of the other cities. This is also shown in Figure 3. Considering the fact that Cairo is a special case, like it was mentioned above, and
leaving it out of averaging, the geometric mean for
n¼7 cities (without Cairo) isS= 0.0182 km2with a standard deviation ofσ = 0.0136 km2.
In addition, the width of the distributions in most cases is very similar. The sizes of the morphological slums in the different cities usually vary by about an order of magni-tude around the geometric mean value, which becomes very clear in the values ofσ, which are in a range of 1.3 (cf.
Table 2). When calculating the arithmetic mean
σ0¼
Pn
j¼1σj
n (9)
of the standard deviationsσj for the different cities, the result isσ0 ¼ 1.5. Outliers in this case are again Caracas
(σ= 2.29) and Cairo (σ= 2.07), because the size distribu-tions of these cities are much broader and extend over several orders of magnitude. These findings are also visible in the size distributions shown inFigure 4.
Looking at all identified morphological slums (Table 3), the following picture emerges: 7382
Figure 3.The geometric mean S0 of morphological slums for the different investigated cities is plotted over the number of slumsN. The total area of slums within each city is represented by the area of the circles.
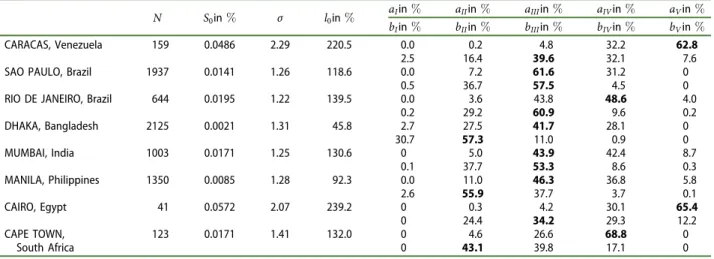
Table 2.Results of analysis of different slum systems. (If the sum of the percentages is less than 100, a few slums are smaller than the values shown above.). The bold values indicate the largest share of slums or slum area in the respective sector.
N S0in% σ l0in% aIin% aIIin% aIIIin% aIVin% aVin% bIin% bIIin% bIIIin% bIVin% bVin%
CARACAS, Venezuela 159 0.0486 2.29 220.5 0.0 0.2 4.8 32.2 62.8
2.5 16.4 39.6 32.1 7.6
SAO PAULO, Brazil 1937 0.0141 1.26 118.6 0.0 7.2 61.6 31.2 0
0.5 36.7 57.5 4.5 0
RIO DE JANEIRO, Brazil 644 0.0195 1.22 139.5 0.0 3.6 43.8 48.6 4.0
0.2 29.2 60.9 9.6 0.2 DHAKA, Bangladesh 2125 0.0021 1.31 45.8 2.7 27.5 41.7 28.1 0 30.7 57.3 11.0 0.9 0 MUMBAI, India 1003 0.0171 1.25 130.6 0 5.0 43.9 42.4 8.7 0.1 37.7 53.3 8.6 0.3 MANILA, Philippines 1350 0.0085 1.28 92.3 0.0 11.0 46.3 36.8 5.8 2.6 55.9 37.7 3.7 0.1 CAIRO, Egypt 41 0.0572 2.07 239.2 0 0.3 4.2 30.1 65.4 0 24.4 34.2 29.3 12.2 CAPE TOWN, South Africa 123 0.0171 1.41 132.0 0 4.6 26.6 68.8 0 0 43.1 39.8 17.1 0
morphological slums were observed in the different cities. A total of 84.6% of all observed slums have a size between 0.001 and 0.1 km2(sectors II and III). In
terms of area, most slums are in sector III (37.1%) and IV (36.8%).
The results of the size relationcare shown inTable 4.
The values in Table 4 show the ratio of larger (>0.1 km2, sectors IV–V) to smaller areas (<0.1 km2, sectors I–III). Caracas and Cairo show values of c≫1, meaning that the area share of larger slums is much higher than that of smaller slums in these cities. In Cape Town, Mumbai, Rio de Janeiro and Manila, the size relation is c≈1, meaning that the slum sizes are distributed evenly over these two categories. In Dhaka and Sao Paulo, most of the slum area is in smaller slum units. Considering all slums of all cities mentioned, we see that c≈1 and the slum areas are distributed approximately equally between larger and smaller slum units.
Comparison of data collection methods
Besides the comparison of the different cities with the same classification methods, we also compare different classification methods for three cities.First, we compare our remote-sensing-based classification of Dhaka with the one from Gruebner et al. (2014) based on remote-sensing data.Second, we compare our classification of Sao Paulo with the one from the IBGE, which relies on census data (and not remote-sensing data).Third, we investigate the influence of different classifications of slums on the size distributions in Cairo.
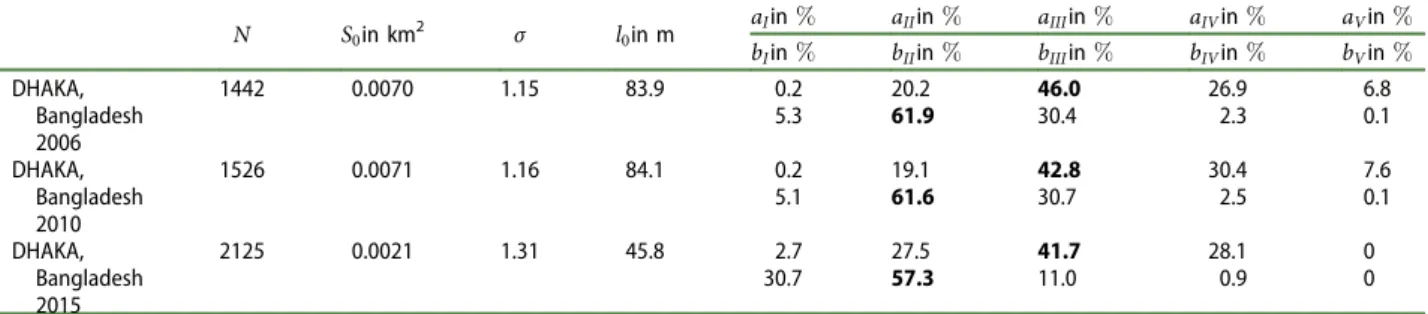
Dhaka, Bangladesh
A morphological approach towards the classification of slum locations seems to be obvious. However, even when
similar ontologies are applied, classification results may differ due to ambiguity of structural change-overs, knowl-edge of the interpreter, among other factors. To account for this, we compare size distributions of different very high-resolution remote-sensing-based classifications of slums in Dhaka, Bangladesh, which have been done by different groups but based on a similar ontology. The histograms inFigure 8show that the size distribution of slums between 2006 and 2010, classified by Gruebner et al. (2014), did not change so much. The geometric mean
varies between S0¼0:0070 km2 (2006) and
S0 ¼0:0071 km2(2010). The standard deviation is similar
for both years (σ¼1:15 for 2006 andσ ¼1:16 for 2010). Besides this, the size distribution resulting from our classification shows a geometric mean of
S0 ¼0:0021 km2. The resulting standard deviation
for the year 2015 isσDhaka2015¼1:31 and thus a little
higher. The results are summarized in Table 5. The size distribution of morphological slums (Figure 5, right) of our classification is much more regularly than the one of Gruebner et al. (2014) (Figure 5, left). Both classifications have in common that they observe a high number of small slums in the area range of 0.001–0.01 km2(sector II).
A reason for this can be seen inFigure 6, where an island in the south west of Dhaka is shown at two times with the two classifications drawn in. Although the underlying morphology did not change very much between the two years, there are big differences in the classification of the slums. While in Gruebner’s classification (yellow), larger areas in the west of the peninsula were classified as slums, in our case (red) these are only smaller slum units. The question of which areas are classified as morphological slums and which are not is difficult to answer, since the transi-tion between formal and informal settlements is smooth, whereby areas are classified differently by different interpreters. This difference in classification can also be observed in other areas of the city of
Table 5.Results for slums in Dhaka. The bold values indicate the largest share of slums or slum area in the respective sector. N S0in km2 σ l0in m aIin% aIIin% aIIIin% aIVin% aVin% bIin% bIIin% bIIIin% bIVin% bVin% DHAKA, Bangladesh 2006 1442 0.0070 1.15 83.9 0.2 20.2 46.0 26.9 6.8 5.3 61.9 30.4 2.3 0.1 DHAKA, Bangladesh 2010 1526 0.0071 1.16 84.1 0.2 19.1 42.8 30.4 7.6 5.1 61.6 30.7 2.5 0.1 DHAKA, Bangladesh 2015 2125 0.0021 1.31 45.8 2.7 27.5 41.7 28.1 0 30.7 57.3 11.0 0.9 0
Table 4.Size relationc for different cities.
City c
Caracas, Venezuela 19.00
Sao Paulo, Brazil 0.45
Rio de Janeiro, Brazil 1.11
Dhaka, Bangladesh 0.39
Mumbai, India 1.04
Manila, Philippines 0.74
Cairo, Egypt 21.25
Cape Town, South Africa 2.20
All considered slums 1.30
Table 3.The results for all considered slums. The bold values indicate the largest share of slums or slum area in the respective sector.
N aIin% aIIin% aIIIin% aIVin% aVin% bIin% bIIin% bIIIin% bIVin% bVin%
all considered morphological slums 7382 0.2 6.1 37.1 36.8 19.7
Dhaka. Discussions about these kinds of uncertainties in the classification of slums can be found in detail in literature (Kohli, Stein, & Sliuzas, 2016; Pratomo, Kuffer, Martinez, & Kohli, 2017).
Sao Paulo, Brazil
InFigure 7, the size distributions of the two classifica-tion methods for the city of Sao Paulo are shown. The number of classified slums differs from 1286 for the Census classification and 1937 for our classification.
The slums classified by the census (left) are in general larger than the morphological slums classified by our own based on remote-sensing data (right). The values shown in the followingTable 6confirm this observation. Furthermore, the geometric mean of the slum sizes in Sao Paulo is higher in the classification of the census than in our classification.
The main reason for the larger values in the census classification is that the census often classifies areas as slums that have no morphological characteristics of slums. An example from the north of Sao Paulo is shown inFigure 8. The displayed section is shown at the two different points in time and both classifica-tions are drawn in. While our classification (red) is clearly oriented towards morphological features, the census classification (yellow) also covers the area east of the slum structure as a slum, which at both times is mainly formally built up with regular patterns and different building types.
This observation can also be made at many other points in Sao Paulo, as can be seen in the following
Figure 9. In the marked areas, the classification by the census identified large areas as slums, although there is no morphological evidence to support this.
Figure 5.Size distributions of slums in Dhaka.
03/02/2010
N
11/07/2015 500 m
Figure 6.Slums in Dhaka. Slum classified by Gruebner et al. (2014) (yellow) and by our own (red), projected on Google Earth Timeline data. Left: Data from 2 March 2010, right: Data from 7 November 2015, access on 10 July 2018. Latitude: 23° 43ʹ09 N– 23° 43ʹ30 N/Longitude: 90° 21ʹ31 E–90° 22ʹ10 E.
Cairo, Egypt
As already indicated above, Cairo is a special case in the study presented here. Our classification of slums leads to 41 morphological slums. This classification relates to type B in the work of Sims et al. (2003). Most of these units are very large, as shown inTable 2, which in turn leads to a high geometric mean ofS0= 0.0572 km2. This
fact can be seen impressively in the proportion of the slum area of slums in the size range of 1–10 km2. With a value ofaV= 65.4%, more than half of the total area of
the morphological slums is in large units.
The situation is different when a different classifica-tion is used. When analysing the size distribuclassifica-tion of all classified slums (Figure 10, right), combining different types of slums (A, B and C) as they were suggested by Sims et al. (2003), the size distribution is more regularly and show a geometric mean of 0.0155 km2.
This is not very different from the mean values of the other investigated cities (Table 2). Considering all slum types (A, B and C), the classification leads to 1031 slum units and the typical lengthl0 nearly halves from 239.2 m
to 124.6 m. The results for Cairo are summarized in
Table 7.
It is also interesting to look at the total area of the slums. A classification of morphological slums (type B) leads to a total area of 13.3 km2, while a classification of all slums leads to a total area of 123 km2. Thus, morpholo-gical slums in Cairo account for only about 11% of all slums we classified according to Sims et al. (2003).
Discussion
The results (Table 2) show that the slum sizes are similar for different metropolitan regions of the
Global South. Out of the 7382 morphological slums identified in our study, almost half of the slums (3339) have a size between 0.001 and 0.01 km2 (sec-tor II) and another 2909 slums are one order of magnitude larger (0.01–0.1 km2, sector III). The average slum size for the examined cities is
S = 0.0182 km2, with a standard deviation of
σ = 0.0136 km2, if the large morphological slums of Cairo are not considered. Morphological slums have a similar size globally, confirming the results of Friesen et al. (2018) with a larger database.
Furthermore, it becomes apparent that the largest share of the slum area occurs in units with 0.01– 1 km2 (sectors III and IV). Assuming a constant population density across the different slums, this result leads to the statement that more than 70% of the slum population (1 billion) live in slums with a size between 0.01 and 1 km2 (sectors III and IV). When linking the results found here to the estima-tions on the current slum population mentioned in the introduction, more than 700 million slum dwell-ers live in slum units with this sizes.
Analysing the different global regions, no strong dependence of the typical slum size on the investigated region can be determined. Only the tendency of South American cities to larger and Asian cities to rather smaller slums can be observed. For Africa, the continent with the strongest population growth, only data for the slums in the cities of Cape Town and Cairo are avail-able. The only city in the sub-Saharan region (Cape Town) considered here is rather a special case due to the strong political influence in the last century (Friesen et al.,2018). The analysis of slums in the fast-growing cities of sub-Saharan Africa such as Lagos, Luanda,
Figure 7.Size distributions of slums in Sao Paulo.
Table 6.Results for slums in Sao Paulo. The bold values indicate the largest share of slums or slum area in the respective sector. N S0in km2 σ l0in m aIin% aIIin% aIIIin% aIVin% aVin% bIin% bIIin% bIIIin% bIVin% bVin% SAO PAULO, Brazil (IGBE) 2010 1286 0.0251 1.22 158.6 0.0 2.0 31.3 40.8 25.9 0.2 21.3 66.25 11.2 1.1 0.0 2.0 31.3 40.8 25.9 0.2 21.3 66.25 11.2 1.1 SAO PAULO, Brazil 2015 1937 0.0141 1.26 118.6 0.0 7.2 61.6 31.2 0 0.5 36.7 57.5 4.5 0 0.0 7.2 61.6 31.2 0 0.5 36.7 57.5 4.5 0
Kinshasha or Nairobi is in demand for confirming or declining the observed trends, since previous studies show that the slum areas in these cities differ in their characteristics (Kuffer, Orina, Sliuzas, & Hannes,2017).
The findings mentioned above can be used as input to systematically plan infrastructures for the supply of slums. From the analysis that a large part of the global slum population lives in smaller slum
Figure 9.Slums classified by the IBGE (yellow) and by our own (red). The boxes A–E show slum classified by the IBGE, without morphological evidence. Classifications are projected on Google Earth data, access on 10 July 2018. Latitude: 23°15ʹ–23° 52′S/ Longitude: 46° 59ʹ–46° 09ʹW.
Figure 8.Slum classified by the IBGE (yellow) and by our own (red), projected on Google Erath Timeline data. Left: Data from 13 September 2010, right: Data from 13 June 2015, access on 10 July 2018. Latitude: 23° 32ʹ36–23° 32ʹ56 S/Longitude: 46° 27ʹ51– 46° 27ʹ38 W.
units, we can derive requirements for infrastructure measures. The worldwide similarity of the slum units suggests the development of small, decentralized units that can be used to supply these settlements. These could be, for example, container solutions for small water distribution systems. In larger slums, on the other hand, it could be useful to set up small semi-centralized supply systems from which, for example, pipelines lead to smaller subunits that sup-ply certain areas of the slum (Figure 11). However, we need to clarify the requirements for infrastructure systems. For example, whether there is room for the implementation of infrastructure in densely popu-lated settlements. It is also necessary to analyse which approach makes sense from which size onwards. This involves the question of what a “big” and what a“small” slum is.
The different classifications of slums carried out for Dhaka, Cairo and Sao Paulo show that the classi-fication methods have a considerable influence on the resulting size distribution. In the cases of Dhaka and Sao Paulo, our classification leads to smaller identi-fied units.
With regard to classification, the question arises of how two adjacent slums can be distinguished from each other. In the study shown, slums were separated if they are more than 10 m apart. It should be noted that the study compares only morphological slums and cannot make any statement about their socio-logical situation.
The analysis of slums in Cairo shows that although slums globally have similar structures, local differences must be taken into account. In some cities, economic or political boundary conditions lead to other settlement classes of urban poverty being found in addition to morphological slums (compare the analysis of Cape
Town by Friesen et al. (2018) or the global
categorization of arrival cities by Taubenböck et al. (2018)). If a globally uniform classification is used, only a part of living places of the urban poor is identi-fied (Kuffer, Pfeffer, Sliuzas, Baud, and Maarseveen,
2017).
Although many people in Cairo live in informal settlements, morphological slums are only a small part of it (Kraas & Schlacke, 2016). A large propor-tion of informal settlements are not characterized by very small buildings. Rather, there are many build-ings with several floors, in some areas of Cairo even 8–15 floors. The informal character of the settlements lies rather in the not clearly defined legal situation and the associated poor connection to supply infra-structures, resulting in bad living conditions.
Furthermore, the question arises as to which kind of probability distribution best describe the size dis-tributions found. To investigate this question, studies of the kind of Giesen, Zimmermann, & Suedekum (2010) and González-Val, Ramos, Sanz-Gracia, & Vera-Cabello (2015) are necessary, as they have already been carried out in the analysis of the size distributions of cities within countries. The discus-sion of probability distribution functions as well as the different statistical tests to assess the goodness-of-fit necessary for this goes beyond the scope of this work and should be dealt with in future publications.
Summary and outlook
In the presented study, we identify morphological slums, using remote-sensing data and analyse their size distribution in different cities in different regions of the world. We showed that the majority of slums (84.6%) have an area between 0.001 and 0.1 km2and slums have a similar size globally. With the extension of the data base we generalize previous investigations
Figure 10.Size distributions of slums in Cairo.
Table 7.Results for slums in Cairo. The bold values indicate the largest share of slums or slum area in the respective sector. N S0inkm2 σ l0inm aIin% aIIin% aIIIin% aIVin% aVin% bIin% bIIin% bIIIin% bIVin% bVin% CAIRO, Egypt type B 41 0.0572 2.07 239.2 0 0.3 4.2 30.1 65.4 0 24.4 34.2 29.3 12.2 CAIRO, Egypt All types (A,B,C)
1031 0.0155 2.01 124.6 0 1.4 9.4 49.6 39.6
(Friesen et al., 2018). Although cities with larger (Caracas) and smaller slum sizes (Dhaka) appear, the average value lies in the range ofS¼ 0.0182 km2with a standard deviation ofσ= 0.0136 km2, when investigat-ing 7 cities.
Furthermore, we showed that a classification of morphological slums is useful for infrastructure plan-ning, etc. These classifications, based on morphologi-cal aspects, seem to be more suitable for these aims than census-based classifications.
Nevertheless, further investigations are necessary. These should primarily focus on cities in sub-Saharan Africa, as this region is currently due to the enor-mous demographic dynamics expected to experience the greatest slum growth.
Since the size distributions were only examined qualitatively, future studies should investigate the kind of distribution fitting the data the best. Methodological paths for this can be found in several studies for city size distribution in countries (Giesen et al., 2010; González-Val et al., 2015). When know-ing the type of distribution, fittknow-ing the data the best, that can be used to identify processes that lead to this type of distributions and to a better understanding of the similar size of slums.
Acknowledgments
We would like to thank the KSB Foundation under Grant 1311 for providing funds for the research and acknowledge support by the German Research Foundation and the Open Access Publishing Fund of Technische Universität Darmstadt.
Disclosure statement
No potential conflict of interest was reported by the authors.
Funding
We would like to thank the KSB Foundation under Grant 1311 for providing funds for the research.
ORCID
John Friesen http://orcid.org/0000-0003-2530-1363
Hannes Taubenböck http://orcid.org/0000-0003-4360-9126
Michael Wurm http://orcid.org/0000-0001-5967-1894
References
Demográfico, C. (2010). Aglomerados subnormais: Primeiros resultados. Rio de Janeiro: Ministério Do Planejamento, Ornamento e Gestào Instituto Brasileiro de Geografia e Estatistica-IBGE,201, 1.
Ezeh, A., Oyebode, O., Satterthwaite, D., Chen, Y.-F., Ndugwa, R., Sartori, J., Mberu, B. (2017). The history, geography, and sociology of slums and the health pro-blems of people who live in slums. The Lancet, 389
(10068), 547–558. doi:10.1016/S0140-6736(16)31650-6
Friesen, J., Rausch, L., & Pelz, P.F. 2017. Providing water for the poor–Towards optimal water supply infrastruc-tures for informal settlements by using remote sensing data. In JURSE 2017, 1–4. IEEE. doi:10.1109/ JURSE.2017.7924541
Friesen, J., Taubenböck, H., Wurm, M., & Pelz, P.F. (2018). The similar size of slums. Habitat International, 73
(March), 79–88. doi:10.1016/j.habitatint.2018.02.002
Giesen, K., Zimmermann, A., & Suedekum, J. (2010). The size distribution across all cities–Double Pareto lognor-mal strikes.Journal of Urban Economics,68(2), 129–137.
doi:10.1016/j.jue.2010.03.007
González-Val, R., Ramos, A., Sanz-Gracia, F., & Vera-Cabello, M. (2015). Size distributions for all cities: Which one is best?Papers in Regional Science,94(1), 177–196. Gruebner, O., Sachs, J., Nockert, A., Frings, M., Mobarak
Hossain Khan, M., Lakes, T., & Hostert, P. (2014). Mapping the slums of Dhaka from 2006–2010.Dataset Papers in Science,2014, 1–7. doi:10.1155/2014/172182
Habitat, United Nations.2016.Housing & slum upgrading. Retrieved from http://unhabitat.org/urban-themes/hous
ing-slum-upgrading/.
Kohli, D., Sliuzas, R., Kerle, N., & Stein, A. (2012). An ontol-ogy of slums for image-based classification. Computers, Environment and Urban Systems, 36(2), 154–163.
doi:10.1016/j.compenvurbsys.2011.11.001
Kohli, D., Stein, A., & Sliuzas, R. (2016). Uncertainty analy-sis for image interpretations of urban slums.Computers, Environment and Urban Systems, 60(November), 37–49.
doi:10.1016/j.compenvurbsys.2016.07.010
Kraas, F., & Schlacke, S. (2016).Der Umzug der Menschheit: Die transformative Kraft der Städte. Berlin: Wissenschaftlicher Beirat der Bundesregierung, Globale Umweltveränderungen. Kuffer, M., Orina, F., Sliuzas, R., & Hannes, T.2017. Spatial patterns of slums: Comparing African and Asian cities. JURSE 2017, 1–4. IEEE.
Kuffer, M., Pfeffer, K., & Sliuzas, R. (2016). Slums from space–15 years of slum mapping using remote sensing.
Remote Sensing,8(6), 455. doi:10.3390/rs8060455
Kuffer, M., Pfeffer, K., Sliuzas, R., Baud, I., & Maarseveen, M. (2017). Capturing the diversity of deprived areas with image-based features: The case of Mumbai. Remote Sensing,9(4), 384. doi:10.3390/rs9040384
Lilford, R.J., Oyebode, O., Satterthwaite, D., Melendez-Torres, G.J., Chen, Y.-F., Mberu, B., Watson, S.I. (2017). Improving the health and welfare of people who live in slums. The Lancet, 389(10068), 559–570.
doi:10.1016/S0140-6736(16)31848-7
Mahabir, R., Croitoru, A., Crooks, A., Agouris, P., & Stefanidis, A. (2018). A critical review of high and very high-resolution remote sensing approaches for detecting and mapping slums: Trends, challenges and emerging opportunities.
Urban Science,2(1), 8. doi:10.3390/urbansci2010008
Mahabir, R., Crooks, A., Croitoru, A., & Agouris, P. (2016). The study of slums as social and physical constructs: Challenges and emerging research opportunities.
Regional Studies, Regional Science, 3(1), 399–419.
doi:10.1080/21681376.2016.1229130
Pratomo, J., Kuffer, M., Martinez, J., & Kohli, D. (2017). Coupling uncertainties with accuracy assessment in object-based slum detections, case study: Jakarta, Indonesia.Remote Sensing,9(11), 1164. doi:10.3390/rs9111164
Rausch, L., Friesen, J., Altherr, L., Meck, M., & Pelz, P. (2018). A holistic concept to design optimal water sup-ply infrastructures for informal settlements using remote
sensing data. Remote Sensing, 10(2), 216. doi:10.3390/ rs10020216
Sims, D., Sejoume, M., & El Shorbagi, M. (2003). Cairo, Egypt.Understanding urban slums.
Subbaraman, R., Nolan, L., Shitole, T., Sawant, K., Shitole, S., Sood, K., Nanarkar, M. … & Patil-Deshmukh, A. (2014). The psychological toll of slum living in Mumbai, India: A mixed methods study. Social Science & Medicine, 119(October), 155–169. doi:10.1016/j. socscimed.2014.08.021
Taubenböck, H., & Kraff, N.J. (2014). The physical face of slums: A structural comparison of slums in Mumbai, India, based on remotely sensed data. Journal of Housing and the Built Environment, 29(1), 15–38.
doi:10.1007/s10901-013-9333-x
Taubenböck, H., Kraff, N.J., & Wurm, M. (2018). The morphology of the arrival city–A global categorization based on literature surveys and remotely sensed data.
Applied Geography, 92(March), 150–167. doi:10.1016/j. apgeog.2018.02.002
United Nations. (2015). Sustainable development goals.
United Nations Sustainable Development (blog). Retrieved from https://www.un.org/sustainabledevelop
ment/sustainable-development-goals/.
United Nations. (2016). Urbanization and development: Emerging futures. World cities report. New York: Author. Van der Bruggen, B., Borghgraef, K., & Vinckier, C. (2010). Causes of water supply problems in urbanised regions in developing countries.Water Resources Management,24
(9), 1885–1902. doi:10.1007/s11269-009-9529-8
Wurm, M., & Taubenböck, H. (2018). Detecting social groups from space – Assessment of remote sensing-based mapped morphological slums using income data.
Remote Sensing Letters, 9(1), 41–50. doi:10.1080/ 2150704X.2017.1384586