Determinants of Bank Performance: The Application of the CAMEL
Model to Banks Listed in China’s Stock Exchanges from 2008 to
2011
Jie Liu1, Witsaroot Pariyaprasert2
Abstract: This study aims to examine the impact of independent variables from CAMEL model on bank performance in China’s banking sector. These independent variables from CAMEL model include: capital adequacy, asset quality, management, earning and liquidity. The sample size for this research was the 13 Chinese banks listed in Shanghai Stock Exchange and Shenzhen Stock Exchange from 2008 to 2011.The fixed effects multiple linear regression model was adopted in this study to measure the relationship between internal determinants from CAMEL model and bank performance. The findings of this research show that return on assets can be influenced by shareholders’ risk-weighted capital adequacy ratio, NPL to total loans ratio, costs to income ratio, net interest rate margins, and loans to deposits ratio. Meanwhile, this study indicates that return on equity can be influenced by costs to income ratio, operating expenses to assets ratio, and Loans to deposits ratio.
Key words: Bank performance, CAMEL model, capital adequacy, asset quality, management, earning, liquidity
1. Introduction
1Nowadays, the financial sector plays a
key function in every industry for each country, and is regarded as the backbone of a country’s economyGolin (2001). According to Jha and Hui (2012), investment is promoted by a strong financial system which is able to offer the environment of efficiently allocating resources, mobilizing savings and financing productive business opportunities. It also makes it easy for
1Jie Liu is an MBA student from Assumption
University of Thailand.
2This research was completed under the
supervision of Dr. Witsaroot Pariyaprasertin Assumption University of Thailand.
the trade of goods and services. The global financial crisis during 2007 and 2009 showed the bank’s performance was very important for the national and international economic growth, and it should be monitored (Olweny, 2011). Athanasoglou, Brissimis and Delis (2005) pointed out that it is more prominent for the importance of bank’s performance in developing countries.For the financial markets in the countries which are not developed well yet, the banks are the primary economic savings depository and main source for financing the majority of companies. The financial industry in Chinahas had significant growth with the rapid development of the Chinese economy. The Chinese banking industry benefited
from the rapid growth, played a leading role among financial activities and was responsible for the allocation of credit resources.
In recent years, the reform and innovation of Chinese banks have obtained remarkable results.For the entire banking industry the historic changes have taken place, and these Chinese banks played an important supporting and promoting effect in Chinese economic and social development (Zhong, 2007).
In the past 10 years, the financial market in Chinahas had a stable and remarkable growth, especially in its stock market. By the end of 2011, the number of companies listed on the Shanghai Stock Exchange and the Shenzhen Stock Exchange reached to 2,342, and the market value is about RMB21.5 trillion(China Banking Regulatory Commission, 2012).
With the ShenZhen Development Bank listed in the ShenZhen stock exchange on April 3, 1991, Chinese banks started to prepare the process of listing (Huang, 2010). At the end of 2011, there were 14 banks listed in the Shanghai Stock Exchange and 2 banks listed in the Shenzhen Stock Exchange.
This research studies the relationship between the bank performance within the Chinese bank industry on the Chinese stock market (Shanghai Stock Exchange and Shenzhen Stock Exchange) during the period of 2008 to 2011. It aimed to figure out if the capital adequacy ratio, assets quality ratio, management ratio, earning ratio and liquidity ratio significantly affect bank performance.This study will be
significant to many parties such as investors, management and regulators of banks and depositors.
This article reviews the relevant literature and empirical studies. After that the conceptual framework and hypotheses are developed. Finally the research methodology, discusses the finding of this study,with recommendation and suggestions for future research are presented.
1. Literature Review
This section reviews the relevant literatures that related to the main concept of this study.
- Bank Performance
According to European Central Bank (2010), the definition for describing the bank performance is the capacity of the banks to generate sustainable profitability. Profitability is very important for a bank, in term of the capability to hold ongoing activities and to obtain good return for its investors. Golin (2001) pointed that earnings and profitability were the ways to evaluate the overall performance of a bank. The bank will be able to bar exceptional circumstances, to maintain its solvency and to grow by making adequate earnings and profitability. Later on, Jha and Hui (2012) also pointed that the analysis of financial ratios could present better investment choices to investors, for it evaluates in each different angle of the performance of a company.
- Measurement of Bank Performance
There are many different measures of a bank’s performance in literature. Among these performance measures, return on assets (ROA) and return on equity (ROE) were the two of the most populart ratios used for accessing the bank or other industries’ performance. Beyond that, there are still many other measures like net interest margin, Tobin’s Q and Economic value added could be used to indicate the performance of a bank in the previous studies.
Return on assets indicates net profit against assets inputs, the majority of assets in most of banks consist of loans. Return on assets measures how effectively a bank’s assets are being administrated to make profits (Golin, 2001). Return on assets showed how much profit a company earned for every dollar of its assets, it was a primary indicator for managerial efficiency (Elyor, 2009). Bakar and Tahir (2009) used ROA as a dependent variable for bank performance with success.
Return on equity indicates net profit against equity input (Golin, 2001).The ROE indicates the rate of return for the shareholders of this bank, it reviews how effectively a bank used its investors’ money (Elyor, 2009). Siddiqui and Shoaib (2011) measured the performance of 22 banks in Pakistan for the period 2002 to 2009 by using ROE with success.
- CAMEL Model
The CAMEL method is derived from a system developed by the Federal
Financial Institutions Examination (FFIEC) on March 1979. CAMEL is an acronym that indicates the five most important attributes for the bank financial analysis. The CAMEL framework aims to categorize the key determinants on banks’ financial performance. The five determinants are: C for Capital Adequacy
A for Asset Quality M for Management E for Earnings L for Liquidity
Nowadays, bank credit analysts universally adopt the CAMEL model for credit analysis. The CAMEL approach was used to estimate bank creditworthiness by most credit and rating agencies in the financial industry. There are even a number of equity analysts who used the CAMEL approach to help themselves to make recommendations concerning the valuation of bank stock (Golin, 2001). Elyor (2009) proved that the CAMEL model is a good model to improve bank performance. Both ROA and ROE were found be influenced by the determinants from the CAMEL framework in his research. Olweny (2011) also used the CAMEL approach to locate the determinants on Kenya banks’ profitability, and it showed that all the bank-specific factors that came from the CAMEL approach had statistically important effect on the profitability of a bank.
- Capital Adequacy
Capital adequacy relates to the sufficiency of the amounts of capital for absorbing any potential risks that a bank may encounter. According to Kosmidou (2008), capital adequacy ratio is an important measure to identify the condition of financial institutions and the banks’ wellness. There are two ratios are fund to represent the capital adequacy in the previous studies,shareholders’ equity to assets ratio and risk-weighted capital adequacy ratio.
Shareholders’ equity to assets ratio relates to the overall utilization of financial leverage of a company. The higher ratio indicates the stronger capital level, but less utilization of financial leverage at the same time.Olweny (2011) employed the ratio of total equity to total assets to indicate the capital adequacy for the banks in Kenya, it showed that ratio of total equity to total assets was related to the return on assets (ROA) positively.
Risk-weighted capital adequacy ratio is a measure of banks’ capital, and it shows the percentage of banks’ risk weighted credit exposure.Naceur (2003) used the risk-weighted Capital Adequacy Ratioto represent the capital adequacy of Tunisian banks, and he found a strong positive relationship between Capital Adequacy Ratioand return on assets.
- Assets Quality
Asset quality reveals a bank’s asset risk situation and a bank’s financial strength. For this reason, this factor performs a
major role for assessing the bank’s current situation and its future viability(Zhong, 2007). The profitability of banks could be impaired by bad asset quality through increasing the provisioning cost and decreasing the income of interest (Ioannidis, PasiourasandZopounidis, 2009).There are three ratios representing the capital adequacy in the previous studies, Non-performing loan (NPL) to total assets ratio,NPL to total loans ratioand the loans to total assets ratio.
NPL to total assets ratio is calculated by dividing NPL to total assets, and it also shows the portion of NPL in a bank’s total assets.Elyor (2009) found that the performance of the banks in Malaysia were significantly affected by NPL to total assets ratio.
NPL to total loans ratioreveals the degree of a bank’s lending to borrowers who were not returning it back (Golin, 2001). Olweny (2011) showed a strong negative relationship between poor asset quality (NPL to gross loans ratio) and profitability (ROA) from Kenya commercial banks.
The loans to total assets ratio indicates the total outstanding loan as the percentage of a bank’s total assets(Atikogllari, 2009). Atikogllari (2009) used the ratio of loans to assets to observe the asset quality in the period of 2001 to 2007, a relatively diminished the asset quality was found during the period investigated.
- Management
Management relates to the competency of the bank’s managers, using their expertises to make subjective judgments,
create a strategic vision, and other relevant qualities. Management is the key variable which determines a banks’ success.The evaluation of the management is the hardest one to be measured and it is the most unpredictable (Golin, 2001). There are two ratios representing the management in the previous studies, operating costs to net operating income ratio, and operating expenses to assets ratio.
The operating costs to net operating income ratio indicates the percentage of a bank’s income that is being used to pay operational costs. It offers information on the management efficiency regarding costs relative to the income it generates.Olweny (2011) adopted the ratio of operating costs to net operating income to indicate the operating efficiency for the commercial banks in Kenya, and he found that the operational costs inefficiency leads to poor profitability.
The operating expenses to assets ratio indicate expenses in relation to the size of a bank. It was similar with cost to income ratio but it was not affected by the changes in interest. Atikogullari (2009) observed the management quality situation of the northern Cyprus banking sector for the period of 2001 to 2007 by using operating expenses to assets ratio.
- Earning
The viability in the future of a bank relies on the ability that the bank could earn for the adequate returns by using its assets. Earning ability enables a bank to increase its funds, expand its capital and keep its competitive position. Earning ability is one of the most important
determinants of performance (Atikogullari, 2009). Net interest rate margins could be used to represent the earning ability in the previous studies. Net Interest Rate Margins (NIM) indicates a key factor of the bank’s earning ability. Net interest margin represents the difference between the banks’ income of interest received on securities and loans and cost of interest of bank’s borrowed capital. It shows the bank’s efficiency and cost of intermediation services (Khrawish, 2011).Jha and Hui (2012) found a positive relationship between NIM and ROA
- Liquidity
A bank’s liquidity is regarded as the ability to fulfill its short-term liability, and maintain its solvency at the same time. Therefore, the bank ought to keep its solvent for new loans requirement and unanticipated drain on deposits. However, overhead liquidity level amount had an adverse effect on the profitability of the bank. The proximate cause of most bank failures is the lack of sufficient liquidity (Golin, 2001). There are three ratios are found to represent the liquidity in previous studies, loans to deposits ratio, liquid assets to deposits ratio, and liquid assets to total assets ratio.
Loans to deposits ratio shows the percentage of loan which has been lent to customer against the deposits that from the other customers.Elyor (2009) found a negative relationship between the loans to deposits ratio and bank performance.
Liquid assets to deposits ratio shows the capacity of banks to cover the unanticipated deposits drain.Olweny (2011) found a weak positive relationship between liquid assets to deposits ratio and ROA.
Liquid assets to total assets ratio indicates the ability of a bank to pay its liabilities by using liquid assets.Atikogullari (2009) observed the liquidity condition of the northern Cyprus banking sector for the period of 2001 to 2007 by using liquid assets to total assets ratio.
Apart from the factors based on the CAMEL model, there are still some external factors which could affect bank performance from the macroeconomic way, including
- Bank Size
The size of a bank was considered to be a key determinant on its performance or profitability. The economies of scale could enable the big size of banks to decrease the processing costs and other information gathering costs (Boyd and Runkle, 1993).Alkhatib (2012) used logarithm of total assets to indicate the bank size for the Palestinian commercial banks, and he found there was a statistically significant impact of bank size on bank performance.
- Annual Gross Domestic Product
Growth (GDPGR)
The annual gross domestic product growth was calculated as the percentage change to the gross domestic product. The demand and the supply for loans and deposits were expected to be
effected by GDPGR, so that it will affect the performance of a bank directly (Kosmidou, 2012).Khrawih (2011) reported a negative significant relationship between GDPGR and ROE.
- Inflation
Inflation was also another important macroeconomic indictor, which could affect both the revenues and costs of banks. Staikouras and Wood (2003) showed that inflation could have the effects to the changes in interest rates and asset prices. Kosmidou (2008) pointed that inflation had a negative impact on bank profitability.
- Money Supply
Money supply relates to quantity of available money in the economy, and it was basically determined by the monetary policy. Depending on the quantity theory of money, the price level and nominal GDP may be affected by the changes in the money supply (Kosmidou,2008).Mamatzakis and Remoundos (2003) found the money supply significantly influences bank profitability.
2. Conceptual Framework and
Research Methodology
Base on the various concepts and previous studies, the following conceptual framework showing the relationship between independent variables and dependent variable was created.
Sixteen research hypotheses were developed to investigate the relationship among the variables included in the
conceptual framework.These hypotheses test if there is a significant relationship between the capital adequacy ratio, assets quality ratio, management ratio, earning ratio and liquidity ratio with bank performance.This study will be significant to many parties such as investors, management and regulators of banks and depositors.
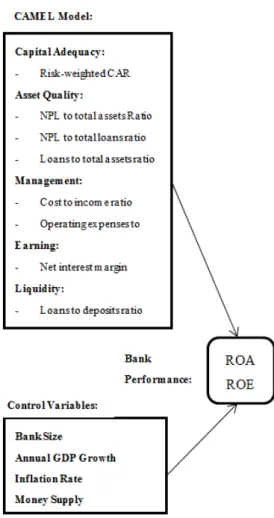
Figure 1 – Conceptual Framework
Source: created by the author for this study
The factors influence bank performances are divided into two category types, the CAMEL factors and the control variables. The CAMEL factors include capital adequacy (the risk-weighted
capital Adequacy Ratio), assets quality (NPL to total assets ratio, NPL to total loans ratio and loans to total assets ratio), management (costs to income ratio and operating expenses to assets ratio), earning (NIM ratio) and liquidity (loans to deposits ratio).
Except the factors based on the CAMEL model, there are still some factors which are too important to be ignored, based on the requirement of the multiple linear regression model. So some external factors outside the CAMEL model are also included. These factors are called the controlvariables.The bank size (log of total assets), annual gross domestic product growth, inflation rate and money supply are selected as the control variables which could also affect the bank’s performance from the previous studies.
- Research regression models
The fixed effects multiple linear regression model was adopted in this study to measure the relationship between CAMEL factors and bank performance. The fixed effects multiple linear regression model is the multiple linear regression model which adds the dummy variables to capture the difference of entities in the panel data extraction.
There are 2 fixed effects multiple linear regression model in this study.
Model 1 is used to test the relationship between independent variables and ROA:
ROAit = β0+ β1CARit + β2NPLTTAit + β3NPLTTLit + β4TLTTAit + β5CTIit+ β6OETTAit + β7NIMit+ β8TLTTDit+ β9LGBSit + β10GDPYOYt+ β11CPIYOYt+ β12CNMSYOYt + ∑ ∅ + uit
Model 2 is used to test the relationship between independent variables and ROE:
ROEit = α0+α1CARit +α2NPLTTAit
+α3NPLTTLit +α4TLTTAit
+α5CTIit+α6OETTAit
+α7NIMit+α8TLTTDit+α9LGBSit
+α10GDPYOYt+α11CPIYOYt+α12CNMS
YOYt + ∑ ɤ + uit
Note: Subscript I refers to firm i, and subscript t refers to year t.
Where
ROA = Return on Assets ROE = Return on Equity
CAR = Risk-weighted Capital Adequacy Ratio
NPLTTA = NPL to Total Assets Ratio NPLTTL = NPL to Total Loans Ratio TLTTA = Loans to Total Assets Ratio CTI = Costs to Income Ratio
OETTA = Operating Expenses to Assets Ratio
NIM = Net Interest Margin LTD = Loans to Deposits ratio LGB = log (total assets)
GDPGR = Annual Gross Domestic Product Growth Ratio
CPI = Consumer Price index
This research examines the relationships between CAMEL factors that impact bank performance in the banking industry from the China’s stock market. There are 13 banks which provided
semi-yearly data from 2008 to 2011. In total, there are 104 observations in this study’s sample data set.
3. Finding and Discussion
The summary of findings is shown in two tables: Table 1 is the summary of hypothesis results in regards to ROA, and Table.2 is a summary of hypothesis results in regards to ROE.
Variable Coefficient p-value Result
CAR 0.026558 0.0041 Reject Ho MPLTTL 0.777585 0.1171 Failed to reject Ho NPLTTA -0.471447 0.0769 Reject Ho LTTA 0.000905 0.9062 Failed to reject Ho CTI 0.085903 0.0361 Reject Ho OETA -0.353727 0.1139 Failed to reject Ho NIM 0.143299 0.0584 Reject Ho LTD -0.017685 0.0039 Reject Ho
Table 1 Summary of Hypothesis results
in relation to ROA
Table 1 show that the capital adequacy ratio (CAR) is significant at a 1% level.The cost to Income ratio (CTI) and the loans to deposits ratio (LTD) are significant at a 5% level, while the NPL to total loans ratio (NPLTTL) and the net interest rate margins (NIM) are significant at a 10% level. But the other CAMEL variables: the NPL to total assets ratio (NPLTTA), the loans to total assets ratio(LTTA) and the operating expenses to assets ratio (OETA) don’t have significant relationship with ROA.
Variable Coefficient p-value Result CAR -0.309372 0.1768 Failed to reject Ho MPLTTL -6.939434 0.2997 Failed to reject Ho NPLTTA 13.70712 0.2725 Failed to reject Ho LTTA 0.078795 0.6851 Failed to reject Ho CTI 2.809947 0.0072 Reject Ho OETA -16.73148 0.0037 Reject Ho NIM 2.760096 0.1472 Failed to reject Ho LTD -0.308859 0.0434 Reject Ho
Table 2 Summary of Hypothesis results
in relation to ROE
Table 2 show that the cost to Income ratio (CTI) and the operating expenses to assets ratio (OETA) are significant at a 1% level. The loans to deposits ratio (LTD) are significant at a 5% level. But the other CAMEL variables: the capital adequacy ratio (CAR), the NPL to total assets ratio (NPLTTA), the NPL to total loans ratio (NPLTTL), the loans to total assets ratio (LTTA), and the net Interest rate margins (NIM) don’t have significant relationship with ROE.
The findings of this research show that bank performance in term of return on assets can be influenced by 5 factors from the CAMEL model, which include: 1. Shareholders’ risk-weighted capital adequacy ratio; 2. NPL to total loans ratio; 3. Costs to income ratio; 4. Net interest rate margins; 5. Loans to deposits ratio.
Meanwhile, it is also shown that return on equity can be influenced by 3 factors from the CAMEL model, which include: 1. Costs to income ratio; 2. Operating expenses to assets ratio; 3. Loans to deposits ratio.
The relationship of each factor toward ROA and ROE is discussed below.
3.1 The relationship between Capital
adequacy and bank performance The testing results show that the shareholders’ risk-weighted capital adequacy ratio has a significant positive effect to ROA. The relationship is significant at a 1% level, and that implies capital adequacy ratio is one of the most important factors influencing bank performance. According to Kosmidou (2008), the capital adequacy ratio is an important measure to identify the health of banks and financial institutions. The capital adequacy ratio is also regarded as one indicator of financial strength for the capacity against abnormal and operational losses. Adequate capital could act like a buffer for preventing loan losses to reduce bank risk and avoid liquidity problems happening (Zhong, 2007). Banks face less business and bankruptcy costs when it has a higher capital adequacy ratio, and tends to be more profitable (Abreu & Mendes, 2002).
On the contrary, the shareholders’ risk-weighted capital adequacy ratio is found to have no significant effect on bank ROE. This could be true, because it may cause the profitability decrease if the capital adequacy ratio is too high. A high capital adequacy ratio shows that a banks’ capital is not fully utilized, and banks lose their opportunity to earn money by using this capital (Naceur, 2003).
3.2 The relationship between asset quality and bank performance There is a negative relationship between the ratio of NPL to total loans and ROA, and the significant level was at 10%. However, the results showed there is no significant relationship between the other asset quality ratios (NPL to total assets ratio and loans to total assets ratio) and ROA. In the ROE model, all the asset quality ratios (which are NPL to total assets ratio, NPL to total loans ratio and loans to total assets ratio) were found have no significant relationship with ROE.
Low assets quality will affect banks’ profitability, because higher reserves are required for low assets quality and the reserves will be deducted from the banks’ profits. But on the other hand, the low asset quality (high NPL to assets ratio, high NPL to total loan ratio and high loan to asset ratio) may indicate that the banks are trying to expand their loan lending business aggressively. The assets quality of the aggressive loan lending banks may be lower than conservative banks, but the profitability for the aggressive loan lending banks may be higher than conservative banks. For this case, the relationship between assets quality and bank performance is becoming more complicated.
The relationship between assets quality and bank performance is also different in different economic cycles. There tends to be lower relationship between assets quality and bank performance in good economic times. However, the assets quality sounds very important to a bank, especially to a bank’s performance
when it is in an economic recession period (Elyor, 2009).
To summarize the results, it’s a very complicated situation when it comes to the relationship between asset quality ratios and bank performance. Differing from the other previous studies such as Atikogllari(2009), the researcher found that one asset quality ratio (NPL to total loans ratio) which has a significant relationship with ROA in this study. Thus, the NPL to total loans ratio could be used to represent the asset quality to reveal the relationship between assets quality and bank performance for the Chinese banks.
3.3 The relationship between
management and bank performance The results show that cost to income ratio has a significant positive relationship with ROA and ROE. This means, when the cost increase, ROA and ROE also increase respectively. High costs may indicate banks conduct their business positively and aggressively. In the interbank market, banks often need to borrow money from other banks or the money market to meet the loan demands. In this way, although there is some cost rising from the interbank borrowing, banks could lend out more money and get more income, especially from interest income (Elyor, 2009). The results show that the operating expenses to assets ratio has a significant negative relationship with ROE, but has no relationship with ROA. The operating expenses could be decreased under a good bank management, and in this way, a corresponding increase in net
profits could be expected. The ROA of this bank will also increase, because of increasing of the profits and decreasing of the operating expenses.
4.4 The relationship between earning ability and bank performance
The net interest margin has a significant relationship with ROA. This result is same as Khrawish (2011). The net interest margin (NIM) reveals the difference between the banks’ income of interest which received on securities and loans and the cost of interest of banks’ borrowed capital. It also shows the bank’s efficiency and cost of intermediation services (Khrawish, 2011).
Another measurement of earning ability which is the net interest margin has no significant relationship with ROE. This differs from Elyor (2009) who found a relationship between net interest margin and ROE. The majority of a bank’s income is generated from interest earned from loans, leasing operations, and investment securities. The main expense is interest paid to retain deposits and to float overnight loans from other financial institutions. Therefore, NIM does not distinguish the impact of non-interest income and non-non-interest expense on bank’s performance.
4.5 The relationship between liquidity and bank performance
The loan to deposit ratio has a significant positive relationship with both ROA and ROE. This means the bank with the higher loan to deposit ratio (which indicates lower liquidity), may have a higher performance. This result differs from another previous studies which found a negative
relationship between loan to deposit ratio with ROA and ROE (Elyor, 2009). The higher loan to deposit ratio means the bank lend out more money to earn interest.So the profitability of the bank should be increased by the increasing in loan outstanding trend. Somehow when the loan to deposit ratio is too high, the bank may face the liquidity risk. Golin (2001) pointed out the liquidity risk could cause bank failure. The problem of liquidity always results from the inability to reduce liabilities or to expand the assets side of the balance sheet of a bank (Athanasoglou, Brissimis& Delis, 2005). A bank might be forced to borrow emergency capital with a higher cost when facing liquidity problems, and it will decrease its profitability (Elyor, 2009).
4. Conclusion and
recommendations
In conclusion, bank performance (both ROA and ROE) in China is influenced by the cost to income ratio and loans to deposits ratio. However, when it comes to different performance indicators, the results are different.
If banks are more careful about the performance on ROA, then the relevant ratios including the shareholders’ risk-weighted capital adequacy ratio, NPL to total loans ratio, cost to income ratio, net interest rate margin and loans to deposits ratio should be improved.First of all, a bank should maintain its shareholders’ risk-weighted capital adequacy ratio in a relatively high number to make the bank reach a high capital adequacy position. Secondly, bank should decrease its non-performing loan to improve its asset
quality. Thirdly, the management of the bank should manage the cost of the bank to be rationally utilized, and the cost to income ratio should be in a reasonable range. Fourthly, the bank should improve its net interest margin, and maximize the income of loan product. Finally, bank should try to get more deposits to increase its liquidity.
If the banks are more careful about the performance on ROE, then the cost to income ratio, operating expenses to assets ratio and loans to deposits ratio should also be improved. Firstly, the management ability is quite crucial for the performance on ROE. Both ratio (the cost to income ratio and operating expenses to assets ratio) representing the management ability of bank. The management of the bank should pay more attention on its cost, and make sure the costs of the bank are utilized in the rational way. At the same time, the bank should decrease its operating expenses to keep its efficiency. The bank’s liquidity are also quite important for bank’s ROE performance. A bank should improve its liquidity through absorbing more deposits and limiting the loan outstanding.
The study also provides valuable results and useful information to individual investors. It provides a special method and framework for investors to analyses bank performance. Investors can make a decision on whether to invest more in some banks or shift funds to invest in other banks which have a better performance. From the result of this study, the individual investors should pay more attention on the costs to income ratio, operating expenses to
assets ratios ratio. The wealth of a bank’s management ability and liquidity affect the performance of the bank significantly, especially on its return to investors.
- Recommendation for future
studies
Further studies could use different ratios to represent each factor of CAMEL, for example, the shareholder’s equity to assets ratio could represent the capital adequacy instead of the risk-weighted capital adequacy ratio. Also, more ratios could be included to represent each factor of CAMEL.
Further studies also could extend the period of data observed and also change the frequency of data used, and this might offer a different result. The frequency of data used in this study was semi-annual.Further studies could increase it to monthly or decrease it to yearly depending on the situation.
Lastly, further studies could focus on different banking industries in the world, not only on China’s banking industry. The indicator of bank performance also can change from ROA and ROE to other indicators such as Tobin’s Q and economic value added (EVA) to represent the bank performance from a different angle.
References
Abreu, M. & Mendes V. (2002). Commercial bank interest margins and
profitability: evidence from
E.U.Countries, University of Porto
Al-Hawary, S. I. S. (2011). The effect of banks governance on banking performance of the Jordanian commercial banks: Tobin’s q model "an
applied study". International Research
Journal of Finance and Economics,
(71), 34-47.
Alkhatib, A. (2012). Financial performance of Palestinian commercial
banks. International Journal of Business
and Social Science, 3(3), 175-184.
Athanasoglou, P. P., &Brissimis, S. N. & Delis, M. D. (2005). Bank-Specific Industry-Specific and Macroeconomic
Determinant of Bank Profitability, Bank
of Greece Working Papers, No.25.
Atikogllari, M. (2009). An analysis of the northern Cyprus banking sector in the post – 2001 period through the
camels approach. International
Research Journal of Finance and Economics, (32) , 212-230.
Bakar, N. M. A., & Tahir, I. M. (2009). Applying multiple linear regression and neural network to predict bank
performance. International Business
Research, 2(5), 176-183.
Boyd, J. H., &Runkle, D. E. (1993). Size and Performance of Banking Firms.
Journal of Monetary Economics,
31(1993), 13-26.
China Banking Regulatory Commission.
(2012). 2011 China Banking Regulatory
Commission Annual Report. BeiJing,
China: China Banking Regulatory Commission.
Elyor, S. (2009). Factors affecting the
performance of foreign banks in Malaysia. Master’s degree Thesis,
(801516), Universiti Utara Malaysia.
EUROPEAN Central Bank .
(2010). Beyond roe – how to measure bank performance. Frankfurt am Main: EUROPEAN Central Bank.
Golin, J. L. (2001). The bank credit
analysis handbook: A guide for analysts, bankers and investors. Singapore: J.
Wiley.
Heffernan, S. A., & Fu, M. (2008). The Determinants of Bank Performance in
China. Working paper,
(WP-EMG-03-2008), Cass Business School, London.
Huang, W. (2010). Banking sector reforms and commercial bank
performance in China. Working paper,
(G21), University of Nottingham.
Jha, S., &Hui, X. (2012). A comparison of financial performance of commercial
banks: A case study of Nepal. African
Journal of Business Management, 6(25),
7601-7611.
Khrawish, H. A. (2011). Determinants of commercial banks performance:
Evidence from Jordan. International
Research Journal of Finance and Economics, (81), 148-159.
Khrawish, H. A., Siam, W. Z., &Khrawish, A. H. (2011). Determinants
of islamic bank profitability: Evidence
from Jordan. Middle Eastern Finance and Economics, (13), 43-57.
Kosmidou, K. (2008). The determinants of banks’ profits in Greece during the period of EU Financial integration.
Journal of Managerial Finance, 34(3),
146-159.
Naceur, S.B. (2003). The Determinants of the Tunisian Banking Industry Profitability: Panel Evidence. Working Paper retrieved on April 8, 2012, http://www.academicdb.com/risk_mana gement_case_study_1856/.
Olweny, T., &Shipho, T. M. (2011). Effects of banking sectoral factors on the profitability of commercial banks in
Kenya. Economics and Finance Review,
1(5), 01-30.
Siddiqui, M. A., &Shoaib, A. (2011). Measuring performance through capital structure: Evidence from banking sector
of Pakistan. African Journal of Business
Management, 5(5), 1871-1879.
Stewart, G.B. (1991). The Quest for
Value. New York: Harper Business.
Stern, J.M., & Stewart, G.B., & Chew, D. H. (1995).The EVA Financial
Management System, Journal of Applied
Corporate Finance, 8(2), 32-46.
Staikouras, C., & Wood, G. (2003) The Determinants Of Bank Profitability In
Europe. Paper presented at the
European Applied Business Research Conference, Venice, Italy, 9-13 June.
Zhong, Y. (2007). Bank Management. GuangZhou: South China University of Technology Press.
Annex One
List of research hypothesis:
H1a: There is a significant relationship between Return on Asset and shareholders’
risk-weighted capital adequacy ratio (β1 ≠ 0).
H2a: There is a significant relationship between Return on Asset and NPL to total assets ratio
(β2 ≠ 0).
H3a: There is a significant relationship between Return on Asset and NPL to total loans ratio (β3 ≠ 0).
H4a: There is a significant relationship between Return on Asset and loans to total assets
ratio (β4 ≠ 0).
H5a: There is a significant relationship between Return on Asset and cost to income ratio (β
5≠ 0).
H6a: There is a significant relationship between Return on Asset and operating expenses to
assets ratio (β6 ≠ 0).
H7a: There is a significant relationship between Return on Asset and NIM ratio (β7 ≠ 0).
H8a: There is a significant relationship between Return on Asset and loans to deposit ratio (
β8 ≠ 0).
H9a: There is a significant relationship between Return on Equity and shareholders’
risk-weighted capital adequacy ratio (α1 ≠ 0).
H10a: There is a significant relationship between Return on Equity and NPL to total assets
ratio (α2 ≠ 0).
H11a: There is a significant relationship between Return on Equity and NPL to total loans
ratio (α3 ≠ 0).
H12a: There is a significant relationship between Return on Equity and loans to total assets
ratio (α4 ≠ 0).
H13a: There is a significant relationship between Return on Equity and cost to income ratio (
α5≠ 0).
H14a: There is a significant relationship between Return on Equity and operating expenses to
assets ratio (α6 ≠ 0).
H15a: There is a significant relationship between Return on Equity and NIM ratio (α7 ≠ 0).
H16a: There is a significant relationship between Return on Equity and loans to deposit ratio
Annex two
List of abbreviations: NIM = Net Interest Margin EVA = Economic ValueAdded
CAR = Risk-weighted Capital Adequacy Ratio NPL = No-performing Loans
LTD = Loans to Deposits ratio
GDPGR = Annual Gross Domestic Product Growth Ratio CPI = Consumer Price index
ROA = Return on Assets ROE = Return on Equity
NPLTTA = NPL to Total Assets Ratio NPLTTL = NPL to Total Loans Ratio TLTTA = Loans to Total Assets Ratio CTI = Costs to Income Ratio