1
A Network Access Control Mechanism Based on
Behavior Profiles
Vanessa Frias-Martinez
∗[1], Joseph Sherrick
†, Salvatore J. Stolfo
†, Angelos D. Keromytis
† ∗Telefonica Research
Madrid,Spain
[email protected]
†Columbia University
New York, USA
js2778,sal,[email protected]
Abstract—Current Network Access Control (NAC) technolo-gies manage the access of new devices into a network to prevent rogue devices from attacking network hosts or services. Typically, new devices are checked against a set of manually defined policies (rules) before being granted access by the NAC enforcer. The main difficulty with this approach lies in the generation and update of new policies manually as time elapses and all devices have to reestablish their access rights. The BB-NAC mechanism was the first to introduce a novel Behavior-Based Network Access Control architecture based on behavior profiles and not rules, where behavior-based access control policies were automatically generated. As originally presented, BB-NAC relied on manually pre-determined clusters of behavior which required human intervention and prevented the fully automation of the mechanism. In this paper, we present an enhanced BB-NAC mechanism that fully automatizes the creation of clusters of behavior. The access control is enhanced with the incorporation of automatic behavior clustering, which improves the intrusion detection capabilities by allowing for a more fine-grained def-inition of normal behavior. Apart from the lack of automatic clustering, the original BB-NAC overlooked the evolution of the mechanism as new behavior profiles were computed over time. As part of our enhancements, we also present an incremental-learning algorithm that automatically updates the behavior-based access control policies. We show that the algorithm is resilient to compromised or fabricated profiles trying to manipulate the policies. We provide extensive experiments with real user profiles computed with their network flows processed from Cisco NetFlow logs captured at our host institution. Our results show that behavior-based access control policies enhance conventional NAC technologies. Specifically, we achieve true rejection rates of 95% for anomalous user profiles separated by one standard deviation from the normal user network behavior. In addition, we also show that the enhanced mechanism can differentiate between normal changes in the behavior profiles (concept drift) and attacks.
I. INTRODUCTION
Network Access Control (NAC) technologies are responsi-ble for regulating the access of devices to a network. Their main aim is to prevent the intrusion of rogue devices that could potentially attack other devices and services in the network. In most NAC architectures, a NAC enforcer located at the edge of the network evaluates devices trying to enter the network (wired, wirelessly or VPN) before access is granted. This preventive phase, called the pre-connect phase,
[1]Work performed while being a PhD student at Columbia University.
typically checks the status of the antivirus software (AV) of the new device, determines whether software patches are up-to-date, or it inspects the types of applications executed by the device. Access is granted only if the device complies with all the manually pre-determined policies (rules). Otherwise, the device is quarantined or expelled. ConSentry’s agentless
LANShield, Nevis LANenforcer, and Cisco’s NAC Appliance
are examples of such technologies. Unfortunately, defining and updating new policies manually becomes very demanding and highly inefficient as time elapses and all devices have to reestablish their access rights.
Previous work introduced a network access control archi-tecture, BB-NAC, in which behavior profiles of network hosts, modeled by an Anomaly Detection Sensor (AD), were used to automatically compute behavior-based access control policies [1]. These behavior profiles characterized the typical commu-nications of network devices i.e., the traffic payload observed or specific volumetric measurements of the traffic such as average number of packets. In BB-NAC, the behavior profiles of the network members were grouped into two manually pre-determined clusters of behavior: clients and servers. A device attempting to access the network (newcomer) was required to present its behavior profile and a self declaration of its nature (client or server) to the NAC enforcer. To reach an access control decision, the NAC enforcer then proceeded to conduct a voting process among behavior profiles within the cluster of behavior of the same nature (client or server). If a majority agreed that the behavior profile of the newcomer was normal, the device was granted access into the network. Otherwise, the device was deemed anomalous and rejected from entering the network. Once a device had been accepted into the network, its real-time behavior was continuously checked against the behavior profiles within its respective cluster of behavior. Devices that drifted in behavior were considered compromised and placed in quarantine [2].
While the original BB-NAC mechanism offered a first approximation to the automatic creation of access control policies, it suffered from two significant drawbacks. First, the clusters of behavior had to be manually specified, which required human intervention in the mechanism. Second,
BB-NAC focused mainly on the initial creation of access
new behavior profiles were computed over time. This paper presents novel solutions to these problems. In our enhanced mechanism, the NAC enforcer uses an automatic clustering method to group similar behavior profiles into clusters of
behavior. These clusters of behavior define the
behavior-based access control policies. Automatic clustering enables the identification of common behaviors among hosts (and their users) as well as the generation of behavior-based access control policies without human intervention. Moreover, the inclusion of clustering in the access control improves on the intrusion detection capabilities of BB-NAC by allowing for a more fine-grained definition of normal behavior.
Additionally, we incorporate an automatic update of behavior-based access control policies to account for network members that may recompute their behavior profiles over time. To accomplish this, it is imperative to understand the nature of the changes in the behavior profiles prior to the update. Therefore, we have designed and implemented an incremental-learning algorithm that differentiates between new behavior profiles that derive from existing clusters of behavior (concept
drift) and fabricated profiles attempting to maliciously modify
the access control policies (attacks). Finally, we evaluate the enhancements to the original BB-NAC mechanism using extensive real network flows generated from Cisco NetFlow logs with a large amount of users and a wide diversity of behaviors.
In terms of deployment, the mechanism presented here is to be installed and executed at the NAC enforcer to guarantee appropriate access control. We further assume an agent-based
NAC architecture where each of the members of the network
has an AD sensor (similar to a COTS AV scanner) that computes its local behavior profile. Every time a new profile is computed by a host or device, it is communicated to the NAC enforcer. A fully distributed version of our mechanism for Mobile Ad-hoc Networks (MANETs) is presented in [3]. The latter provides a light-weight adaptation that fully distributes the access control decisions among the MANET devices using a threshold cryptographic layer.
The main contributions of the enhanced behavior-based network access control mechanism are the following:
• The application of a clustering method to identify com-mon behaviors acom-mong network members as well as to automatically generate behavior-based access control policies without human intervention. Clustering enhances the access control by providing robust intrusion detection capabilities.
• The incorporation of an incremental-learning algorithm that manages the automatic update of behavior-based access control policies by differentiating between new profiles that derive from existing clusters of behavior (concept drift) and malicious profiles (attacks). This makes the mechanism resilient to attackers attempting to modify the behavior-based access control policies. • Efficient scalability to a large amount of users and a wide
diversity of behaviors.
The organization of the rest of the paper is as follows. Section II presents the behavior-based mechanism in greater detail and describes each of its phases: clustering,
boot-strap and access control. Section III details the incremental-learning algorithm. Possible attack scenarios and responses are discussed in Section IV. Section V presents our validation experiments while section VI describes related work. Section VII presents the conclusions and future work.
II. DESCRIPTION OF THENETWORKACCESSCONTROL
MECHANISM BASED ONBEHAVIORPROFILES
The network access control mechanism consists of three phases: clustering, bootstrap and access control. Initially, each network member communicates its behavior profile to the NAC enforcer. We assume that all network members have
normal behavior profiles and that communications between
the members and the NAC enforcer are secured in such a way that profiles cannot be manipulated during the exchange. Throughout, we refer to profiles that have been modeled with clean datasets that do not contain any type of attack as normal behavior profiles. Once the NAC enforcer has received all the initial profiles, it performs a clustering phase that builds clusters of common behavior among its members. Clusters are computed on a per-port basis e.g., port 22 for service SSH or port 80 for service HTTP. As a result, the NAC enforcer keeps independent clusters of behavior for each port whose security needs to be enforced.
Next, the bootstrap phase is responsible for the determi-nation of thresholds for each cluster member. Each threshold measures the largest distance between a host and each of the other cluster members. These thresholds are then used in the access control phase as a measure of similarity between pro-files. The bootstrap phase is performed whenever the behavior profile of a member changes.
Finally, every time a new device attempts to enter the network, it presents its behavior profile to the NAC enforcer that performs the access control phase. During access control, the NAC enforcer conducts a voting process in the cluster that is closest to the newcomer’s presented profile. Each profile emits an acceptance or rejection individual vote based on its threshold (derived from the bootstrap phase). A majority vote determines the final decision. In the case where multiple ports are being considered, this phase is performed separately for each individual port. The device is accepted only when all ports agree on a decision. Below we detail each phase of the mechanism.
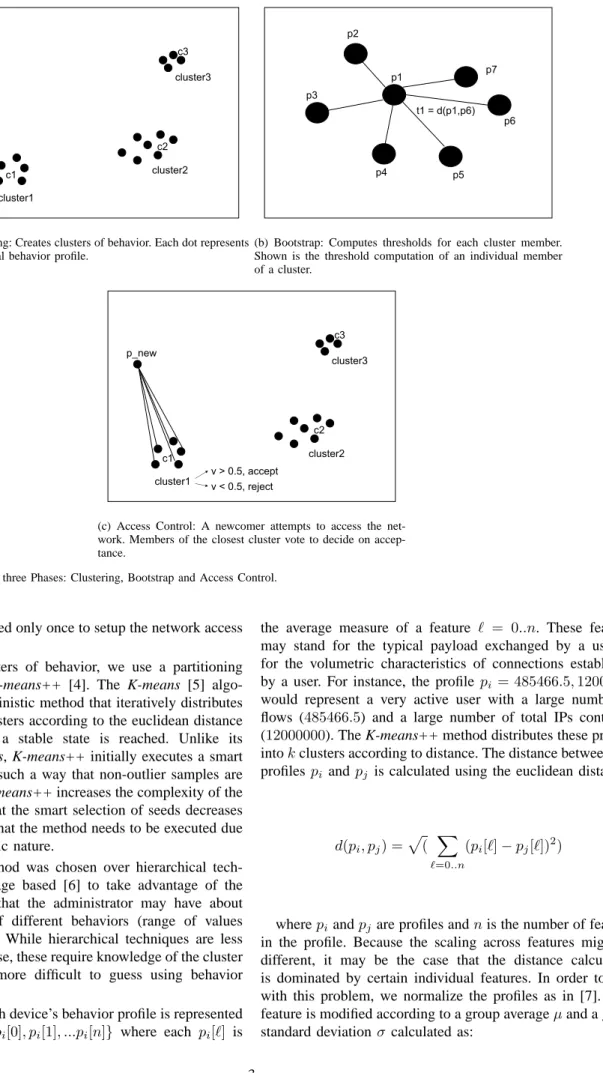
A. Phase I: Clustering
Devices on a network may span a range of different types of behaviors. For port 80, for example, some webservers may experience a large number of connections from different IPs and a large number of flows, while others observe a smaller number of connections from different IPs and a smaller number of flows. The goal of clustering is to create clusters of common behavior among the network members that will be used to detect anomalous profiles during access control (Figure 1(a)). The clustering is performed at the NAC enforcer using the behavior profiles communicated by the initial members of the network. Although this phase may be computationally
cluster1 cluster2 cluster3 c1 c3 c2
(a) Clustering: Creates clusters of behavior. Each dot represents an individual behavior profile.
t1 = d(p1,p6) p2 p1 p3 p4 p5 p6 p7
(b) Bootstrap: Computes thresholds for each cluster member. Shown is the threshold computation of an individual member of a cluster. cluster1 cluster2 cluster3 c1 c3 c2 p_new v > 0.5, accept v < 0.5, reject
(c) Access Control: A newcomer attempts to access the net-work. Members of the closest cluster vote to decide on accep-tance.
Fig. 1. Schematics of the three Phases: Clustering, Bootstrap and Access Control.
expensive, it is executed only once to setup the network access control.
To create the clusters of behavior, we use a partitioning clustering method, K-means++ [4]. The K-means [5] algo-rithm is a non-deterministic method that iteratively distributes the profiles into k clusters according to the euclidean distance between them until a stable state is reached. Unlike its plain version K-means, K-means++ initially executes a smart selection of seeds in such a way that non-outlier samples are favored. Although K-means++ increases the complexity of the execution, we find that the smart selection of seeds decreases the number of times that the method needs to be executed due to its non-deterministic nature.
A partitioning method was chosen over hierarchical tech-niques such as Linkage based [6] to take advantage of the
a priori knowledge that the administrator may have about
the initial number of different behaviors (range of values of k) in the network. While hierarchical techniques are less computationally intense, these require knowledge of the cluster width which is far more difficult to guess using behavior profiles.
We assume that each device’s behavior profile is represented by a vector pi = {pi[0], pi[1], ...pi[n]} where each pi[ℓ] is
the average measure of a feature ℓ = 0..n. These features may stand for the typical payload exchanged by a user or for the volumetric characteristics of connections established by a user. For instance, the profile pi = 485466.5,12000000
would represent a very active user with a large number of flows (485466.5) and a large number of total IPs contacted (12000000). The K-means++ method distributes these profiles intokclusters according to distance. The distance between two profilespi andpj is calculated using the euclidean distance:
d(pi, pj) =p( X ℓ=0..n
(pi[ℓ]−pj[ℓ])2
) (1)
wherepiandpjare profiles andnis the number of features in the profile. Because the scaling across features might be different, it may be the case that the distance calculation is dominated by certain individual features. In order to deal with this problem, we normalize the profiles as in [7]. Each feature is modified according to a group averageµand a group standard deviationσ calculated as:
µ[ℓ] = 1 m X i=1..m pi[ℓ] (2) σ[ℓ] =p( 1 m−1 X i=1..m (pi[ℓ]−µ[ℓ])2 ) (3)
where m is the total number of profiles to be clustered. Each feature ℓin the profilepi is then normalized as follows:
p′ i[ℓ] =
pi[ℓ]−µ[ℓ]
σ[ℓ] (4)
where p′i corresponds to the normalized profile.
In order to select a suitable value for k, K-means++ clus-tering is repeated multiple times for each input k to account for its non-deterministic nature. For each clustering result, we perform a cross-validation test that ranks the quality of the cluster distribution. The highest ranked cluster distribution is chosen. Details about cross-validation and cluster selection are covered in Section V. In an actual application of the system, the clustering method is performed on a per-port basis i.e., clusters of behavior are identified for each port (service) being secured.
B. Phase II: Bootstrap
Once the clusters of behavior have been computed, the NAC enforcer calculates the threshold for each profile. The threshold measures the maximum distance between a profile and each of the other profiles in its cluster as illustrated by Figure 1(b). These thresholds are later used to determine whether a newcomer’s profile is deemed normal or anomalous during the access control phase. For each profile pi, the threshold t is calculated as:
tpi=maxj=1..q(d(pi, pj)) (5) where qis the number of profilespj in the cluster wherepiis a member anddis the distance between the profiles computed as in Equation 1.
C. Phase III: Access Control
After completing clustering and bootstrap, the mechanism is ready to perform the access control of new devices. Upon arrival to the network, a newcomer presents its profile to the NAC enforcer. The NAC enforcer first normalizes the profile as defined in Equation 4. It then proceeds to calculate which cluster of behavior is closest to the newcomer’s profile pnew as follows:
closest cluster=mini=0..k(d(c[i], pnew)) (6) where k is the number of clusters and c[i] is the centroid of each cluster i. The centroid c[i]for cluster iis calculated as,
c[i] = (c0, c1, ..., cn) cn= 1 q q X i=1 pi[n]
wherecn represents then−thcomponent of the centroid and qis the total number of behavior profiles in cluster i.
The cluster chosen as the closest topnewis then responsible for its rejection or acceptance to the network. The NAC enforcer conducts a voting process among the profiles of the members of the closest cluster, where members vote for or against acceptance based on their thresholds calculated during the bootstrap phase (Figure 1(c)). The outcome of the voting process is decided either by a simple majority or a weighted majority. In simple majority, all votes are weighted equally and access is granted to the newcomer when at least 50% of the members agree on a decision. In short,
v=1 q X i=1..q vi (7) vi= 0 if d(pi, pnew)> ti (8) vi= 1 if d(pi, pnew)≤ti (9) where qis the number of members of the closest cluster and ti is the threshold of profilepi as calculated during bootstrap. If the final vote v exceeds 50% i.e., v ≥0.5, the newcomer is accepted into the network. In weighted majority, the vote of a profile is weighted based on its distance to the profile of the newcomer. In other words, the weight of the vote of the cluster member farthest away from the newcomer’s profile is set to 0, whereas the weight of the vote of the closest profile to the newcomer is set to 1. All other weights are linearly distributed among the remaining members of the cluster. The weighted vote wi for deviceiis computed as follows,
wi = dmax−di dmax−dmin ×vi
where dmin is the distance of the closest profile to the newcomer, dmax is the distance of the farthest profile to the newcomer anddiis the distance of profileito the newcomer. The final vote is computed asw= 1
q
P
i=1..qwi.
Once a newcomer is accepted into the network, its profile is saved as a member of its closest cluster. Newly accepted devices are given access to resources but are banned from participating in the access control mechanism. This prevents temporal members of the network from modifying the access control policies. As a result, only the initial members are responsible for defining the network access control policies. In order for a newcomer to be able to participate in the access control mechanism, the clustering and bootstrap would have to be recomputed with the newcomer as an initial member of the network. If a newcomer is rejected during the access control phase, it can retry to gain access up to three times. After that, further requests are ignored in order to avoid brute force attempts to gain access or DoS attacks attempting to collapse the NAC enforcer with requests.
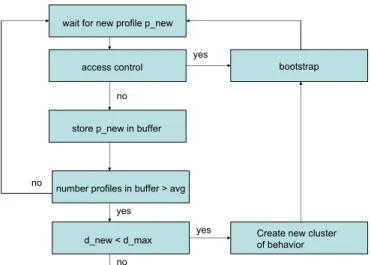
III. INCREMENTAL-LEARNINGALGORITHM
Over time, the initial members of the network will com-pute new behavior profiles. As a result, the access control mechanism must be able to automatically update its policies
store p_new in buffer
bootstrap yes
no
number profiles in buffer > avg no yes d_new < d_max yes no ATTACK ALERT wait for new profile p_new
Create new cluster of behavior access control
Fig. 2. Basic Scheme of the Incremental-Learning Algorithm.
accordingly. To successfully adapt to profile changes, the mechanism needs to differentiate between normal changes in behavior (concept drift) and attacks launched by hosts attempting to manipulate the access control by lying about their new profiles.
In order to cope with attacks while allowing for concept
drift, we present an incremental-learning algorithm (Figure 2)
that arises from an approach first introduced by Spinosa et al. ([8]). Every time an initial member computes a new profile, it communicates it to the NAC enforcer. After receiving the new profile, the NAC enforcer executes the incremental-learning algorithm. The algorithm initially performs the access control phase to determine whether the new profile is accepted by one of the clusters of behavior within the network. In case of acceptance, the initial member has simply changed from one accepted behavior to another. As a result, the NAC enforcer updates the cluster members and executes the bootstrap phase to recompute the thresholds.
If the new profile fails to be accepted by one of the clusters of behavior, the algorithm is faced with two alternatives. The new profile might constitute a new behavior (concept drift) or alternatively it may represent an attack coming from a host that is lying about its own profile. In order to differentiate between these alternatives, the algorithm keeps a buffer of profiles that have failed to be classified into one of the clusters of behavior. Once the number of different profiles in this buffer reaches the average number of members among the clusters of behavioravg, the algorithm attempts to identify the nature of this candidate cluster. The need to have a critical number of profiles in the buffer is justified because in our approach only clusters (rather than single behavior profiles) define behaviors. For completeness, we note that devices with profiles in the buffer must wait until the nature of their new behavior profile is determined.
In order to identify the nature of the candidate cluster in the buffer, we rely on the existing clusters of behavior. The union of the boundaries of all clusters of behavior in the distribution defines a decision boundary between concept drift
candidate cluster cluster1 cluster2 cluster3 C c1 c4 c3 c2 d_new < d_max? decision boundary
Fig. 3. Identification of the nature of a candidate cluster.
and attack (see Figure 3). New candidate clusters that are within the decision boundary are interpreted as concept drift from existing clusters of behavior whereas candidate clusters outside the decision boundary are considered attacks.
In practical terms, the algorithm first computes the centroid of each cluster of behaviorci (see Figure 3). Then, a global
centroid C is computed as the average of all centroids ci. Next, the algorithm calculates the maximum distance dmax from each cluster’s centroid ci to the global centroid C. This distance represents the decision boundary for the cluster distribution. The algorithm then computes the centroid of the
candidate cluster in the buffercnew, and estimates its distance dnew to the global centroidC. Ifdnew is smaller thandmax, the candidate cluster is accepted as a new behavior or concept
drift. Otherwise, if dnew is larger than dmax, the candidate
cluster is deemed anomalous and an attack alert is raised.
In the case that a new profile is generated by a device that is not an initial member of the network, the algorithm performs the access control phase. If none of the clusters of behavior accept the new profile, the device is placed in quarantine to understand the origin of its anomalous behavior. In general, devices that are not initial members of the network cannot create new clusters of behavior to modify the access control policies.
As presented, the algorithm may only handle the identifi-cation of one candidate cluster at a time. One can think of a situation where initial members generate multiple candidate
clusters. In such a case, the algorithm can be expanded by
first clustering the profiles in the buffer using the K-means++ clustering method and then proceeding to identify whether each candidate cluster constitutes concept drift or an attack.
IV. TYPES OFATTACKS
In this section we discuss potential attacks to a network access control mechanism based on behavior profiles. We envision that the main line of attacks will focus on modifying the access control policies that determine which devices are accepted into the network. Since the access control policies are updated by an incremental-learning algorithm, attackers will concentrate on crafting manipulated profiles with the intent to alter the clusters of behavior that define the access control
(a) Diversified Attack. (b) Unified Attack.
Fig. 4. Types of Threshold Attacks. Each dot represents an individual behavior profile.
policies. Attacks that involve devices with granted access sending anomalous traffic to compromise other devices are discussed in [1]. A description of two types of attacks follows.
A. Collusion Attack
Compromised hosts may try to lie to the NAC enforcer about their new profiles in order to create a new candidate
cluster that is greatly separated from the existing clusters
of behavior. Such a cluster would alter the access control by allowing easier access to anomalous profiles. Figure 3 illustrates this type of attack that we refer to as collusion
attack. In order for an attack of this type to be successful, the
attacker would need to compromise at least as many devices as the average number of members among the clusters of behavior to be considered as a candidate cluster. Moreover, this candidate cluster must lie at a distance dnew from the global centroid C that is smaller than dmax (see Section III). These requirements are not easy to achieve and demand internal knowledge of the cluster distribution. In Section V, we show that even with full disclosure of the clusters of behavior, an attacker is tightly limited in the new clusters that can potentially be created.
B. Threshold Attack
One or multiple users within a cluster of behavior may try to decrease or increase the thresholds computed during bootstrap. We call these attacks threshold attacks given that the attacker is trying to modify the dimensions of its own cluster. We consider two alternatives. First, one or multiple attackers modify their own profiles in an attempt to disperse the cluster in different directions. We will refer to this alternative as diversified attack (see Figure 4(a)). In the second scenario, one or multiple attackers agree on a unique modified profile to stretch their cluster in a single direction. Figure 4(b) illustrates this scenario that we refer to as unified attack. In Section V, we show that the bootstrap phase limits this type of attack as long as the number of normal users in the cluster outnumbers the number of attackers.
V. VALIDATIONEXPERIMENTS
To evaluate the mechanism, we present experiments that aim to simulate a NAC environment and test the performance of each of the phases as well as the incremental-learning algorithm. In order to simulate the NAC environment, we need real network traffic for a large amount of users with a
diversity of behaviors. For that purpose, we gathered Cisco NetFlow logs from a router at out host institution for a period of two weeks (around 95Gb containing millions of IPs). From all the IPs collected during this period, we randomly selected a sample of 300 internal users (with IPs from our host institution) and proceeded to process their network flows from the logs. Throughout, we assume that each IP represents a unique user. A flow corresponds to a unidirectional sequence of packets between a given source and destination endpoints [9]. We strictly focused on flows from port 80 where traffic was more abundant than in other ports.
In order to compute behavior profiles, we designed an AD sensor that models user behavior based on the network flows each user generates. Each behavior profile was characterized by a set of seven features that include the total number of flows, average flow size, average flow duration, total number of packets contained in all flows, average number of packets per flow, total number of unique IP addresses contained in all flows, and average packet size. Thus, a user profile was defined by a vector pi = {f1, f2, ..., f7}
where fi represents the average value for each individual feature modeled over the training period. For example px = {529.4,1.8,50.5,105.7,9.4,973.1,11803.2} and py =
{485466.5,24.9,159.8,3954.2,3473.0,12000000,5585.9}
represent two of the profiles obtained from our sample. Here we can directly see the contrast in behavior profiles between a very active user py (with a large total number of flows, a large number of unique IPs and large total number of packets) and a less active userpx. The variation of the features among the sample allows us to capture the diversity of behaviors in a network.
Using the sensor, we built daily profiles for each of the 300 users in the sample for two separate periods with a duration of one week each. This resulted in a total of 600 behavior profiles: 300 profiles for week-1 and 300 profiles from week-2. Daily profiles computed average daily values for each feature during the training period of the profiles (one week). In our computations, each user profile contained 10–13498 flows per week with 2–128 packets per flow. The average duration of each flow was approximately 46.2 secs.
Armed with the behavior profiles, we proceeded to set up a simulated NAC environment in which a fraction of the profiles constituted the initial members of the network, while the remaining profiles simulated users trying to gain access into the network. Specifically, the 600 behavior profiles were divided into three sets of randomly selected profiles: the
training set (300 profiles from week-1) to be used to compute
clusters of behavior, the cross-validation set (75 profiles from
week-2) to determine the appropriate number of clusters k,
and the testing set (remaining 225 profiles from week-2) to perform access control experiments. We further assumed that the profiles in the training set, the cross-validation set and the testing set represent normal behavior profiles and thus constitute ground truth. It is important to note that although the experiments presented here are specific to one dataset, the results can be generalized to other network environments given the sheer number of profiles and diversity of our dataset. Next, we present experimental evaluation of each phase of the
mechanism and the incremental-learning algorithm using these three sets of profiles.
A. Clustering and Cross-Validation
In order to show how the clustering phase would proceed, we used the K-means++ clustering method (see Section II-A) to find clusters of behavior in the the training set (300
normal profiles from week-1). We tested values of k ranging
from 1% to 20% of the total number of profiles, since these produced the best clustering results. For each k, we repeated the clustering method several times to account for the non-deterministic nature of K-means++. This resulted in multiple cluster distributions for each value of k.
We then ran cross-validation tests to determine the best cluster distribution i.e., the best value of k. Each value of
k was ranked based on its access control performance. The
performance of the access control was measured using two indicators: the false rejection rate (FR) and the true rejection rate (TR). TR measures the number of anomalous users that were detected as such by the access control, and FR measures the number of normal users deemed as such by the access control. The final ranking index was computed as r= (1−F R) +T R, and the clustering distribution with the best index was selected.
In order to compute the FR rate for each cluster distribution, we measured its access control performance using the profiles from the validation set. As stated earlier, the
cross-validation set consisted of 75 normal profiles randomly chosen
from week-2. To compute the TR of each cluster distribution, anomalous profiles were created by modifying one or multiple features by one, two and three standard deviations away from the centroid of each individual cluster in the cluster distribution. These profiles were used to simulate users trying to maliciously stretch the dimensions of the clusters in the cluster distribution.
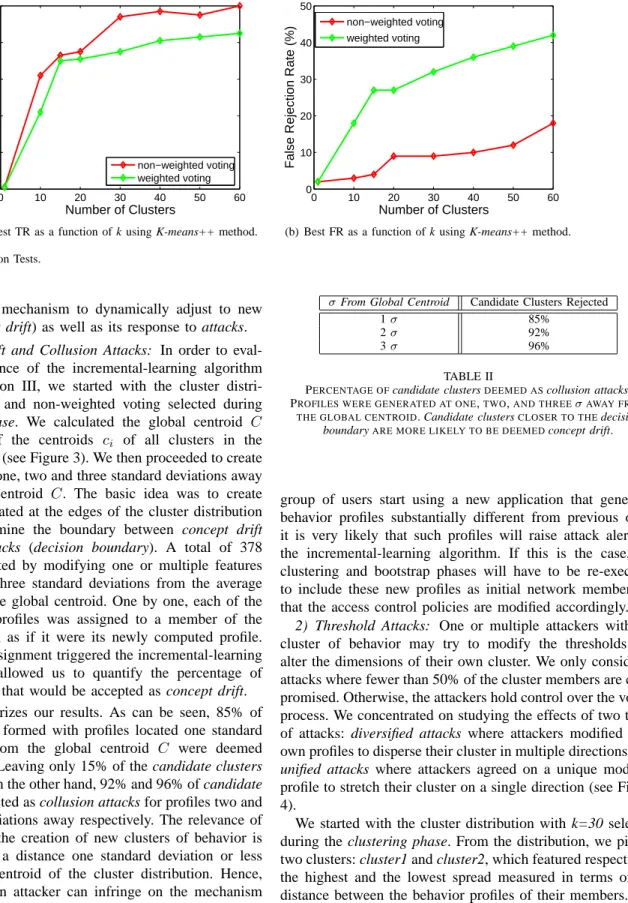
Figure 5(a) and Figure 5(b) show the best TR and FR rates for different values of k assuming weighted and non-weighted voting respectively. We discovered that a value of
k=40 and non-weighted voting produced the highest ranking
index r = (1−0.1) + 0.97. Smaller values of k tended to produce small TR rates due to the fact that outlier profiles in each cluster created a larger spread among the cluster members. On the other hand, larger values of k showed very poor FR rates because the cluster distribution became excessively fine-grained. Non-weighted voting outperformed weighted voting possibly indicating that behavior profiles that are outliers within their own cluster tend to dominate the voting process over the rest of the profiles. In order to test whether the granularity of the training period affects the results directly, we repeated similar experiments using hourly profiles. We find that the results obtained with profiles trained on an hourly basis do not differ significantly from their daily counterparts.
For our particular dataset, the cluster distribution with k=40 and non-weighted voting was the best representative of the trade-off between FR and TR. Therefore, it was selected for the validation of the subsequent phases. It is important to
σFrom Individual Clusters True Rejection Rate
1σ 95%
2σ 98%
3σ 100%
TABLE I
PERFORMANCE OF THEACCESSCONTROLPHASE. ANOMALOUS PROFILES WERE GENERATED AT ONE,TWO,AND THREEσAWAY FROM
THE INDIVIDUAL CLUSTER CENTROIDS. THE MORE ANOMALOUS THE PROFILES ARE,THE EASIER IT IS FOR THE CLUSTER DISTRIBUTION TO
DETECT THEM.
note that these values are only valid for the set of profiles presented in this paper and it will obviously vary according to the particular network environment.
B. Bootstrap and Access Control
Once clusters of behavior had been generated and a value of
k=40, together with non-weighted voting, chosen as the best
cluster distribution, the bootstrap phase computed thresholds for each cluster member (Section II-B). At this point, we proceeded to measure the performance of the access control
phase by testing whether or not normal and anomalous profiles
could gain access into the network. For this purpose, we used the testing set containing 225 normal profiles from week-2 and the set of anomalous profiles generated by modyfing one or multiple features by one, two and three standard deviations away from the centroid of each individual cluster in the cluster distribution with k=40. These profiles were assumed to be new users trying to gain access into the network. Therefore, each profile was paired with its closest cluster in the cluster distribution which then conducted a vote among its members to decide on the access of the profile (see Section II-C).
The performance of the access control phase in terms of TR is shown in Table I. Our experiments demonstrated that 95% or more of anomalous profiles can be detected successfully with a FR rate of 10%. The reason a 5% of the anomalous profiles went undetected lies in the method used to generate them. Anomalous profiles were generated one or more standard deviations away from the centroid of each individual cluster. This did not necessarily create profiles at distances larger than the access control threshold ti for all cluster members. In fact, 5% of the anomalous profiles were at distances smaller than ti for at least 50% of the cluster members. As a result, these anomalous profiles were accepted into the network. The TR increased up to 100% for anomalous profiles that were three standard deviations away from individual clusters. These results demonstrate that the
access control phase is able to detect a large fraction of
anomalous profiles while still allowing normal profiles to gain access into the network. Moreover, these experiments show that an access control mechanism based on behavior profiles can be successfully implemented in a real network.
C. Incremental-Learning Algorithm
Thus far we have presented a validation of the mechanism without considering temporal evolution. Next, we evaluate
0 10 20 30 40 50 60 0 20 40 60 80 100 Number of Clusters
True Rejection Rate (%)
Daily Profiles
non−weighted voting weighted voting
(a) Best TR as a function of k using K-means++ method.
0 10 20 30 40 50 60 0 10 20 30 40 50 Number of Clusters
False Rejection Rate (%)
Daily Profiles
non−weighted voting weighted voting
(b) Best FR as a function of k using K-means++ method. Fig. 5. Cross-validation Tests.
the ability of the mechanism to dynamically adjust to new behaviors (concept drift) as well as its response to attacks.
1) Concept Drift and Collusion Attacks: In order to
eval-uate the performance of the incremental-learning algorithm described in Section III, we started with the cluster distri-bution with k=40 and non-weighted voting selected during the clustering phase. We calculated the global centroid C as the average of the centroids ci of all clusters in the cluster distribution (see Figure 3). We then proceeded to create profiles that were one, two and three standard deviations away from the global centroid C. The basic idea was to create outlier profiles located at the edges of the cluster distribution in order to determine the boundary between concept drift and collusion attacks (decision boundary). A total of 378 profiles were created by modifying one or multiple features by one, two and three standard deviations from the average values stored in the global centroid. One by one, each of the newly generated profiles was assigned to a member of the cluster distribution as if it were its newly computed profile. Each individual assignment triggered the incremental-learning algorithm which allowed us to quantify the percentage of
candidate clusters that would be accepted as concept drift.
Table II summarizes our results. As can be seen, 85% of
candidate clusters formed with profiles located one standard
deviation away from the global centroid C were deemed
collusion attacks. Leaving only 15% of the candidate clusters
as concept drift. On the other hand, 92% and 96% of candidate
clusters were detected as collusion attacks for profiles two and
three standard deviations away respectively. The relevance of this result is that the creation of new clusters of behavior is largely limited to a distance one standard deviation or less from the global centroid of the cluster distribution. Hence, the damage that an attacker can infringe on the mechanism is limited as well. Although this may be seen as a limitation to the incorporation of new clusters of behavior, it protects the mechanism from attacks while still leaving some room for growth.
On certain occasions there might be a need to force a new cluster of behavior that is very distant from the global centroid into the cluster distribution. For example, when a
σFrom Global Centroid Candidate Clusters Rejected
1σ 85%
2σ 92%
3σ 96%
TABLE II
PERCENTAGE OFcandidate clustersDEEMED AScollusion attacks.
PROFILES WERE GENERATED AT ONE,TWO,AND THREEσAWAY FROM
THE GLOBAL CENTROID. Candidate clustersCLOSER TO THEdecision boundaryARE MORE LIKELY TO BE DEEMEDconcept drift.
group of users start using a new application that generates behavior profiles substantially different from previous ones, it is very likely that such profiles will raise attack alerts in the incremental-learning algorithm. If this is the case, the clustering and bootstrap phases will have to be re-executed to include these new profiles as initial network members so that the access control policies are modified accordingly.
2) Threshold Attacks: One or multiple attackers within a
cluster of behavior may try to modify the thresholds and alter the dimensions of their own cluster. We only considered attacks where fewer than 50% of the cluster members are com-promised. Otherwise, the attackers hold control over the voting process. We concentrated on studying the effects of two types of attacks: diversified attacks where attackers modified their own profiles to disperse their cluster in multiple directions, and
unified attacks where attackers agreed on a unique modified
profile to stretch their cluster on a single direction (see Figure 4).
We started with the cluster distribution with k=30 selected during the clustering phase. From the distribution, we picked two clusters: cluster1 and cluster2, which featured respectively the highest and the lowest spread measured in terms of the distance between the behavior profiles of their members. The reasoning behind this selection was to study any possible correlation between the effects of the attacks and the spread across the members of a cluster. For each cluster, we produced a range of attacks by varying the number of attackers from 1% to 50% of the total size of the cluster. For the diversified attack, each attacker generated a different attack profile by iteratively increasing each of its normal profile features by 10%. In the
0 10 20 30 40 50 1 1.5 2 2.5 3 Percentage of Attackers Dispersion Factor cluster1,diversified cluster2,diversified cluster1,unified cluster2,unified
Fig. 6. Dispersion factor as a function of the percentage of attackers in a cluster.
case of the unified attack, all attackers started with the same initial normal profile and iteratively increased each of the profile features by 10%. A factor of 10% was chosen arbitrarily to demonstrate the effect of attacks. A different percentage selection would result on shorter or longer time scales for the attacks. However, the end effects would be similar.
In order to evaluate the performance of the mechanism when faced with such attacks, we defined a dispersion factor dthat represents the ratio between the initial average threshold of the cluster, and the final average threshold of the cluster once the attack had been detected. The average threshold corresponded to the mean value of the thresholds for all the members of a cluster and as such it constituted a reasonable measurement of the effects of an attack on the bootstrap phase.
Figure 6 shows the dispersion factors for different percent-ages of attackers. First, it is important to note that all unified and diversified attacks were eventually detected by the mech-anism. In addition, we see that the dispersion factor increased as a function of the percentage of attackers. Nonetheless, the dispersion factor seemed to be limited to a factor of three in all cases. The results also showed that the cluster with the largest spread (cluster1), displayed larger dispersion factors than the one with the smallest spread (cluster2). Moreover, diversified
attacks appeared to be more effective than unified attacks
in terms of dispersion factors. Overall, these experiments demonstrate that the mechanism is effective against threshold attacks involving 50% or less of attackers within a cluster.
VI. RELATEDWORK
Clustering methods for anomaly detection have been used to model a normal class from a set of normal samples. Samples are then compared against the normal class and deemed either normal or anomalous. Portnoy [7] was perhaps the first to use a hierarchical clustering algorithm to obtain a normal model and successfully detected different types of intrusions from the KDD CUP 1999 dataset. Later work by Leon et al. [10] proposed a fully unsupervised clustering method for anomaly detection where each cluster was characterized by a fuzzy membership function so that a certain sample would be a member of different clusters with different degrees of membership.
Our approach is novel in the sense that we apply clustering to behavior profiles computed from single samples rather than clustering the samples directly. Cooperative Anomaly
Detec-tion Sensors have been explored in systems like COSSACK
[11] and CATS [12] where a distributed environment shares alerts to strengthen each individual local security capabilities. We implement the concept of cooperation by allowing each network member to participate in the access control decision rather than just sharing alerts.
A number of NAC technologies are currently available in the market. Cisco Network Module for Integrated Services
Routers offers an agentless solution authenticating, authorizing
and remediating devices connected wired or wirelessly to the network. The Cisco Profiler executes an in-depth control of the endpoint devices of the network by passively monitoring their traffic. The Network Access Protection (NAP) platform from Windows, provides a client and server-side platform to implement policy validation, network access limitation and ongoing compliance. Compared to all other previous NAC technologies, our mechanism uses automatically computed access control policies based on behavior profiles instead of fixed policies as a security feature for the pre-connect phase.
VII. CONCLUSIONS ANDFUTUREWORK
We have presented a network access control mechanism that enhances BB-NAC by improving its access control ca-pabilities as well as incorporating the automatic update of behavior-based access control policies. Behavior profiles are clustered automatically into clusters that define the access control policies. Newcomers are admitted into the network only if their profiles are deemed normal by their closest cluster of behavior. We validate the mechanism using real user profiles computed from Cisco Netflow logs from a router at our host institution. In particular, we achieve true rejection rates of 95% for anomalous profiles with 10% false rejection rates. We have also introduced an incremental-learning algorithm that allows for an automatic update of the behavior-based access control policies while making the mechanism robust against attacks. Experiments show that the mechanism is effective in detecting
collusion attacks while leaving room for temporal evolution of
clusters of behavior (concept drift). Moreover, the mechanism is robust to threshold attacks involving fewer than 50% of attackers.
The results presented here constitute the first full imple-mentation of an automatic network access control mechanism based on behavior profiles. A more complete treatment ex-ploring content- and non-content-based behavior profiles for multiple ports as well an evaluation of the practical limits of this approach need to be examined. By combining content-and non-content-based behavior profiles, we hope to achieve a more robust access control. Ultimately, behavior-based access control may also support role-based access control [13] by providing an automated means of assisting in the manual specification of the data and services a role may legitimately access.
REFERENCES
[1] V. Frias-Martinez, S. Stolfo, and A. Keromytis, “Behavior-based network access control: A proof-of-concept,” in Information Security Conference
(ISC), 2008.
[2] ——, “Behavior profile clustering for false alert reduction in anomaly detection sensors,” in Annual Computer Security Applications
Confer-ence (ACSAC), 2008.
[3] ——, “Barter: Behavior profile exchange for behavior-based admission and access control in manets,” in Fifth International Conference on
Information Systems Security, 2009.
[4] D. Arthur and S. Vassilvitskii, “k-means++: the advantages of careful seeding,” in SODA ’07: Proceedings of the eighteenth annual
ACM-SIAM symposium on Discrete algorithms. Philadelphia, PA, USA: Society for Industrial and Applied Mathematics, 2007, pp. 1027–1035. [5] J. Hartigan and M. Wong, “A k-means clustering algorithm,” Applied
Statistics, vol. 28, 1979.
[6] H. Bock, “Automatic classification,” 1974.
[7] L. Portnoy, E. Eskin, and S. Stolfo, “Intrusion detection with unlabeled data using clustering,” in In Proceedings of ACM CSS Workshop on Data
Mining Applied to Security (DMSA), 2001.
[8] E. Spinosa, A. Ponce de Leon, and J. Gama, “Olindda: A cluster-based approach for detecting novelty and concept drift in data streams,” in In
Proceedings of the ACM Symposium on Applied Computing, 2007.
[9] C. Systems, “Inside cisco ios software architecture,” 2000.
[10] E. Leon, O. Nasraoui, and J. Gomez, “Anomaly detection based on unsupervised niche clustering with application to network intrusion,” in
In Proceedings of the congress of evolutionary Computation. Press, 2004, pp. 502–508.
[11] C. Papadopoulos, R. Lindell, J. Mehringer, A. Hussain, and R. Govindan, “Cossack: Coordinated suppression of simultaneous attacks,” in
Pro-ceedings of DARPA Information Survivability Conference and Exposition (DISCEX III), 2003.
[12] F. Dressler, G. Munz, and G. Carle, “Attack detection using cooperating autonomous detections systems (cats),” 2004.
[13] D. Ferraiolo and R. Kuhn, “Role-based access control,” in In 15th