University of Central Florida University of Central Florida
STARS
STARS
Electronic Theses and Dissertations, 2004-20192018
Explore Contributing Geometric Factors and Built-Environment on
Explore Contributing Geometric Factors and Built-Environment on
Bicycle Activity and Safety at Intersections
Bicycle Activity and Safety at Intersections
Scott CastroPart of the Civil Engineering Commons, and the Transportation Engineering Commons
Find similar works at: https://stars.library.ucf.edu/etd University of Central Florida Libraries http://library.ucf.edu
This Masters Thesis (Open Access) is brought to you for free and open access by STARS. It has been accepted for inclusion in Electronic Theses and Dissertations, 2004-2019 by an authorized administrator of STARS. For more information, please contact [email protected].
STARS Citation STARS Citation
Castro, Scott, "Explore Contributing Geometric Factors and Built-Environment on Bicycle Activity and Safety at Intersections" (2018). Electronic Theses and Dissertations, 2004-2019. 6197.
EXPLORE CONTRIBUTING GEOMETRIC FACTORS AND
BUILT-ENVIRONMENT ON BICYCLE ACTIVITY AND SAFETY AT
INTERSECTIONS
by
SCOTT CASTRO
B.S. University of Central Florida, 2017
A thesis submitted in partial fulfillment of the requirements for the degree of Master of Science
in the Department of Civil, Environmental, and Construction Engineering in the College of Engineering and Computer Science
at the University of Central Florida Orlando, Florida
Fall Term 2018
ii
iii
ABSTRACT
This study attempts to explore all factors associated with bicycle motor-vehicle crashes at intersections in order to improve bicycle safety and bicycle activity. Factors such as exposure (bicycle and vehicle volumes), existing facilities (bike lanes, sidewalks, shared-use paths), geometric design (# of lanes, speed limit, medians, legs, roadway conditions), and land-use were collected and evaluated using Poisson, Zero-Inflated Poisson, and Negative Binomial models in SAS 9.4 software. Increasing the bicycle travel mode can have positive lasting effects on personal health, the environment, and improve traffic conditions. Deterrents that keep users from riding bicycles more are the lack of facilities and most importantly, safety concerns. Florida has consistently been a national leader in bicyclist deaths, which made this area a great candidate to study. Vehicle and bicycle volumes for 159 intersections in Orlando, Florida were collected and compared with crash data that was obtained. All existing facilities, geometric design properties, and land-uses for each intersection were collected for analysis. The results confirmed that an increase of motor-vehicles and bicyclists would increase the risk of a crash at an intersection. The presence of a keyhole lane (bike lane in-between a through and exclusive right turn lane), was shown to be statistically significant, and although it still had a positive correlation with injury risk, it had a much lower risk of crashes than a typical bike lane at intersections. The presence of a far shared path (more than 4 feet from the edge of curb) was shown to be statistically significant in decreasing the risk of crashes between bicycles and motor-vehicles at intersections. Institutional, agricultural, residential, government, and school land uses had positive correlations and were statistically significant with increasing activity of bicyclists at intersections. This study is unique because it uses actual bicycle volume as an exposure to determine the effects of bicycle safety and
iv
activity at intersections and not many others have done this. It is important for transportation planners and designers to use this information to design better complete streets in the future.
Keywords: Bicycle Safety; Bicycle Activity; Intersection; Safety Effects; Bicycle Lane; Keyhole
Lane; Bike Slot; Shared Use Path; Sidewalk; Median; Poisson Model; Zero-Inflated Poisson model; Negative Binomial model
v
ACKOWLEDGMENTS
I would like to express my thanks to my thesis committee members, Dr. Mohamed Abdel-Aty, Dr. Qing Cai, and Dr. Naveen Eluru, for their effort and support in this research. In particular, I would like to acknowledge my advisor, Dr. Mohamed Abdel-Aty, for helping me improve my way of thinking and for his excellent guidance and effort on my research. Gratitude is also expressed to Dr. Qing Cai for the countless help to me and providing guidance, especially in statistical approaches.
Additionally, I would like to thank the transportation research team at the University of Central Florida for sharing their valuable ideas with me and for their support, especially Moatz Saad, for his leadership and guidance through this whole process.
I would especially like to thank my beautiful and loving wife and my two loving sons for their continued support throughout my schooling. Their continued support has given me the motivation needed in order to succeed in my schooling career. They have had to sacrifice so much time without daddy for me to better my career and nothing I can say or do for them can show them enough appreciation.
vi
TABLE OF CONTENTS
LIST OF TABLES ... ix CHAPTER 1: INTRODUCTION ... 1 1.1 Overview ... 1 1.2 BMV Crashes ... 4 1.3 Roadway Design ... 5 1.4 Bicycle Safety ... 5 1.5 Research Objectives ... 7 1.6 Thesis Organization ... 8CHAPTER 2: LITERATURE REVIEW ... 10
2.1 Bicycle Exposure ... 10 2.2 Built Environment ... 11 2.3 Existing Facilities ... 12 2.4 Excess Zeros... 15 CHAPTER 3. METHODOLOGY ... 16 3.1 Poisson Model ... 16
3.2 Negative Binomial Model ... 17
3.3 Zero-Inflated Model ... 18
vii 4.1 Bike Lanes ... 22 4.2 Shared-Use Path ... 26 4.3 Medians ... 27 4.4 Sidewalks ... 29 4.5 Geometric Variables... 30 4.6 Land-use ... 32 CHAPTER 5. RESULTS ... 33
5.1 Results of Bicycle Crashes ... 33
5.2 Results of Bicycle Activity ... 38
5.3 Land-Uses ... 41
5.4 Elasticity Effects of Contributing Factors ... 41
CHAPTER 6. CONCLUSIONS ... 43
CHAPTER 7. RECOMMENDATIONS AND CONTRIBUTIONS ... 46
viii
LIST OF FIGURES
Figure 1: Depiction of BMV crash (Source: SmartCitiesDive) ... 4
Figure 2: FHSMV Share the Road (Source: FHSMV) ... 6
Figure 3: Existing Bike Facilities in Orlando, FL (Source: Bike Orlando) ... 8
Figure 4: Thesis Organization Flow Chart ... 9
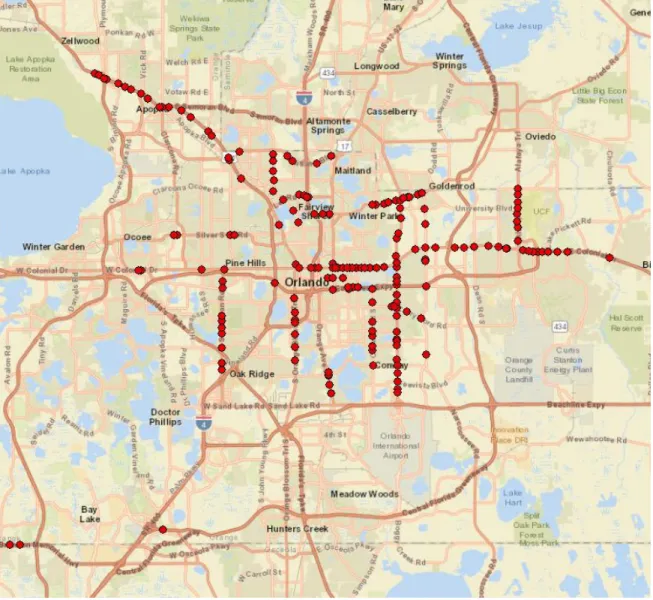
Figure 5: Study Area, 159 Intersections Studied in Orange County, FL for Analysis ... 21
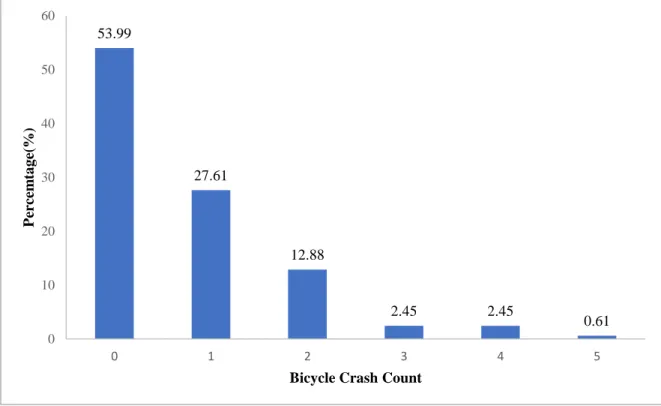
Figure 6: Crash Counts at Intersections in Study Area ... 22
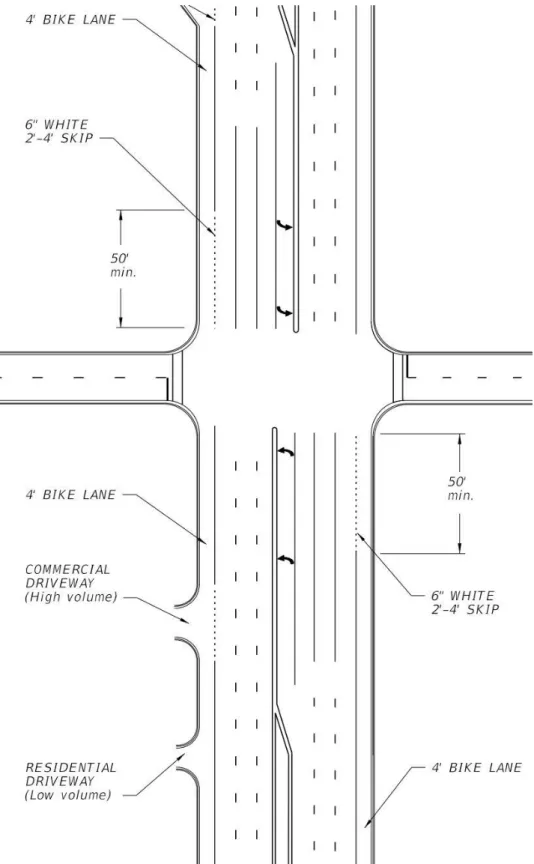
Figure 7: Conventional bike lane, Type 1 (Source: FDOT Design Manual) ... 24
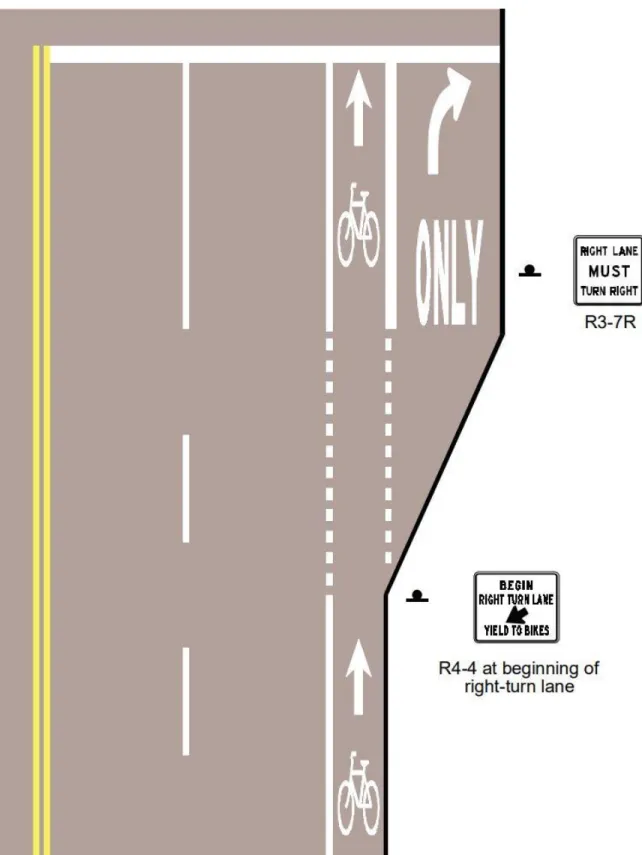
Figure 8: Keyhole Lane, Type 2 (Source: AASHTO) ... 25
Figure 9: Shared use Path (Source: FDOT RCI Characteristics Handbook) ... 27
Figure 10: Painted Median (Source: FDOT RCI Characteristics Handbook) ... 28
Figure 11: Raised Median (Source: FDOT RCI Characteristics Handbook) ... 28
Figure 12: Wide Median, no curb (Source: FDOT RCI Characteristics Handbook) ... 29
Figure 13: Bike lane length and bike slot length (Source: FDOT RCI Characteristics Handbook) ... 31
ix
LIST OF TABLES
Table 1: 2007-2016 Bicycle fatalities in Florida Source: NHTSA FARS ... 2
Table 2: Descriptive Statistics for Intersections in Orlando, FL ... 34
Table 3: Modeling Results for Bicycle Crashes (Safety) ... 37
Table 4: Modeling Results for Bicycle Counts (Activity) ... 39
x
LIST OF ABBREVIATIONS
AASHTO American Association of State Highway and Transportation Officials AIC Akaike Information Criterion
BIC Bayesian Information Criterion BMV Bicycle Motor-Vehicle
FARS Fatality Analysis Reporting System FDOT Florida Department of Transportation GIS Graphical Information System
MAE Mean Absolute Error MPH Mile per Hour NB Negative Binomial
NHTSA National Highway Traffic Safety Administration PBSSP Pedestrian and Bicycle Strategic Safety Plan RCI Roadway Characteristic Inventory
RMSE Root Mean Square Error SAS Statistical Analysis Software TRB Transportation Research Board UCF University of Central Florida
US United States
1
CHAPTER 1: INTRODUCTION
1.1 Overview
Bicycling is an active mode of transportation and is an important part of a multimodal transportation system. Bicycling as a mode of transportation helps promote social benefits such as improved air quality, public health, and overall mobility. According to the NHSTA, there has been an increase of 64% of people bicycling to work from 2000 to 2012. As regional transportation planning shifts toward a multimodal and complete streets approach, the need for facilities that enhance bicycling is becoming more apparent. Facilities such as bike lanes, shared-use paths, and sidewalks designate space for this travel mode and need to be expanded to provide connectivity and fill gaps in the bike lane and sidewalk networks. The deterrent in increased ridership in the bicycle mode of transportation is safety. Bicyclists just don’t feel safe enough bicycling due to poor facilities, high traffic volumes, high speed limits, and more. For biking to be a viable, healthy mode, travelers choosing the mode should be able to do so without either the fear or reality of excessive danger associated with their choice. Safety for non-motorized road users is the responsibility of multiple parties, including the user and other travelers, but also transportation planners and engineers through facility design (AASHTO 2010, METROPLAN-ORLANDO 2010). Therefore, this paper focuses on the safety research used to discern appropriate designs and countermeasures that enhance bicycle safety and activity.
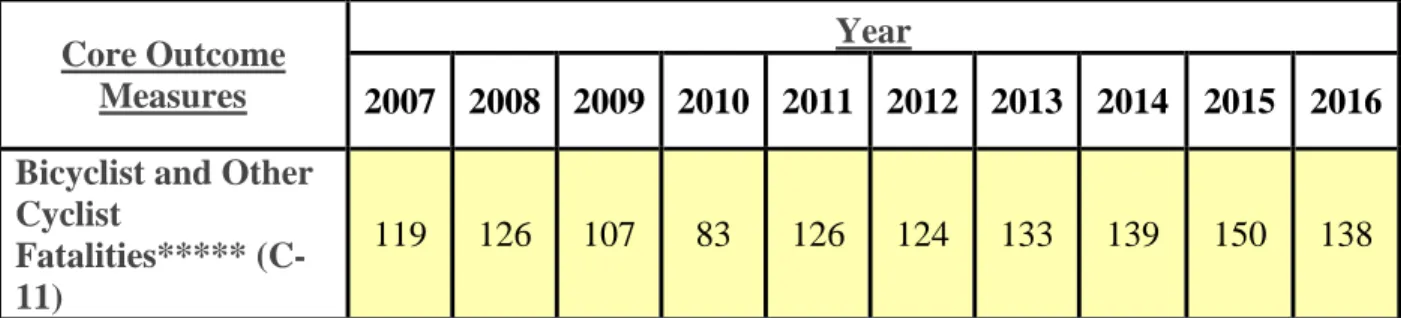
Florida is consistently a leader in bicycle fatalities across the entire nation. The number of cyclists fatalities in Florida for each year from 2007-2016 is seen in Table 1. According to the National Highway Traffic Safety Administration (NHSTA), the proportion of bicycle crash-related
2
fatalities has been increased from 1.7% to 2.3% from 2006 to 2015 (NHSTA, 2017) nationally. For this reason, there is a pressing need to understand what factors contribute to crashes between bicycles and motor-vehicles near intersections as well as what factors contribute to increased bicycle activity. In 2016 Florida had the highest fatality rate per million population. Florida has developed its own Pedestrian and Bicycle Strategic Safety Plan (PBSSP). Its objective is to focus funding and resources on the areas that have the greatest opportunity to reduce pedestrian and bicycle fatalities, injuries, and crashes. In order to create a safer cycling environment, we need to be able to understand where, when, and under what circumstances bicycle accidents occur. A literature review was conducted to determine what geometric design countermeasures were best to look at for safety or activity as well as literature on bicycle facilities. Most studies stated that there are not many studies that look at bicycle activity and safety at intersections using bicycle volumes as the exposure. That is something that makes this study unique already, as it tackles that issue with the data that was collected in the study area.
Table 1: 2007-2016 Bicycle fatalities in Florida Source: NHTSA FARS
Core Outcome Measures
Year
2007 2008 2009 2010 2011 2012 2013 2014 2015 2016
Bicyclist and Other Cyclist
Fatalities***** (C-11)
119 126 107 83 126 124 133 139 150 138
Orange County, Florida, USA is the application environment for this study. Inventory samples of signalized and un-signalized intersections that contain disaggregate motor-vehicle traffic
3
volumes and bicycle flows were used. Based off of literature review, important factors were collected for the sites in the study area including existing facilities, geometric design, and land-use characteristics in the vicinity of these intersections. SAS 9.4 software was used to explore all contributing factors to bicycle safety and activity at intersections using a Poisson modeling approach, Zero-Inflated Poisson modeling approach, and a Negative-Binomial modeling approach. These approaches through the literature review, proved to be the best methods to use for a crash count model as well as being able to handle the excess zero problem that we get with many intersections having zero crashes. These models were used to identify factors associated with both bicycle crashes and activity at intersections.
This study analyzed the findings of the models, which used volumes of bicycles and motor-vehicles at intersections as exposure data, and compared them with crash data, existing facilities, geometrical design, and land uses at these intersections. Existing facilities included the presence of sidewalks, shared-use paths, medians, bike lanes, and bike slots. Bike slots, also referred to as keyhole lanes, which are designated bike lanes that approach the intersection in-between an exclusive through lane and an exclusive right turn lane. For the purposes of this study, we defined existing bike lanes as “0” for bike lane not present, “1” for designated/undesignated bike lane present, and “2” for bike slots (keyhole lanes) present. Sidewalks, medians, and shared-used paths were defined as “0” for not present, and “1” for present. Geometrical design factors included the number of lanes, speed limits, road conditions, number of legs, and control type. Land uses within a half-mile from these intersections were used to see their effect on bicycle safety and activity.
4
1.2 BMV Crashes
Although BMV crashes are rare given the volume of vehicles on the road, they tend to lead to serious or even fatal injuries for the bicyclist. This study aims to look at the interaction between the bicyclists and motor-vehicles in order to determine the cause of the BMV crashes that were reported. This study differs from others due to the exposure factors associated with bicycle-motor-vehicle (BMV) crashes. Studies have shown that crashes between bicyclists and motor-bicycle-motor-vehicles usually do not end up well for the bike rider. Due to this, it is imperative that designers have the tools and research necessary in order to design in the safest way possible. For on-road cycling crashes, cycling on streets where cars are parked has been associated with increased crash risk, while on-road bicycle infrastructure, such as marked bicycle lanes, and lower motor vehicle speeds have been associated with reduced crash risk (Reynolds et al., 2009, Teschke et al., 2012, Cripton et al., 2015).
5
1.3 Roadway Design
Due to the direct influence of roadway design on bicycle crashes, much research has analyzed the impacts of roadway features like speed limit, number of lanes, roadway width, medians, and pavement conditions relating to bicycle crashes. However, these roadway features are automobile related features rather than bicycle oriented features. There has been limited research that solely focuses on the impacts of bicycle facilities on bicycle crashes (Trentacoste et al., 2002; Dumbaugh et al., 2009). To reveal the effects of contributing factors, it is important to include appropriate exposures which reflect the real bicycle activities. It is obvious that the number of people riding bicycles on the road (i.e., bicyclist trips) is one of the best measures of exposure for bicyclists. However, it is difficult to continuously measure the bicyclist trips at all locations. Hence, in this study, we will look at bicycles and explore all the contributing factors of safety and activity of bicyclists at intersections. This study aims to research factors such as different types of bike lanes, presence of sidewalks, medians, as well as shared-use paths that are the common countermeasures used in roadway design.
1.4 Bicycle Safety
Cycling as an active mode of transportation holds the potential to reduce traffic congestion and air pollution and promote an active lifestyle which in turn improves public health (Andersen et al., 2000; Higgins, 2005; Mueller et al., 2015). The health benefits of active commuting by bicycle are well established (Mueller et al., 2015; de Geus et al., 2008, 2009; Oja et al., 2011). However, safety concerns may be a drawback which affects bicycle activity. Meanwhile, it was reported that 50% and 70% of bicycle crashes happened at intersection or intersection-related area (Hunter
6
et al., 1996). Thus, traffic crashes and the consequent injury and or fatality has become a deterrent for bicycling as an active mode of transportation, especially in North American communities. To propose effective countermeasures to reduce bicycle crashes, it is important to identify the critical factors affecting the occurrence of bicycle crashes.
Safety for bicycle riders is the most important factor for riders. The safer that the rider feels, the more and further the bicyclist will ride. Obviously increased ridership will only benefit the environment as well as personal health. When it comes to studies on bicycle safety in the US, there are not that many. Cyclist safety studies at intersections are even rarer in the US. While a few studies have been carried out in the United States and Canada, these have mainly focused on cyclist injuries at the bicycle facility, city or town level, and did not focus on intersections (junctions) as the unit of study (Miranda- Moreno and Strauss, 2011). This study looks at all contributing factors relating to bicycle activity and safety at the intersection level with collected bicycle and motor vehicle volumes used for exposure.
7
1.5 Research Objectives
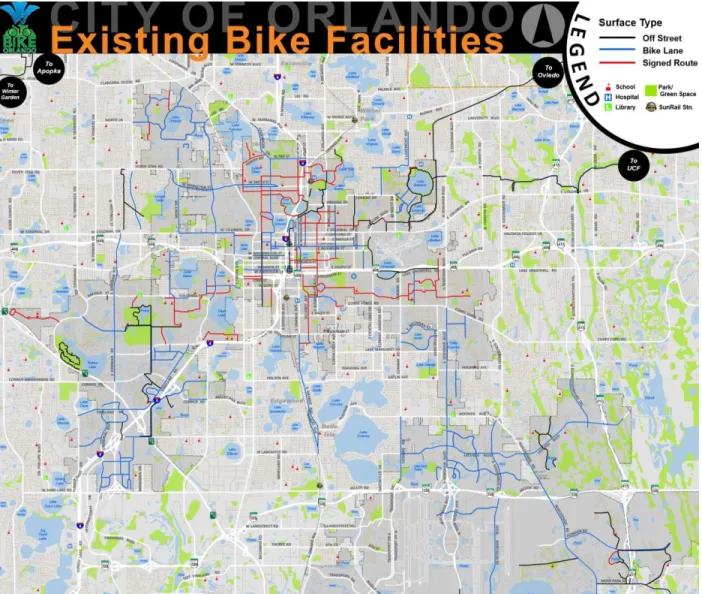
Bicycle activity and bicycle safety are closely correlated. The safer people feel riding, the more that they will ride. The objectives of this research was to find what existing facilities, roadway design features, and land uses, either contribute to or against bicycle activity and safety at intersections. This allows us to make a determination based off of the modeling results of what factors contribute positively or negatively for safety and activity at the intersections in the study area. Since Florida continues to be a leader in bicycle fatalities, it can be assumed that the study area can represent the Florida area. The research in this study seems to show that Orlando, Florida lacks enough existing bicycle facilities. Lack of existing facilities can deter people to ride less due to safety concerns. Existing bicycle facilities in Orlando, FL can be seen in Figure 3.
There were two types of bike lanes seen in this study, a traditional 5 foot bike lane between the outside travel lane and the curb or shoulder of the roadway, as well as keyhole lanes, which are located between the outside through lane and an exclusive right turn lane. As these bike lanes approached the intersection, this study aimed to see if there were any benefits to the designs that were existing. This study also aimed to see what effects, good or bad, other contributing factors, such as geometrical design and land uses had on bicycle safety and activity at intersections.
8
Figure 3: Existing Bike Facilities in Orlando, FL (Source: Bike Orlando)
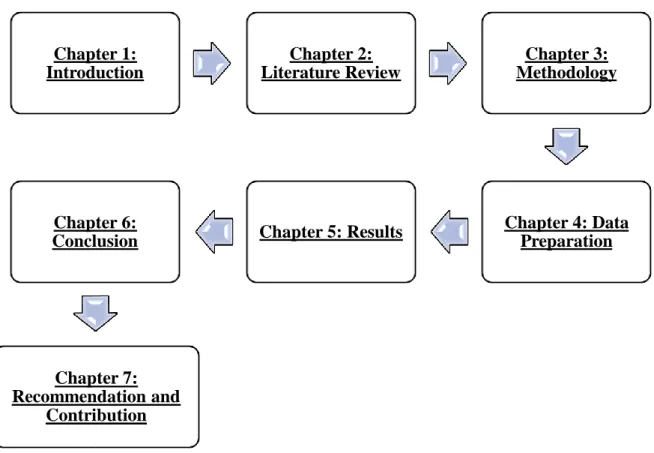
1.6 Thesis Organization
This thesis has been organized according to specific need. There are seven chapters in this manuscript each of which is targeted for a specific purpose. Chapter One contains the general introduction of the thesis, the scope of all parameters involved in the thesis, and the main objectives of the thesis. Chapter Two will review all pertinent literature that was used to assist in determining the best factors to study to increase bicycle safety and activity at intersections, as well as literature
9
on crash count models and the best modeling techniques to use. Chapter Three describes the research methodologies followed in the thesis. Chapter Four includes detail procedure for preparing the data for model development. All the data preparation tools and techniques are presented in this section. Chapter Five shows the modeling results of the study and the analysis of bicycle safety and activity at intersections. The explanations of the outcomes are presented in this section. Chapter Six provides conclusions brought about the results of the modeling. This includes all countermeasures to recommend based on the findings of the modeling process. Chapter Seven provides recommendations for bicycle facility design based off of the conclusion as well as all contributions that this study made to safety for bicyclists.
Figure 4: Thesis Organization Flow Chart
Chapter 1: Introduction Chapter 2: Literature Review Chapter 3: Methodology Chapter 4: Data Preparation Chapter 5: Results Chapter 6: Conclusion Chapter 7: Recommendation and Contribution
10
CHAPTER 2: LITERATURE REVIEW
2.1 Bicycle Exposure
The bicycle exposure is an essential factor for bicycle safety analysis. Only a few studies have taken into account full measures of risk exposure in the previous literature. For example, Miranda-Moreno et al. (2011) used three different definitions of risk exposure including completely aggregate flows, motor-vehicle flows aggregated by movement type, and potential conflicts between motor vehicles and cyclists for bicycle crash analysis. It was found that bicyclist crashes are sensitive to changes in cyclist flows: a 10% increase in bicycle flow is associated with a 5.3% increase in the frequency of cyclist injuries. However, motor-vehicle volumes at the intersection level do not have a significant effect on cyclist collision frequency. Similarly, Strauss et al. (2013) also used the volumes of bicycles and motor-vehicles to analyze bicycle crashes at signalized intersections. It was indicated that bicycle crashes occurrence is sensitive to changes in both bicycle and motor-vehicle flows. Specifically, cyclist volumes have a strong association with crash occurrence-a 1.0% increase in bicycle flows would result in a 0.87% increase in number of crashes. In terms of motor-vehicle flows, right turning vehicles were found to have the greatest effect whereas the effect of through moving motor-vehicle was found to be insignificant.
Exposure data, or data about the amount of bicycling and under what conditions, is sparse. This does not include many bicyclists that crash due to bicycle-only falls, crashes with fixed objects, pedestrians, or other bicyclists. This is missing data that, as far as we are aware, are not presently being captured in most localities and most likely would not be self-reported by the bicyclist but could be affected by these factors being studied. Based on a study by Strauss et al. (2013), the
11
presence of bicycle facilities at intersections was not found to be statistically associated with injury frequency, but has been found to increase cyclist volumes. Not surprisingly though, intersections with bicycle facilities have a significantly higher concentration of cyclists. This means that, after controlling for other factors, intersections with bicycle facilities, with higher cyclist volumes, are expected to witness greater injury frequency but lower injury rates. This would show that bicycle facilities would lead to increased activity due to the bicyclists feeling safer by having designated areas to ride.
2.2 Built Environment
To clarify the relationship between cycling and the built environment, methodological refinements tailored to cycling are needed. Factors such as the local availability of sidewalks or land use mix may be primary motivators of walking trips, but decisions on whether to cycle may be influenced by a different suite of factors across spatial areas beyond the trip origin (Winters et al., 2010). For this study, the built environment will consist of all bicycle facilities (bike lanes, bike slots, shared-use paths, etc.) available to the cyclist to make cycling safer. According to Winters et al. (2010), in a survey querying 73 factors, the top four motivators for making a trip by bicycle were related to routes: being away from traffic and noise pollution, having beautiful scenery, having separated bicycle paths for the entire distance, and having flat topography. The geographic accessibility of destinations (i.e., schools, employment sites, retail) may also affect the likelihood of making trips by bicycle, and since two thirds of cycling trips are under 5 km and 90% are less than 10 km, short trip distances are important. Changes in the built environment are expected to cause direct changes in bicycle volumes and therefore indirect changes in injury
12
frequency and injury risk at intersections. For instance, after the installation of a new bicycle facility crossing an intersection, bicycle flows are expected to grow as will the number of injuries without appropriate countermeasures (J. Strauss et al., 2013).
For a safety treatment to reduce number or severity of collisions between a motor vehicle and a non-motorized road user, the treatment generally needs to address one or more of the following objectives (expanded from Retting, Ferguson, and McCartt, 2003):
Increasing the separation of bicycles and motor vehicles in time and space
Increasing the visibility and conspicuity of non-motorized users
Improving lines of sight between the modes
Reducing the number of interactions between modes (e.g., number of driveways)
Reducing motor-vehicle speeds
2.3 Existing Facilities
Existing facilities for bicycle infrastructure consist of bike lanes, sidewalks, shared-use paths, and medians. Only a small number of intersections in this study have bicycle facilities in the intersection. This may explain why they were not found to be significant. Therefore, there is not enough evidence to establish a positive (or negative) association between bicycle facility presence and injury frequency at signalized intersections. The presence of bicycle facilities at intersections was not found to be statistically associated with injury frequency but has been found to increase cyclist volumes (Strauss et al., 2013). Not surprising, intersections with bicycle facilities have a significantly higher concentration of cyclists. This means that, after controlling for other factors,
13
intersections with bicycle facilities, with higher cyclist volumes, are expected to witness greater injury frequency but lower injury rates. Bike lanes in the study area consisted of a traditional bike lane or keyhole lanes. There were numerous intersections that did not have the presence of a bike lane. In this case, bicyclists were forced to either ride on the sidewalk, or ride in the traffic lane and follow the same rules as traffic. This makes bicyclists feel less safe and less apt to ride a bike. Therefore, it is imperative to understand all design factors for existing facilities that include bike lanes, sidewalks, shared-use paths, and medians.
According to Sadek et al. (2007), based on survey data, the installation of advanced bike lane helps increase awareness of drivers and bicyclists. The study showed that 75.4% drivers believed that the new bike lane made drivers more aware of the presence of bicyclists. The survey also showed that 76% of bicyclists said that new bike lane could make them more vigilant. Park et al. (2015) conducted a study to explore the effect of adding a bike lane by using both before–after and cross-sectional methods. The results showed adding a bike lane on urban arterials has positive safety effects for all crashes and bike crashes. It was also found that adding a bike lane is more effective in reducing bike crashes than all crashes. The overall safety of on-street bicycle lanes is a highly debated topic.
Per the FDOT Design Manual, shared-use paths are paved facilities physically separated from motorized vehicular traffic by an open space or barrier and are either within the highway right of way or an independent right of way. FDOT Design Manual states that a shared-use path should be a minimum 5 feet from the back of the curb or shoulder and should be at least 10 feet wide. Shared use paths are used by bicyclists, pedestrians, skaters, runners and others.
14
According to Strauss et al. (2013), the presence of a raised median at an intersection reduces injury occurrence by over 42%. Medians place constraints on motor-vehicle movements and can provide a refuge for cyclists who may have run out of time to safely cross the intersection. That is where this study will look to improve upon, the safety of bicyclists at intersections even when activity (exposure) increases. According to Kim et al. (2015), their findings showed the correlation between medians and bicycle crashes. The results confirm that the areas equipped with structured medians (both barrier and planter medians) have fewer bicycle crashes than the areas without structured medians. Meanwhile, intersections with three approaches are expected to have fewer cyclists than intersections with four approaches (with an elasticity of 0.77) (Strauss et al., 2013). This factor can be seen as a proxy for intersection connectivity.
Wedagama et al. (2006) produced generalized linear models to investigate the influence that land use and population density have on the frequency of crashes involving cyclists. Depending on the land-use around the intersection, there could be an effect on the bicycle volumes at the intersections. It would be thought that land-uses could have a positive or negative effect of the bicycle activity in the area. Schools for instance would produce more bicycle trips than agricultural land-use.
With the increase in bicycle activity recently, Florida has tried to stay ahead of the curve by supplying the population with more bicycle facilities. Some of these facilities include bike lanes, bike slots, sidewalks, and shared- use paths, but until more studies are done, we will not know which bike facilities have the most to offer in design for bicycle safety and increased activity.
15
2.4 Excess Zeros
Measuring impacts on bicyclist safety is a difficult undertaking as bicycle crashes with motor vehicles are relatively infrequent occurrences. One methodological challenge often faced in analyzing count variables is the presence of a large number of zeros. The classical count models (such as Poisson and NB) allocate a probability to observe zero counts, which is often insufficient to account for the preponderance of zeros in a count data distribution (Cai et al., 2016). In crash count variable models, the presence of excess zeros may result from two underlying processes or states of crash frequency likelihoods: crash-free state (or zero crash state) and crash state (see (Shankar et al., 1997) for more explanation). The zero-crash state can be a mixture of true zeros (where the zones are inherently safe (Shankar et al., 1997)) and sampling zeros (where excess zeros are results of potential underreporting of crash data (Miaou, 1994)). In presence of such dual-state, application of single-state model (Poisson and NB) may result in biased and inconsistent parameter estimates. In this study, a potential relaxation of the single-state count models are proposed for addressing the issue of excess zeros. The approach used, the zero inflated (ZI) model, is typically used for accommodating the effect of both true and sampling zeros, and has been employed in several transportation safety studies (Shankar et al., 1997; Chin et al., 2003). The zero-inflated model always offers better statistical fit to crash data.
16
CHAPTER 3. METHODOLOGY
This study tried to apply several statistical models to properly identify contributing factors for bicycle crashes and volumes, which are non-negative integer data. Hence, Poisson and Negative Binomial models could be used for the analysis. Besides, the count data usually have several problems in terms of data characteristics such as over-dispersion, omitted-variables bias, and or excess zeros. In this study, Poisson model, negative-binomial model, and zero-inflated model were used to find statistical significance of all factors obtained for this study.
3.1 Poisson Model
Since the beginning of crash frequency analysis, the Poisson model has been the most accepted by the researchers (Lord et al., 2010). The basic assumption of the Poisson model is that it assumes equal mean and variance of the distribution. Hence, Poisson model could be used if the variance is closed to the mean. In a Poisson regression model, the probability of roadway entity, in this case an intersection 𝑖 having 𝑦𝑖 crashes per some time period (where 𝑦𝑖 is a non-negative integer) is given by:
𝑃(𝑦𝑖) =𝐸𝑋𝑃(−𝜆𝑖)𝜆𝑖𝑦𝑖
𝑦𝑖! ( 1 )
where 𝑃(𝑦𝑖) is the probability of intersection entity 𝑖 having 𝑦𝑖 crashes per time period and 𝜆𝑖 is
the Poisson parameter for intersection entity 𝑖, which is equal to intersection entity i’s expected number of crashes per year, E[yi]. Poisson regression models are estimated by specifying the Poisson parameter 𝜆𝑖 (the expected number of crashes per period) as a function of explanatory variables, the most common functional form being:
17
𝜆𝑖 = 𝐸𝑋𝑃(𝛽𝑋𝑖) ( 2 )
where 𝑋𝑖 is a vector of explanatory variables and 𝛽 is a vector of parameters.
3.2 Negative Binomial Model
The negative binomial (NB) model is an extension of the Poisson model to overcome possible over-dispersion in the data. The NB model assumes that the Poisson parameter follows a gamma probability distribution. The model results in a closed-form equation and the mathematics to manipulate the relationship between the mean and the variance structures is relatively simple (Lord et al., 2010). The NB model relaxes the equal mean variance assumption of Poisson model and allows for over-dispersion parameter by adding an error term, 𝜀𝑖, to the mean of the Poisson model (Cai et al., 2016). The NB model is derived by rewriting the Poisson parameter for each observation 𝑖 as:
𝜆𝑖 = 𝐸𝑋𝑃(𝛽𝑋𝑖+ 𝜀𝑖) ( 3 )
where 𝐸𝑋𝑃(𝜀𝑖) is a gamma-distributed error term with mean 1 and variance 𝛼. The addition of this term allows the variance to differ from the mean as:
𝑉𝐴𝑅[𝑦𝑖] = 𝐸[𝑦𝑖][1 + 𝛼𝐸[𝑦𝑖] = 𝐸[𝑦𝑖] + 𝛼𝐸[𝑦𝑖]2 ( 4 )
The parameter 𝛼 is referred to as the over-dispersion parameter. Negative binomial model should be used if the data variance exceeds the mean of data. However, the NB model can generally account over dispersion resulting from unobserved heterogeneity and temporal dependency but may be improper for accounting for the over dispersion caused by excess zero counts (Rose et al., 2006).
18
3.3 Zero-Inflated Model
When accident count data have an overrepresentation of zero-accident observations (e.g., in the case of a specific accident type in which the number of accidents may be low), then the distribution of accident frequencies, including zero counts, may not follow the traditional Poisson and NB distributions (Lord et al., 2010). In this case, the data can be fitted into the zero-inflated models by assuming a dual-state process involving a zero-accident state with probability 𝑝𝑖 and a non-zero-accident state with probability 1 − 𝑝𝑖, where 𝑝𝑖 is an unknown parameter to be estimated. The first state is for those intersections that always have zero counts, while the second is for other intersections with accident frequencies that follow some distributions, such as Poisson or NB. In this dual-state system, it is difficult to judge whether an intersection observed with zero count for a particular year is in the first or second state. Therefore, the overall probability of zero count is a combination of the probabilities of zeroes from each state, weighted by the probability of being in that state, that is:
𝑃𝑟[𝑌𝑖 = 0|𝑋𝑖] = 𝑝𝑖+ (1 − 𝑝𝑖)𝑅𝑖(0) ( 5 )
where 𝑅𝑖(0) is a Poisson or NB probability with zero accident (i.e., 𝑌𝑖 = 0) that occurs by chance in the second state. On the other hand, the probability of positive counts is given by:
𝑃𝑟[𝑌𝑖 > 0|𝑋𝑖] = (1 − 𝑝𝑖)𝑅𝑖(𝑌𝑖) ( 6 )
where 𝑅𝑖(𝑌𝑖) is the Poisson or NB probability with positive counts 𝑌𝑖 > 0. Hence, by combining equations (5) and (6), the ZIP regression model can be expressed as:
𝑃𝑟(𝑌𝑖|𝑋𝑖) = {
𝑝𝑖+ (1 − 𝑝𝑖) 𝑒𝑥𝑝(−𝜆𝑖),𝑌𝑖 = 0 (1 − 𝑝𝑖)𝑒𝑥𝑝(−𝜆𝑌𝑖)𝜆𝑖𝑌𝑖
𝑖! ,𝑌𝑖 > 0
19
Zero-inflated models operate on the principle that the excess zero density that cannot be accommodated by a traditional count structure is accounted for by a splitting regime that models a crash-free versus a crash-prone propensity an intersection. Since its inception, the zero-inflated model (both for the Poisson and negative binomial models) has been popular among transportation safety analysts (Shankar et al., 1997; Carson and Mannering, 2001; Lee and Mannering, 2002; Kumara and Chin, 2003; Shankar et al., 2003).
20
CHAPTER 4. DATA PREPARATION
This study looked at intersections in Orange County, Florida in order to better understand contributing factors associated with bicycle activity and safety. Observed motor-vehicle volumes and bicycle volumes were collected as exposures at 159 intersections in Orange County and the intersections are shown below in Figure 5. Crash data for bicycle crashes at these intersections was obtained from Signal 4 Analytics and matched with volume data for the corresponding intersections. Totally 120 bicycle crashes were collected from 2010 to 2013. As shown in Figure 6, nearly half of the intersections (53.99%) in the study area have zero crash count and only one intersection has 5 bicycle crashes. It is indicated that future modeling analysis should consider such excess zeros more in depth.
21
22
Figure 6: Crash Counts at Intersections in Study Area
4.1 Bike Lanes
In Florida, the bicycle is legally defined as a vehicle and the bicyclist as a driver. That means that bicyclists have the same rights to the roadways, and must obey the same traffic laws as the drivers of other vehicles. These laws include stopping for stop signs and red lights, riding with the flow of traffic, using lights at night, yielding the right-of-way when entering a roadway and
yielding to pedestrians in crosswalks (Florida Bicycle Association). Bike lanes have a powerful
influence on people's willingness to try bicycling in traffic. Unfortunately, it's easy to forget that riding in a bike lane is still riding in traffic!
While there are different types of bike lane designs used throughout the world, this study can only analyze the types of bike lanes that were located in the study area. A bike lane was defined
53.99 27.61 12.88 2.45 2.45 0.61 0 10 20 30 40 50 60 0 1 2 3 4 5 P er ce m ta g e( %)
23
in three ways for this study based off the types that were collected in the study area. If there was not a presence of a bike lane, then it was defined as “0” type. If there was a presence of a bike lane on the right side of the roadway, then it was defined as “1” type (Figure 7). If there was a presence of a keyhole lane, then it was defined as “2” type (Figure 8). Google maps and google earth were used to collect the existing bike lane conditions at the intersections of the study using aerial and street views. This information was input into a excel spreadsheet to upload into the SAS 9.4 statistical program.
24
25
26
At intersections, two geometric design factors are directly related to bicyclists: (1) bike lane; (2) shared path. According to Pucher et al. (2011), adding bike paths and bike lanes has been the main approach to make cycling safer. The striped bike lane marked with white paint to draw drivers’ attention is one of the most common bike lanes in Florida. As shown in Figure 7, type “1” bike lane, is a conventional bike lane and Figure 8 is a bike slot, or keyhole lane. It can be seen in Figure 8 that a keyhole lane is between a through lane and an exclusive right turn lane at an intersection.
The presence of a designated or undesignated bike lane on the major roadway was seen in 77 of the 159 intersections. Of those 77 bike lanes present on the major roadway, 45 were keyhole lanes. The minor roadway had the presence of a bike lane in only 24 of the 159 intersections in the study area. Of those 24 bike lanes present on the minor roadway, 13 were keyhole lanes.
4.2 Shared-Use Path
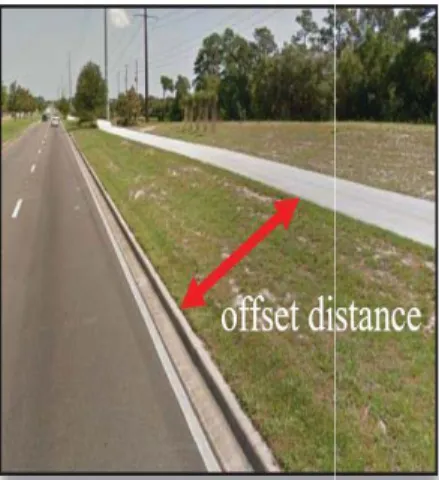
FDOT’s RCI characteristic data defines a shared-use path as an asphalt-paved way, within the highway right of way, at least ten feet wide, separated from the shoulder or back of curb by an open space at least five feet wide or by a barrier (Figure 9). It is not signed as closed to bicycle use, and a designation as a “shared path” is not required. It is restricted from motor vehicle usage. This means that the sight distances, curve radii, pavement width, and slopes - all the design elements - are optimized for relatively fast bicycle travel (about 18 mph). Generally, the farer the shared path is away from the roadway, the safer the bicyclist will be.
27
Figure 9: Shared use Path (Source: FDOT RCI Characteristics Handbook)
All information analyzed in this study for shared-use paths was collected from FDOT RCI data inventory. Some of the information that was collected for the shared-use paths included the length of the path, the width of the path, and the separation of the path from the roadway. These values were input into the master excel spreadsheet to further evaluate their effects during the modeling process. The shared path separation is an important safety measure. The greater the distance the shared path is from the roadway, the less chance there is for conflict between pedestrians/bicycles and vehicles. In this study area, it was found that 59 of the 159 intersections had the presence of at least one approach with a shared-path that was at least 5 feet from the roadway.
4.3 Medians
Medians act as a barrier between travel lanes and even a refuge for pedestrians or bicyclist that are crossing and don’t feel safe crossing the entire roadway at once. There are different types of medians but only ones in the study area were used in this analysis. Medians collected in this study were defined three ways. A median was defined as “0” if there was not a presence of a median or
28
if it was a painted median (Figure 10). A median was defined as “1” if there was a presence of a raised concrete median, with or without vegetation (Figures 11 and 12). A median was defined as “2” is there was a presence of a wide median.
Figure 10: Painted Median (Source: FDOT RCI Characteristics Handbook)
29
Figure 12: Wide Median, no curb (Source: FDOT RCI Characteristics Handbook)
In this study area, it was determined that 130 of 159 major roadways at the intersections had a median. Out of those 130 with a median, 117 were curb raised medians. It was also determined that 86 of 159 minor roadways at the intersections had a presence of median. Of those 86 with a median, there were 79 that were a curb raised median.
4.4 Sidewalks
Since a bicycle is legally considered a vehicle in the state of Florida, that makes it illegal to ride a bike on a sidewalk. Though there are still plenty of people that ride on the sidewalk due to it giving them a sense of safeness from the traffic. At driveways and intersections, motorists often
30
drive onto the sidewalk area or crosswalk to get a better view of traffic and may not look for bicyclists approaching on the sidewalk or bicyclists riding against the direction of roadway traffic. Motorists turning right into a driveway or intersection may not see bicyclists on sidewalks approaching on the right from behind them. The primary remedies for this behavior are education and enforcement in locations where riding on sidewalks is illegal. The most appropriate engineering measure to address this issue is to design the roadway to accommodate bicyclists, with techniques such as bike lanes on busy streets, and/or traffic calming to reduce motor vehicle speeds and/or volumes (AASHTO, 2012).
The inventory of sidewalks in this study were collected using Google Earth and Google Maps at the street view to see the presence of sidewalks for both the major and minor approaches. A sidewalk was defined as “0” if there was not a presence of a sidewalk on at least one side of the roadway, and it was defined as “1” if there was a presence of a sidewalk on at least one side of the roadway at the intersection. This was conducted for both major and minor approaches. It was found that in the study area, there were 149 out of 159 major roadways having the presence of a sidewalk at the intersection. It was also found for the minor approaches of the 159 intersections, that 137 had the presence of a sidewalk at the intersection.
4.5 Geometric Variables
Geometric variables such as bike lane length, bike slot length (Figure 4), sidewalk length, shared path width, shared path distance, were collected from the Florida Department of Transportation (FDOT) Roadway Characteristics Inventory (RCI) data. Other variables that were
31
collected using Google Earth or Google maps included speed limits, number of lanes, number of approaches, signal control. These values were input into the master excel list and analyzed using the SAS 9.4 software. Speed limits were broken down further defining a low speed on the major or minor roadway as 40 mph and less. A speed limit was considered a high speed on the major or minor roadway with a speed of 45 mph and greater.
Figure 13: Bike lane length and bike slot length (Source: FDOT RCI Characteristics Handbook)
Other variables of geometric design were also collected including number of legs, the presence of medians (raised, wide, or none), number of lanes for each leg, sidewalks, pavement conditions, and speed limits (high and low), and land-use (percentage of industrial, residential, etc.)
32 4.6 Land-use
In addition to the geometric variables, land use information in the buffer area was collected from the Florida Department of Revenue property tax oversight program. The database provides land-use pattern from which the land use of the study area was extracted from the revenue lane-use code. As shown in Table 2, the land use was divided into 11 types and the percentage of each type land use was calculated. In order to extract and process the data, a circular area (250 feet buffer) around the intersection as a center point was defined by using GIS.
33
CHAPTER 5. RESULTS
In this study, 159 intersections were studied for modeling the effects of different parameters on bicycle activity and safety. The overall estimation process involved 3 model types (Poisson, NB, and ZIP models) for bicycle activity and safety. SAS 9.4 software was used to determine the effects of the parameters and to determine conclusions and recommendations related to bicycle activity and safety at intersections.
5.1 Results of Bicycle Crashes
Table 2 summarizes the descriptive statistics for collected crash counts and traffic volumes. It could be found that the variance closes to the mean of crash count. Considering 88 of the 159 intersections were with zero crash count as seen in Figure 6, the Poisson model and zero-inflated Poisson will be used in this study to determine the safety effects of contributing factors to the intersections. Meanwhile, the bicycle volumes have much larger variance compared to the mean and only 8 out of the 159 (5%) intersections have zero bicycle volumes. Hence, negative binomial model will be used to analyze bicycle activity.
34
Table 2: Descriptive Statistics for Intersections in Orlando, FL
Variable Mean Standard Deviation Minimum Maximum
Crash count 0.736 1.011 0 5
Motor-vehicle volume on major road 29879.850 10085.08 6200 58014
Motor-vehicle volume on minor road 7140.820 7214.890 272 38183
Bicycle counts 62.748 59.683 0 378
Percentage of truck volume 0.019 0.048 0 0.489
Bike lane type 1 0.535 0.500 0 1
Bike lane type 2 (keyhole) 0.308 0.463 0 1
Shared path far away from the roadway 0.371 0.485 0 1
Wide shared path 0.893 0.310 0 1
Raised median 0.774 0.420 0 1
Wide median 0.553 0.499 0 1
4-leg intersection 0.843 0.365 0 1
Speed limit on Major road 43.396 5.010 30 55
Speed limit on Minor road 31.761 7.654 15 45
Percentage of residential land use 0.340 0.268 0 0.987
Percentage of school land use 0.036 0.113 0 0.932
Percentage of commercial land use 0.247 0.238 0 1.000
Percentage of institutional land use 0.034 0.076 0 0.615
Percentage of land use tourism 0.001 0.018 0 0.223
Percentage of land use industrial 0.045 0.099 0 0.667
Percentage of government land use 0.115 0.177 0 0.964
Percentage of agricultural land use 0.019 0.093 0 0.702
Percentage of bar land use 0.001 0.003 0 0.018
Percentage of mixed land use 0.010 0.023 0 0.146
35
Table 3 represents the bicycle crash modeling results, which uses the Poisson and zero-inflated Poisson models. Prior to discussing the results of the models, the table presents different measures including log-likelihood, Akaike Information Criterion (AIC), Bayesian Information Criterion (BIC), mean absolute error (MAE), and root mean square error (RMSE) for the models. It could be found that significantly smaller AIC and BIC could be found in the zero-inflated Poisson model. Besides, the zero-inflated Poisson model could also provide smaller MAE and RMSE values compared to the Poisson model. Hence, with the modeling results of the two models presented, the following discussion about the effects of different factors will focus on the zero-inflated model which has the better data fit.
For the zero-inflated Poisson model, it first looks at a probabilistic model to deal with the excess zeros and then looks at a count model to deal with the crash count with the Poisson distribution. In the count model part, the results from Table 3 show that the motor-vehicle volume on the major road is not significant in the zero-inflated model but is significant in the Poisson model. The models show that with any increase in motor-vehicle volume, that the risk involved with crashes with bicycles at intersections increases. Besides, it shows that the major road volume increases risk more than the minor road, although both increase risk with increase of motor-vehicle volume. It is also seen for exposure that an increase in bicycle volume will increase the risk associated with bicycle crashes at intersections. For the geometric factors that were evaluated in the study area, only some were found to be significant. While both types of bike lanes were shown to increase bicycle crashes (due to increase bicycle exposure), bike lane type 2 (i.e., keyhole bike lane) has a significantly smaller effect than a typical bike lane. This would be because the design of the keyhole is meant to eliminate the “right hook” crash associated with a right turning vehicle into a
36
bicycle in a bike lane or on the shoulder. Far shared-use paths were shown to actually decrease bicycle crashes significantly. This is due to far shared-use paths being at least 5 feet from the roadway, creating a separation boundary from motor-vehicles. One land use variable, institutional land use, was shown to increase the risk of bicycle crashes at intersections. It would be thought that institutional land uses would produce less experienced riders, and therefore increasing the risk.
In the probabilistic modeling part, residential, agricultural, and government land uses are shown to increase probability of zero bicycle crashes, which in turn could decrease the bicycle crashes. This could be due to less volume of motor vehicles, lower speeds, more awareness of bicyclists, and or better bicycle facilities around these land uses. Meanwhile, wide shared-use paths show a decrease probability of zero bicycle crashes, which in turn would increase the risk of bicycle crashes. This in part would be due to the major increase in bicycle activity due to the inviting facility to use. This could be misleading though and could be something that could be studied more in the future. A combination of a wide and far shared-use path would be the best recommendation due to it being able to increase bicycle safety while also increasing bicycle activity. Due to the separation of the far shared-use path, it would be interesting in future research to see if there are other areas to evaluate to see if these safety affects are consistent.
37
Table 3: Modeling Results for Bicycle Crashes (Safety)
Parameter
Poisson Model Zero-Inflated Poisson Model Mean Standard Error 95% Confidence Limits Mean Standard Error 95% Confidence Limits Count model Intercept -13.555** 3.401 -20.221 -6.888 -5.662** 1.017 -7.655 -3.670 Traffic
Log of motor-vehicle volume on major road 0.655** 0.334 0.000 1.311 - - - -
Log of motor-vehicle volume on minor road 0.320** 0.112 0.101 0.539 0.301** 0.116 0.074 0.528
Log of bicycle counts 0.242** 0.101 0.045 0.438 0.310** 0.093 0.128 0.491
Geometric factors
Bike lane (reference: no bike lane)
Bike lane type 1 0.846** 0.267 0.323 1.369 0.778** 0.267 0.256 1.301
Bike lane type 2 0.462* 0.253 -0.035 0.958 0.501** 0.254 0.003 0.999
Shared path far away from the roadway -0.448** 0.214 -0.867 -0.030 -0.418* 0.214 -0.836 0.001
Wide shared path 1.154* 0.609 -0.039 2.347 - - - -
Land use
Percentage of institutional land use 0.028** 0.013 0.002 0.053 0.023* 0.013 -0.003 0.049
Probabilistic model Intercept - - - - -6.966* 4.014 -14.833 0.901 Geometric factors
Wide shared path - - - - -15.950* 8.494 -32.598 0.697
Land use
Percentage of residential land use - - - - 0.239* 0.126 -0.007 0.485 Percentage of agricultural land use - - - - 0.503* 0.282 -0.049 1.055
Percentage of government land use - - - - 0.273* 0.156 -0.034 0.579
Log likelihood -122.534 -117.623
Akaike information criterion (AIC) 333.771 329.949
Bayesian information criterion (BIC) 361.391 366.775
Mean absolute error (MAE) 0.617 0.587
Root mean square error (RMSE) 0.813 0.795
38
5.2 Results of Bicycle Activity
Table 4 represents bicycle activity at intersections and uses negative binomial modeling for best fit. The parameters were broken down into three different categories (traffic, geometric, and land use).
For the traffic parameters that were studied and shown to be significant, it can be seen from Table 4 that with the increase in motor-vehicle volume, there will be an increase in bicycle activity. This can be attributed to busier roads are more likely to have a designation for bicycles, therefore having the presence of bicycle facilities and increasing activity. The percentage of truck volume is shown to decrease bicycle activity the higher the percentage of trucks in the intersection. Bicyclists cannot feel safe if riding next to or near large trucks, therefore the presence of more trucks would lead to less bicyclists.
Geometric parameters that were studied and to be found significant were the presence of a wide shared path, raised medians, wide medians, 4-leg intersections, and low and high speed limits on the major road. The presence of a wide shared path is shown to increase bicycle activity because it gives bicyclists a bigger, safer area to ride in, creating a safer environment to ride bicycles. The presence of a raised median will increase bicycle activity in the intersections in the study area. This can be assumed that where there is a raised median, there are better bicycle facilities and it gives cyclists as well as pedestrians a place of refuge if they cannot cross all the way across the street. However, the presence of a wide median decreases bicycle activity. A wide median is highly correlated with higher traffic volumes and higher speeds. These would be factors that would
39
lead bicyclists to stay away from these areas and therefore decrease activity. Four-legged intersections were shown to increase bicycle activity. These intersections bicyclists probably find safer because they are more equipped with facilities for cycling. Speed limits on the major road of intersections in the study area show that with higher speed limits (equal or greater than 45 mph) bicycle activity decreases, and with lower speed limits (equal or lower than 40 mph) bicycle activity increases. This shows that bicyclists feel safer riding on roads, in this case major roads of intersections that have lower speed limits. The higher the speed limit, the less safe bicyclists feel. It should be noted that no significant effects of bike lanes were found for bicycle activity though it could be inferred that with better safer facilities, bike ridership should increase.
40
Table 4: Modeling Results for Bicycle Counts (Activity)
Parameter Mean Standard Error Wald 95% Confidence Limits
Intercept -8.331 1.853 -11.962 -4.699
Traffic
Log of motor-vehicle volume on major road 0.809 0.170 0.477 1.142 Log of motor-vehicle volume on minor road 0.297 0.072 0.156 0.439
Percentage of truck volume -0.067 0.012 -0.090 -0.044
Geometric factors
Wide shared path 0.588 0.220 0.157 1.018
Raised median 0.339 0.175 -0.004 0.683
Wide median -0.323 0.154 -0.625 -0.020
Indicator of 4-leg intersection 0.426 0.186 0.060 0.791
Indicator of low speed limit on major road 0.485 0.172 0.147 0.822 Indicator of high speed limit on major road -0.647 0.225 -1.088 -0.206 Land use
Percentage of school land use 0.019 0.006 0.008 0.030
Percentage of residential land use 0.010 0.003 0.005 0.016
Percentage of institutional land use -0.017 0.009 -0.035 0.002
Percentage of government land use 0.012 0.004 0.004 0.020
Dispersion 0.601 0.072 0.476 0.760
Log likelihood -769.523
Akaike information criterion (AIC) 1569.063
Bayesian information criterion (BIC) 1615.096
Mean absolute error (MAE) 32.285
41 5.3 Land-Uses
Land use parameters that were found to be significant in this study are residential, school, institutional, and government. Bicycle activity increased with residential, school, and government land uses with school land use having the biggest impact to bicycle activity out of all of them. Obviously there are a lot of kids that ride bicycles to school, which would lead to increased activity for bicycles. This would be an opportunity for the further research due to school zones having other factors and parameters that could affect bicycle activity and safety at intersections. Institutional land use was shown to decrease bicycle activity, due to institutional land use being churches, homes for the aged, clubs, lodges, sanitariums, convalescent and rest homes, etc. These areas are not generally associated with heavy bicycle activity, if any at all.
5.4 Elasticity Effects of Contributing Factors
The parameter effects of exogenous variables in Table 5 do not directly provide the magnitude of the effects on bicycle crash counts. For this purpose, this study computes aggregate level “elasticity effects” of exogenous variables having significant impacts on bicycle safety and activity in the intersections in Orange County, Florida. The elasticity analysis assists in providing a clear picture of attribute impacts on intersection level bicycle crash counts. The elasticity analysis conducted provides an illustration on how the proposed model can be applied to determine the critical factors contributing to increase in bicycle crash counts and activity. It is shown that the same significant variables in Poisson model and zero-inflated Poisson models could have the same effects on bicycle crashes.
42
Table 5: Elasticity Effects of Contributing Factors
Parameter Bicycle Crashes Bicycle Counts
Poisson Model Zero-Inflated Poisson Model Negative Binomial Model
Traffic
Log of motor-vehicle volume on major road 6.451 - 8.016
Log of motor-vehicle volume on minor road 3.102 2.888 2.873
Log of bicycle counts 2.335 2.973 -
Percentage of truck volume - - -48.778
Geometric factors
Bike lane type 1 132.914 117.733 -
Bike lane type 2 58.661 65.004 -
Shared path far away from the roadway -36.122 -34.157 -
Wide shared path 21.712 77.473 80.002
Raised median - - 40.368
Wide median - - -27.574
Indicator of 4-leg intersection - - 53.066
Indicator of low speed limit on major road - - 62.353
Indicator of high speed limit on major road - - -48.154
Land use
Percentage of institutional land use 31.794 25.581 -15.549
Percentage of residential land use - -20.492 10.738
Percentage of agricultural land use - -30.551 12.975
Percentage of government land use - -22.044 -
43
CHAPTER 6. CONCLUSIONS
Some of the information from this study can help improve bicycle activity and safety. From the literature review and the results of this study there are several conclusions that can be made. First and foremost is that Florida has a major bicycle safety issue. It consistently among the top states in fatalities in bicycle to motor-vehicle crashes. It needs to be a major priority, not only in Florida, but nationwide and worldwide as well, that bicycle and pedestrian safety improve. It would be good for the environment if we could increase the bicycle activity in the United States. There would also be tremendous health benefits with increased bicycle activity. Unfortunately, the main reason people don’t ride bicycles more is their fear of their safety while riding. Sidewalks are not meant for bicycles and present dangerous conflicts with all driveways between intersections. Riding on the road does not feel safe to riders when there are not proper facilities for them to ride on. In this study in Orlando, Florida, only 24 of the 159 intersections on minor roads even had bicycle facilities and less than half (77/159) of the intersections on major roads had bicycle facilities. So the first step in improving bicycle activity is safety. Riders that feel safer will ride more and ride further, resulting in less vehicle trips and ultimately be better for health, physical, and environmental reasons.
In order to improve bicycle safety from a design perspective, previous studies and future research should be used to determine factors that contribute to safety and ultimately activity. From the results of this study, it can be concluded that there are several factors and parameters that influence bicycle activity and safety that could be included in the design process. It was set out in the beginning of this study that we wanted to show that bike slots (keyhole lanes) were safer for
44
bicyclist to ride than a bike lane or no facilities at all. The parameters that this study shows positively affect bicycle activity and safety should be thought about for implementation in future designs. Parameters that negatively affect bicycle activity and safety should be thought to not be included in future designs. It was found to be statistically significant that bicycle slots (keyhole lanes) are safer than bike lanes or no bicycle facility at intersections in the study area. This is mainly due to the fact that the keyhole lane takes the exclusive right turn conflict out of the equation. This could lead to a conflict further upstream the roadway segment where the right lane has to cross the bike lane to enter the exclusive right turn lane, but further research would need to be conducted. Although keyhole lanes show an increase in crashes at intersections, it is significantly less than other bicycle facilities other than far shared-use paths in Orlando, Florida. It was also shown that far shared-use paths actually decrease the risk of BMV crashes at intersections. With the path being at least five feet from the edge of pavement, this gives the far shared-use path a barrier between motor-vehicle traffic and bicyclists. Since a shared use path is usually ten or more feet wide, it would increase activity as well as safety. Placing these far shared-use paths on major roads with a speed limit no greater than 35 mph or on minor roads in general would greatly increase the safety of the bicyclist and therefore also increase activity.
In conclusion, bicycle safety would greatly affect bicycle activity. For Florida being a leader in bicycle fatalities in the United States, there needs to be a greater emphasis on what parameters could positively affect bicycle safety and activity. First and foremost, more facilities need to be built to better accommodate the bicyclist. In the study area in Orlando, Florida, there were not as many bicycle facilities as there should be when we are a leader in the nation for bicycle facilities. It is understood that not every road or intersection has the ability to add infrastructure to
45
accommodate bicycle facilities, but for any roadway or intersection that does have the ability to accommodate bicycle facilities, it would be recommended to install bike lanes, key hole lanes at intersections, and where possible far shared-use paths. Designing these bicycle facilities and keeping them away from high speed (over 40mph) roads would be beneficial for bicycle safety and help increase bicycle activity. Further research could be done to study more intersections in Florida, as well as the United States, to find other contributing factors on bicycle safety and activity and ultimately save as many lives as possible by putting safety first.
46
CHAPTER 7. RECOMMENDATIONS AND CONTRIBUTIONS
This study looks at bicycle volume as a unit of exposure, where most bicycle studies use motor-vehicle exposure to look at the effects of bicycle safety. This really doesn’t make sense due to if bicycle safety needs to be studied, actual bicycle volumes should be used to determine the effects of safety and activity at intersections. All existing facilities, geometric designs, and land-uses were analyzed to see their effects with the bicycle volumes being the main unit of exposure. During this study, it was noticed that there really are not that many existing facilities for bicyclists on the roadways and a more extensive network of bike lanes, sidewalks, and shared-use paths need to be constructed for connectivity for all existing facilities. It would be recommended that further research be done on alternative designs for bicyclists since here in Orlando, Florida there were only two different kinds of bike lanes while there are plenty more such as sharrows, green bike lanes, bike boulevards, etc.