medicaid
kaiser
commission
o n I S S U E P A P E Ra n d t h e
uninsured
House Republican Budget Plan: State-by-State Impact of Changes in Medicaid Financing
John Holahan, Matthew Buettgens, Vicki Chen, Caitlin Carroll, and Emily Lawton1Introduction
The large and growing federal deficit has intensified calls for entitlement reform. Two prominent deficit commissions, the President’s National Commission on Fiscal Responsibilities and Reform and the Bipartisan Policy Center Debt Reduction Task Force, have made broad proposals to reduce the deficit. The Obama administration also made recommendations. Recently, Congressman Paul Ryan, the Chairman of the House Budget Committee, has made a comprehensive proposal for deficit reduction, including major changes to Medicare and Medicaid. The Republican proposal, passed by the House on April 15, 2011 along a party line vote, would significantly reduce federal Medicaid spending and fundamentally alter the current entitlement structure and financing of the Medicaid program.
In this paper, we focus on the Medicaid provisions in the House Budget Plan, which would have significant implications for the populations served by the program, providers, states and localities, and would affect Medicaid’s ability to maintain its current roles in the health system. In this analysis we will focus on the effect of the House Budget Plan for Medicaid on spending, enrollment, states and some providers. The House Budget Plan includes two major provisions relevant to Medicaid. First, it would repeal the Affordable Care Act (ACA), which includes a major expansion of Medicaid with mostly federal funding to nearly all non-elderly individuals, including adults without dependent children, up to 138 percent of poverty. The repeal of ACA would result in substantial reductions in currently-projected Medicaid enrollment and federal spending. Second, the House Budget Plan would convert existing Medicaid financing from open-ended, matched federal spending for eligible individuals to a block grant under which federal spending is capped annually by state and is distributed based on a formula rather than actual costs. In exchange for capped federal spending, the proposal would give states additional flexibility to design their Medicaid programs although any federal requirements are not defined. The
block grant would start in 2013 and grow annually with population growth and with inflation (CPI-U).2
Since these growth levels are below the expected growth in Medicaid spending, the federal government would realize significant savings.
With federal spending reduced compared to current law projections, the House Budget Plan is expected to result in federal savings of $1.4 trillion over the 2012 to 2022 period with approximately $610 billion in savings resulting from the repeal of ACA and an additional $750 billion in savings from converting Medicaid to a block grant and limiting federal spending growth rates. The Congressional Budget Office concluded that although “states would have additional flexibility to design and manage their Medicaid programs and might achieve greater efficiencies in the delivery of care than they do under current law,
1Authors are based at the Urban Institute.
2 Starting in 2022, the Medicaid block grant payments would be reduced to exclude projected spending for acute care services
or Medicare premiums and cost sharing paid by Medicaid. These payments would be replaced with Medical Savings Accounts.
the large projected reduction in federal payments would probably require states to reduce payments to providers, curtail eligibility for Medicaid, provide less extensive coverage to beneficiaries, or pay more
themselves than would be the case under current law.”3 Further, the fact that federal funds will no
longer adjust to expanding enrollment will make it more difficult for states to respond during recessions. In the face of reduced federal dollars, program cuts are likely because states have held rates of increase in spending per enrollee below those of other payers. As shown in Figure 1, from 2000 to 2009,
Medicaid spending per enrollee increased by 4.6 percent overall, 5.6 percent for acute care, and 3.0 percent for long-term care. The 4.6 percent increase in Medicaid spending per enrollee was slightly above the medical care CPI and GDP during this period, but it was considerably below the growth rate for national health expenditures (both overall and per capita) and also below the growth rate for employer-sponsored health insurance premiums. Medicaid has achieved its relatively low growth rate through a variety of policies, including
strict controls on provider payment rates, widespread use of managed care,
expansion of home and community-based services as an alternative to institutional-ization, and a variety of policies intended
to control prescription drug spending.4
Growth in Medicaid spending has been largely driven by medical cost inflation and growth in enrollment, particularly during the recession from 2007 to 2009. While states would gain additional flexibility under the House proposed block grant, reductions in Medicaid spending growth much below levels experienced in the past seem difficult to achieve.
This analysis provides national and state-by-state estimates of changes in federal spending under the House Budget Plan. We estimate the impact of the changes due to both the elimination of the ACA and to the conversion to a block grant. The analysis also provides estimates of potential reductions in spending for hospitals, the largest category of Medicaid spending by service type.
The analysis then examines the potential impact on changes in enrollment under various scenarios. First, we assume that states make proportional reductions across population groups. We model these
reductions using current law Medicaid spending growth per enrollee and then, assuming states could achieve significant efficiencies, using a somewhat lower growth rate. Second, we provide estimates of a scenario in which states achieve efficiencies in per capita spending growth and largely protect
enrollment for the aged and disabled on Medicaid, thereby disproportionately distributing enrollment reductions to children and non-disabled adults. In another scenario we estimate the amount that state spending would have to increase in order to maintain enrollment as projected under current law without accounting for the Medicaid expansion in ACA.
3 Congressional Budget Office. Long-Term Analysis of a Budget Proposal by Chairman Ryan. April 5, 2011 (Corrected April 8,
2011).
4 Holahan, John and Alshadye Yemane. 2009. “Enrollment Is Driving Medicaid Costs—But Two Targets Can Yield Savings.”
Health Affairs 28(5): 1453-1465.
Figure 1
Medicaid Spending Growth Versus Growth in Various Benchmarks, 2000-2009 8.2% 4.6% 5.6% 3.0% 4.1% 4.0% 3.0% 6.9% 5.9% 7.7% Gross domestic product NHE Medical Care CPI Acute care LTC Total Total Per
Capita CapitaPer
Medicaid services spending per enrollee Medicaid services spending All services ESI premiums
SOURCE:Urban Institute, 2010. Estimates based on data from the Centers for Medicare and Medicaid Services (CMS) Medicaid Financial Management Reports (Form 64).
NOTES:All expenditures exclude prescription drug spending for dual eligibles to remove the effect of their transition to Medicare Part D in 2006. Prescription drug spending for non-dual eligibles is included in acute care Medicaid spending per enrollee.
Methods
To develop state estimates of the House Budget Plan for Medicaid, we first needed to construct baselines of federal and state Medicaid spending by state both including the ACA and assuming the repeal of the ACA. These estimates are consistent with state levels of spending by age group and for acute and long-term care, and they are adjusted to agree with CBO numbers at the national level between 2012 and 2021. Second, we needed to create state-by-state estimates of Medicaid spending under the House Budget Plan, comparing this to the baselines both with and without the ACA to assess changes due to the ACA repeal and due to the conversion to a block grant. Deriving estimates of the implications for spending, enrollment, states and hospital spending all require specific assumptions. We note that some state estimates are subject to uncertainty because of sample size. Thus estimates of increases due to ACA in smaller states are less reliable than in larger states.
Methods for Developing Baseline Estimates
State Expenditures Baseline. We constructed our baseline estimates by starting with the Medicaid Statistical Information System (MSIS) data for 2007 (the most recent year available at the start of this analysis). MSIS includes national and state-by-state data on Medicaid spending. For consistency with CBO national estimates, we inflated the national 2007 MSIS figures on spending for each eligibility group (children, adults, individuals with disabilities, and the elderly) to agree with CBO estimates of national spending by eligibility group for 2012. We then made the same upward or downward adjustment in percentage terms for each individual state that we did for the national estimates; this step preserves the agreement with CBO projections at the national level but maintains state-by-state variation from the MSIS.
The Pre-ACA Baseline. For the period 2012 through 2021, we grew the estimates at the same baseline growth rate underlying CBO projections over this period. The CBO did not publish a pre-ACA or no reform baseline. However, the CBO published, on March 30, 2011, revised estimates of the impact of
the Affordable Care Act for 2012 through 2021.5 These changes from the current law (ACA) baseline
begin in 2014. By subtracting these expenditure and enrollment estimates from the ACA baseline
(March 2011 CBO Medicaid baseline), we estimated our pre-ACA baseline. We then inflated the adjusted MSIS figures described above at the same rate as the pre-ACA baseline for 2012 through 2021. This meant that each state would grow at the same rate over time. These procedures mean that high spending states would have the same relative difference for each eligibility group compared with lower spending states throughout the projection period. Thus, Massachusetts will have a high level of
spending in its baseline because of their current polices and Texas will have a low level of spending in its baseline because of their current policies. But their baselines will grow at the same rate as each other and all other states.
We followed a similar procedure for state-by-state Medicaid spending on Medicare premiums,
disproportionate share hospital payments (DSH), and administration. We inflated national spending for these items to 2012 to agree with 2012 CBO estimates for the nation, and grew each individual state’s spending on these items from 2007 to 2012 by that same rate. For the period 2012 through 2021, we grew the estimates at the same growth rate used by CBO for these services over this period, again using the same growth rate for each state but preserving state differences in levels of spending for these items.
5 Elmendorf, Douglas W. 2011. CBO’s Analysis of the Major Health Care Legislation Enacted in March 2010. Congressional
Simulating the impact of the ACA on States. The final step was to simulate the impact of the ACA. We used the Urban Institute’s Health Insurance Policy Simulation Model (HIPSM) to simulate the impact of the ACA in 2014 to get estimates of the increase in Medicaid enrollment and expenditures in every state. These were then grown at the same rate as CBO’s current law (ACA) baseline for both enrollment and expenditures. If HIPSM estimates at the national level exceeded CBO’s ACA baseline data in any year, then each state was adjusted proportionally downward. The end result is that each state will grow under the ACA at the same rate as CBO’s current law baseline, though from different starting points. The impact of the ACA relative to the CBO baseline will reflect state specific effects. For example, Alabama currently has lower Medicaid eligibility levels for adults and will have a much bigger relative expansion under ACA than New York, which currently extends Medicaid eligibility to adults at relatively higher incomes. The HIPSM identifies Medicaid enrollees by eligibility pathways. Thus, the model applies differential federal match rates for current, expansion, and new eligibles as specified under the law. It is assumed in our modeling effort that states would drop those with incomes above 138% FPL who are eligible through Sections 1115 or 1931 from their Medicaid programs and that these individuals would
enroll in private coverage through exchanges.6
The model data set then is consistent with state levels of spending for each group with relative differences being maintained throughout the projection period. The baseline national data also agrees with the current law (ACA) baseline at the national level between 2012 and 2021.
Methods for Developing House Budget Plan Spending Estimates for Medicaid
The House Budget Plan would repeal ACA and convert Medicaid to a block grant starting in 2013 with federal spending allocated to states based on current expenditures that grow annually at a single national rate. The repeal of ACA is estimated by taking the difference between the current law baseline and the baseline assuming ACA repeal. To estimate spending under the House Budget block grant proposals and to hit the target savings of $750 billion over the 2012 to 2021 period as specified in the House Budget Resolution, we assume that after the repeal of ACA the Medicaid baseline would increase by the CPI-U and by the CBO’s projection of Medicaid enrollment growth prior to reform, approximately
2.6 percent per year.7 We assume this growth rate would be applied to 2010 spending, and projected
forward to 2021.8 We compared state-by-state federal spending under the House Budget Plan to
baseline spending both with and without ACA.
To demonstrate the implications of a reduction in federal Medicaid spending on service providers, we examined how the changes in federal Medicaid spending would translate to changes in payments to
hospitals, the largest single Medicaid provider. Decreases in Medicaid spending will translate to
decreased revenue sources for providers, as fewer Medicaid dollars will flow through the health system. We calculate the share of Medicaid spending in each state attributable to hospitals and assume that this share remains constant through 2021. We then assume state policy changes to reduce Medicaid spending result in proportionate reductions in spending on all services. These cuts could come through reductions in payments and benefits. They could also come via eligibility reductions. States would have to make very deep cuts in other services to avoid proportionate reductions in hospital spending.
6 There are other optional categories which could be affected, but they are more difficult to identify using our model. 7 Congressional Budget Office. March 2010 Medicaid Baseline; this low growth rate occurs because the increase in the CPI is
low in the early years because of continuing slow economic growth, yet Medicaid enrollment is projected to decline slowly because of some albeit slow economic growth.
We used our analysis of state-by-state
federal
Medicaid spending under the House Budget Plan to estimate the potential implications for enrollment in state Medicaid programs under different possible scenarios (described in detail below).Results
Medicaid Spending Under the House Budget Plan
Total Changes in Federal Spending. Figure 2 shows projections for federal spending under three scenarios. Under current law, including the effects of ACA, federal Medicaid spending will total $4.0 trillion over the 2012 to 2021 period. With the repeal of ACA, total federal spending for Medicaid over the same period would be $3.4 trillion. Total spending under the House Budget Plan would be $2.7 trillion. Spending under the House Budget Plan is a $1.4 trillion or 34% reduction over the 2012 to 2021 period compared to current law (with ACA). After accounting for the repeal of ACA, the House Budget Plan represents a $750 billion or 22% reduction in federal Medicaid spending over the 2012 to 2021 period. Thus, the reduction in federal spending under the House Budget Plan that is attributable to the repeal of ACA would be $610 billion and the reduction attributable to the block grant would be $750 billion over the 2012 to 2021 period.
Changes in Federal Spending by State. Table 1 shows cumulative federal spending from 2012 to 2021 by state under current law and under the House Budget Plan. For the U.S. spending under the ACA is $4.0 trillion dollars. Not surprisingly, given their relatively large populations, the largest spending is in
New York ($461.9 billion) followed by California ($
394.4
billion). As noted above, the plan is expectedto reduce federal Medicaid spending by $1.4 trillion over the 2012 to 2012 period. Under the methods used in this analysis, states will experience different percentage reductions in federal spending under the House Budget Plan largely due to the repeal of ACA (Figure 3). The reduction relative to the ACA is greatest in states where the ACA would have the largest impact and smaller in states with greater coverage in the baseline.
Figure 2
Federal Medicaid Spending for Years
2012-2021
0 100 200 300 400 500 600 2010 2011 2012 2013 2014 2015 2016 2017 2018 2019 2020 2021 $ (Billions) Current Law with ACA: $4,017 B (2012-2021) House Budget Plan: $2,657 B (2012-2021) Baseline with ACA Repeal: $3,407 B (2012-2021)Note: The House block grant does not come into effect until 2013 but begins growing from 2010 expenditure levels.
25.7% 25.8%26.3% 26.4%26.6% 27.6%28.9% 28.9%29.7% 30.6% 30.6% 30.6%30.7% 31.0%31.2% 31.4% 31.4% 31.4%31.7% 31.7% 31.8%32.5% 32.9%32.9% 32.9%33.1% 33.3%33.4% 33.9% 33.9%34.6% 34.8% 34.8%35.8% 35.8%36.3% 37.0%37.2% 37.6%37.9% 38.4%39.3% 39.5% 39.5%40.2% 40.9%41.1% 41.4%41.4% 41.6%43.7% 44.4% 0% 5% 10% 15% 20% 25% 30% 35% 40% 45% 50% WashingtonVermont Minnesota District of ColumbiaIowa Rhode IslandMichigan MassachusettsMaine New York New JerseyKansas OklahomaCalifornia PennsylvaniaMissouri Indiana MississippiIllinois Kentucky Nebraska WisconsinOhio South DakotaConnecticut Alabama Montana New HampshireUS TOTAL Idaho Arizona New MexicoHawaii Utah TennesseeVirginia Arkansas North Dakota South CarolinaMaryland Texas North CarolinaLouisiana West VirginiaDelaware Nevada Oregon Georgia ColoradoAlaska Florida Wyoming Figure 3
% Reduction in Federal Spending Under House
Budget Plan Compared to Current Law Baseline
with ACA, 2012 - 2021
Urban Institute estimates the prepared for the Kaiser Commission on Medicaid and the Uninsured, May 2011
States that currently have lower uninsured rates, higher Medicaid eligibility levels and higher participation in Medicaid are expected to experience less of a change in Medicaid enrollment and spending as a result of ACA than the national average. These states would also achieve savings by shifting coverage for populations with incomes above 138 percent of the federal poverty line (FPL) from Medicaid to the new exchanges. For example, spending increases by only relatively small amounts in Massachusetts, Iowa, Minnesota, Vermont, and Washington. Several states have increases in spending in the ACA that are well above the national average. These include Colorado, Florida, Georgia, Louisiana, Nevada, Oregon and Texas. These states are estimated to have the largest increase in enrollment spending under ACA relative to the baseline because they have higher rates of uninsured and lower Medicaid eligibility levels. Thus, these states have the largest decrease in federal Medicaid spending due to the repeal of ACA under the House Budget Plan.
In this analysis, the House Budget Plan to block grant Medicaid would reduce Medicaid spending by $750 billion over the 2012 to 2021 period, or 22 percent relative to the baseline with the repeal of ACA. There is not substantial variation in the percentage reduction across states in our analysis. Essentially each group - the aged, disabled, adults, and children - would grow at slightly different rates specified in the CBO baseline. As a result, baseline growth in each state would be slightly different because of the composition of their populations. However, the plan would achieve a relatively uniform reduction in spending as a percent relative to the ACA repeal baseline because the state baselines are each projected to grow at the same rate assumed by the CBO. The House Budget Plan would also grow by a uniform, though lower, rate in every state.
In reality, the national CBO projections are an average across states. Some states actually would grow faster and others more slowly. States that would have experienced higher growth rates than the national average under current law would experience sharper reductions in federal spending, and vice versa. However, there is no basis for predicting differences in baseline spending growth across states and we do not do so.
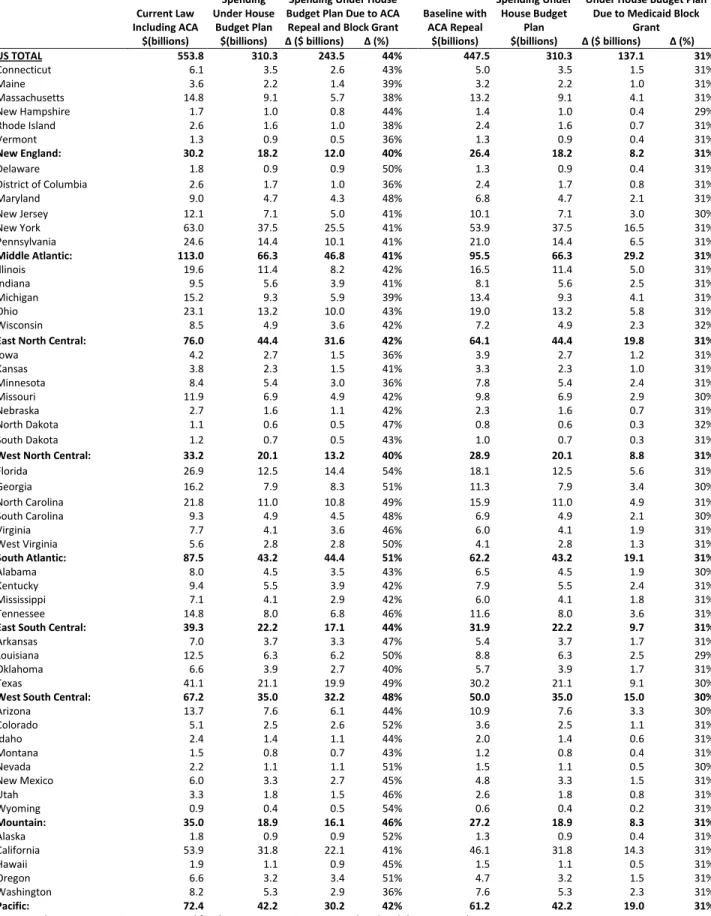
Figure 4 and Table 2 show similar results for the year 2021. Largely due to enrollment growth under the ACA, Medicaid spending under current law increases each year; it is higher in 2021 in percentage terms that it is cumulatively over the 2012-2021
period. Thus in 2021 the House Budget Plan would cut spending by 44 percent relative to the current law baseline with ACA and 31 percent relative baseline with the repeal of ACA. Again, the reductions in federal spending under the House Budget Plan relative to the ACA are greatest in states with large coverage expansions and smallest in states where there is less of an expansion of coverage. States with large coverage expansions due to the ACA will see largest reductions. For example, Florida would see a 54 percent cut; Georgia, Nevada and Oregon 51 percent; Louisiana 50 percent; and Texas 49 percent.
Figure 4
Federal Medicaid Spending in 2021 Under Current Law and the House Budget Plan
$554
$310.3
Spending Under Current Law, Including ACA
Spending under the House Budget Plan
44% Reduction in Spending
Cut due to ACA Repeal: $106B Cut due to Block
Grant: $137B
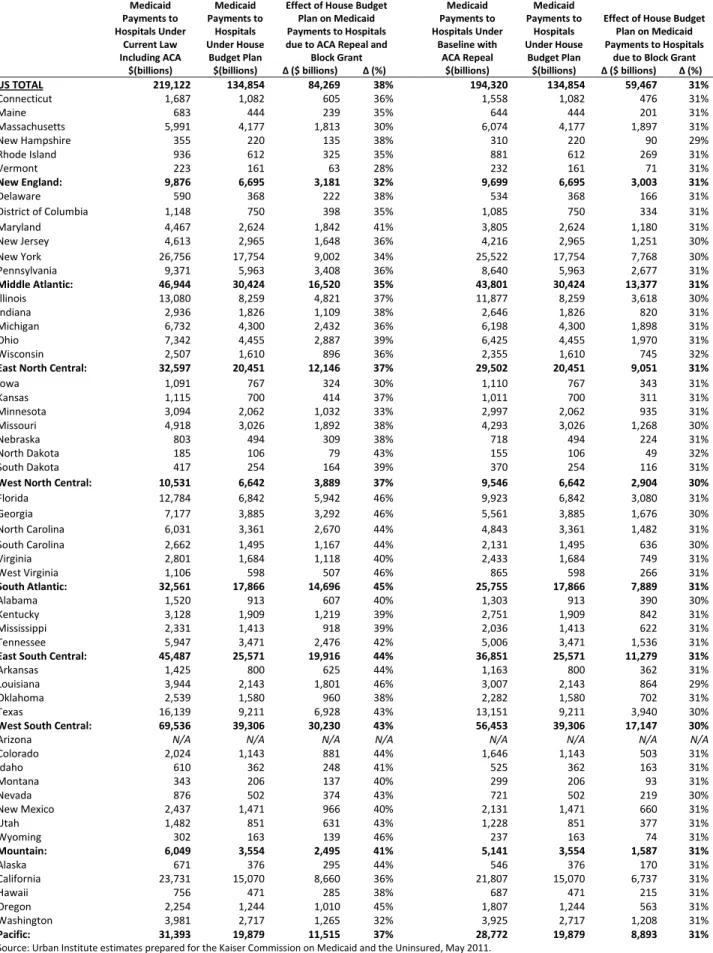
Impact on Hospitals. In Table 3 we look at the impact on hospitals, the largest Medicaid provider. Unlike previous tables, Table 3 includes both federal and state spending. Under current law, including ACA, Medicaid payments to hospitals would be $219 billion, about 25 percent of Medicaid spending, though this percentage varies among states. We project hospital spending in each state based on 2007 MSIS data and assumed the hospital share of the total remains the same. We then estimate reductions in hospital expenditures in 2021. This assumes that states would make equal reductions across all providers. Under the House Budget Plan, Medicaid payments to hospitals would fall by $84.3 billion in 2021 relative to the ACA, or 38 percent. Hospitals would see larger percentage reductions in those states with the largest increases in enrollment due to the ACA. Conversely, there would be smaller reductions, though still sizable, in states with smaller coverage expansions.
We then looked at the impact of the block grant relative to the pre-ACA baseline on hospitals. The effect would be about a 31 percent cut. Again, because both the baseline and the House Budget Plan grow at approximately the same rates, the cuts in hospital payments because of the block grant would be virtually the same in percentage terms across states. This is unlike the impact on hospital spending because of the ACA repeal, which varies in proportion to the extent to which states expand coverage and federal spending increases. Other providers such as physicians, nursing homes, and managed care plans will see reductions in the 31 percent range. For nursing homes in particular, this would be a significant cut since Medicaid accounts for over 40 percent of the nation’s nursing home spending. It is quite likely that states would disproportionally cut other services, particularly services that are now optional. As noted above, hospitals represent 25 percent of Medicaid expenditures and nursing homes represent 18 percent nationally. Services such as physician and clinic services, prescription drugs, institutional care for the intellectually disabled and mentally ill are also difficult to cut. It would thus require enormous cuts in remaining benefits to avoid substantial cuts in hospital and nursing home spending. Thus, these estimates may reflect an upper bound on potential reductions to hospitals under the House Budget Plan.
Implications for Medicaid Enrollment Under House Budget Plan
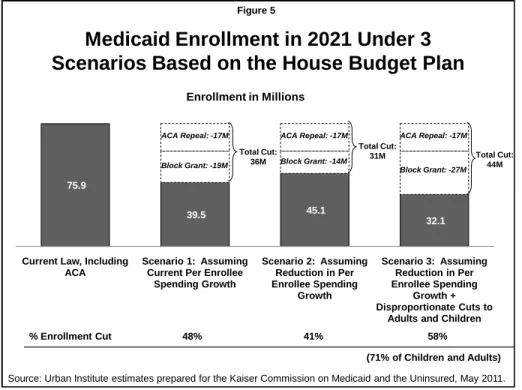
States will make different policy choices in the face of reduced federal spending for Medicaid. We examined the potential impact on enrollment in 2021 due to the reductions in federal spending from the repeal of ACA and the block grant under three possible scenarios: (1) per person spending would grow at rates equal to those projected under current law, and states make proportional reductions across all eligibility groups; (2) states can reduce per person spending growth (thus mitigating the size of the enrollment cuts), and states make proportional reductions across eligibility groups; and (3) states both reduce per person spending growth and protect the elderly and disabled (thus disproportionately distributing enrollment cuts to adults and children). In all of these scenarios, we assume that state spending is reduced by the same percentage as federal spending. Figure 5 summarizes the results from these scenarios.
Scenario (1): Per Person Spending Growth Maintained. In this first scenario, Medicaid spending per enrollee would grow at rates equal to our estimates of the CBO baseline, if the ACA had not been enacted. We project this to be an average increase in spending per enrollee of 6.1 percent between 2012 and 2021, equivalent to growth in gross domestic product (GDP) plus 1.4 percentage points. These relatively high (compared to past trends) rates of spending per enrollee reflect faster growth in the aged and disabled than adults and children, again assuming no reform. (Without the compositional shift into a more expensive population, the assumed spending per enrollee change would be lower and a relatively low growth rate in comparison with that of other third party payers.) Under this assumption, all of the spending reductions would have to come from cuts in enrollment, and we assume that the cuts would be spread equally across all eligibility groups: the aged and disabled as well as the non-disabled adults and children. We estimated the cuts in enrollment by taking total (state and federal) projected Medicaid spending in a year with both the baseline and the House Budget Plan, dividing each by spending per enrollee for each year and deriving the change in the number of enrollees that could be covered at that spending level.
Figure 6 and Table 4 shows the results from our estimates under scenario (1). Under current law including ACA, average monthly Medicaid enrollment would be 75.9 million in 2021. Repealing the ACA in 2021 would reduce enrollment by about 17 million or 22 percent. Similar to changes in spending, the reductions in enrollment are greater in states with the greatest coverage expansions in the ACA, e.g. Florida, Georgia, Louisiana. Applying our assumptions about per person growth in Medicaid spending, the House Budget Plan would lead to an additional 19.4 million people being cut from Medicaid. Counting the impact of the ACA as well as the block grant, the result would be a cut of 36.4 million enrollees, a reduction of 48 percent. If states increase their spending, then the need for enrollment cuts would be much less. If there was no maintenance of effort and they spent less, they could cut state spending even more than federal spending and these enrollment estimates would be understated.
Figure 5
Medicaid Enrollment in 2021 Under 3
Scenarios Based on the House Budget Plan
75.9
39.5 45.1
32.1
Current Law, Including ACA
Scenario 1: Assuming Current Per Enrollee
Spending Growth Scenario 2: Assuming Reduction in Per Enrollee Spending Growth Scenario 3: Assuming Reduction in Per Enrollee Spending Growth + Disproportionate Cuts to
Adults and Children Enrollment in Millions
Source: Urban Institute estimates prepared for the Kaiser Commission on Medicaid and the Uninsured, May 2011. Block Grant: -19M ACA Repeal: -17M Block Grant: -14M ACA Repeal: -17M Block Grant: -27M ACA Repeal: -17M % Enrollment Cut 48% 41% 58%
(71% of Children and Adults) Total Cut:
36M
Total Cut:
31M Total Cut:
32.2%33.0% 38.5%39.6% 39.6%39.6% 40.6%41.5% 42.0%42.4% 43.1%43.7% 46.0%46.1% 46.7%46.9% 47.2%47.3% 48.0% 48.0% 48.0%48.6% 49.4%49.6% 49.6%49.7% 49.9%50.1% 50.1%50.6% 50.8%50.9% 51.7%52.0% 52.1% 52.1%52.4% 52.8% 52.9%53.2% 53.3%53.4% 53.5%53.6% 53.7%54.1% 54.5% 54.5% 54.6%55.1% 55.4%56.1% 0.0% 10.0% 20.0% 30.0% 40.0% 50.0% 60.0% Vermont MassachusettsNew York Iowa Arizona MinnesotaDelaware Maine Rhode Island District of ColumbiaWashington WisconsinMichigan ConnecticutNew Jersey Illinois CaliforniaHawaii MississippiUS TOTAL PennsylvaniaTennessee Alabama New MexicoIndiana Kentucky Maryland North CarolinaVirginia OklahomaOhio West VirginiaNebraska Arkansas MontanaTexas Utah WyomingMissouri South CarolinaColorado Idaho Kansas New HampshireAlaska GeorgiaNevada Louisiana North DakotaFlorida South DakotaOregon
Figure 6
% Enrollment Cuts in 2021 Under House Budget Plan
Assuming Current Law Spending Per Enrollee and
Proportional Reductions Across Eligibility Groups
Urban Institute estimates prepared for the Kaiser Commission on Medicaid and the Uninsured, May 2011
Scenario (2): Reductions in Per Person Spending. The second scenario is that states would achieve substantial efficiencies and reduce the rate of growth in spending per enrollee, which would mitigate the enrollment cuts. We assume that states could reduce the rate of growth in spending per enrollee to the growth in GDP (4.7%), or 1.4 percentage points lower than the previous assumption. Again, this is a lower reduction than it appears because of the compositional shift. By reducing spending per enrollee,
less of the reductions need to come from enrollment cuts.9 As in the first scenario, we estimated the
cuts in enrollment by taking total (state and federal) projected Medicaid spending in a year in both the baseline and the House Budget Plan and dividing by the new and lower level of spending per enrollee, and deriving the change in the number of enrollees that could be covered at that spending level.
Table 4 also shows the estimates from scenario (2). Under these assumptions, states would still need to reduce enrollment by about 13.8 million under the House block grant proposal. Together with the impact of the ACA repeal, Medicaid enrollment would fall by 30.8 million under this assumption, a reduction of 41 percent. While most states cover children under Medicaid with higher incomes, there is significant variation in eligibility levels for adults across states. Most states do not cover childless adults through Medicaid. Over half of all states set eligibility for working parents below 100 percent of
poverty, with 16 states below 50 percent of poverty. For many of these states, it would be extremely difficult to reduce eligibility levels by these amounts. Some states may cap enrollment and use waiting lists.
Scenario (3): Protections for the Aged and Disabled. The third scenario assumes that states would be relatively protective of the aged and disabled. In this scenario, we assume that states would reduce spending for these groups by 10 percent through benefit cuts and payment reductions. The remainder of the reduction in spending comes from spending on adults and children. We assume states reduce spending per enrollee to grow at the rate of GDP. The remainder comes from enrollment cuts. As in the other scenarios, we estimated the cuts in enrollment by taking total (state and federal) projected Medicaid spending in a year and calculating the number of adult and child enrollees that could be covered at that spending level.
Table 5 presents the enrollment impact under this scenario. Nearly all of the impact of the ACA would fall on adults and children, about 17 million, because the goal of the ACA is to primarily expand coverage
for non-disabled adults.10 The block grant itself would reduce coverage by almost 26.8 million adults
and children, even assuming states were successful in controlling spending growth to the rate of increase in GDP. This would mean an overall reduction in enrollment of 58 percent and a reduction in enrollment of adults and children of 71 percent. Again, the biggest reductions would occur for states with largest coverage expansions in the ACA, but the reductions also depend on the amount of spending on the aged and disabled relative to adults and children. In states that have a large share of spending on the aged and disabled, a 10 percent reduction in spending yields more savings, thus the cuts that are necessary on adults and children are somewhat less. On the other hand, states that have relatively few adults and children covered by Medicaid, e.g. North Dakota, Kansas, would have to make greater
9To slow growth rates further than assumed in this analysis would require high levels of cost sharing and substantial reductions
in benefits. As discussed above, Medicaid per capita spending growth over the last decade has been lower than private payers due to strict controls of provider payment rates, widespread use of Medicaid managed care, expansion of home and
community based services as alternatives to institutionalization and a variety of policies intended to control prescription drug spending. While states would gain more flexibility under the block grant, it is still difficult to see a rate of growth below the increase in GDP given historic trends in overall health care spending.
10 Under the ACA, states could define the “medically frail” category of benchmark exempt enrollees to essentially extend the
enrollment cuts to achieve sufficient savings or spend more of their own money. We cannot predict how these cuts would be distributed across adults and children, but the cuts are so large that a typical state would have to eliminate almost all coverage for adults to avoid any cuts for children.
Impact on State Spending to Preserve Eligibility. In this section we estimated how much of an increase in state expenditures would be necessary to ensure that there would be no enrollment reductions. All of the analysis summarized in Table 6 assumes repeal of the ACA and that states would only be attempting to offset the loss of federal revenues because of the block grant.
The results show that states would have to increase expenditures by a substantial amount to avoid enrollment cuts. Under the assumption that they cannot reduce spending per enrollee below GDP plus 1.4 percent, state spending would have to increase by $241 billion or 71 percent (Figure 7). The increases would tend to be greatest in
states with higher federal matching rates. This occurs because the federal government is currently paying a high share of Medicaid spending in such states. If a high matching rate state chose to offset the loss of federal dollars, the increase in spending would be substantially greater than in a state with a lower matching rate. If states were able to control spending to GDP growth, state expenditures would have to increase by $152 billion or 45 percent. Again, the increases are larger in states with higher matching rates.
Conclusion
It is indisputable that the U.S. deficit is a serious matter and that entitlement programs need to be examined as part of a range of options. Both the President’s National Commission on Fiscal
Responsibilities and Reform and the Bipartisan Policy Center Debt Reduction Task Force made serious recommendations for reductions in Medicaid, including emphasis on better managing the care of Medicare and Medicaid dual eligibles and taking steps to reduce the gaming by states of the federal-state matching formula. The President has also put forth a proposal to achieve federal deficit reduction. The House Budget Plan goes much further than the President or either commission.
The House Budget Plan would repeal the ACA and convert Medicaid to a block grant with significant reductions in federal spending. This proposal would make fundamental changes to the financing structure of the program that could shift costs to states and could result in large reductions in enrollment and payments to providers such as hospitals. In aggregate, the proposal would reduce federal Medicaid spending by $1.4 trillion over the 2012 to 2021 period relative to spending under current law with ACA, a 34 percent reduction. The cuts in federal spending in the House Budget Plan would be greatest in the states that would benefit the most in terms of new coverage and new federal revenues from the ACA. These in general are in the south and mountain regions.
Figure 7
Estimated Increase in State Spending in 2021 to Offset Medicaid Enrollment Reductions
Under the House Budget Plan
$339.2 $339.2
$240.8
$152.1
Assuming Current Per Enrollee Spending Growth Assuming Reduction in Per Enrollee Spending Growth
State Baseline Spending With ACA Repeal
New State Spending to Maintain Medicaid Enrollment Under House Budget Block Grant
Source: Urban Institute estimates prepared for the Kaiser Commission on Medicaid and the Uninsured, May 2011.
71% Increase 45% Increase
Of the $1.4 trillion reduction in federal Medicaid spending under the House Budget Plan, $610 billion is due to the repeal of the ACA, and $750 billion is due to the conversion of Medicaid financing to a block grant. The $750 billion reduction represents a 22 percent cut from what Medicaid spending would have been even without ACA
The repeal of ACA along with reductions in federal spending for Medicaid through the block grant would almost inevitably result in dramatic reductions in coverage and similarly dramatic increases in the number of uninsured in the country. Cuts in federal spending would result in large scale reductions in enrollment in Medicaid. This outcome would hold even if states were able to achieve substantial efficiencies by adopting policies to reduce the rate of growth in spending. We examined different scenarios for state responses to reduced federal Medicaid spending and estimate, depending on the specific underlying assumption, that enrollment reductions could range from 31 to 36 million if enrollment cuts were spread across all groups. Under the assumption that there were no cuts in
eligibility and enrollment of the aged and disabled, 44 million adults and children, 58 percent of the total (or 71 percent of adults and children) could be cut even assuming efficiency gains. Most of the people who would lose Medicaid coverage would become uninsured. For example, in Urban Institute modeling of the Affordable Care Act, we found that 84 percent of new Medicaid enrollees would have otherwise been uninsured.11
To avoid enrollment cuts, states would be required to substantially increase their own Medicaid spending to make up for the loss in federal spending. The shift to state spending would be greatest in states that have higher federal Medicaid matching rates, as the federal government is currently paying a high share of Medicaid spending in such states.
We also showed that hospitals could potentially face major reductions in revenues under the House Budget Plan. By 2021, hospitals would face an annual loss of Medicaid revenue of $84 billion relative to the ACA. Some cuts in payments to hospital are inevitable if health care spending is to be reduced, but these reductions are of such a magnitude that they have quite serious implications. For example, the cuts facing hospitals would occur at the same time as a large number of Medicaid beneficiaries would become uninsured, requiring care they would have great difficulty paying for. The burdens of higher levels of uncompensated care facing hospitals would inevitably lead to increased spending by state and local governments.
From the federal perspective, capped financing at lower than anticipated levels will limit liability, make funding predictable and generate savings. In exchange for benefits to the federal budget, these changes could mean shifting costs and risk to states, localities, providers and beneficiaries. Medicaid currently plays a significant role in providing care to many low-income individuals including children, the elderly and individuals with disabilities, financing long-term services and provides support to safety net providers. Medicaid’s ability to continue this role would be significantly compromised under this proposal, with no obvious alternative to take its place.
11Buettgens, Matthew, Garrett, Bowen, and John Holahan. America Under the Affordable Care Act. Robert Wood Johnson
Table 1. Change in Federal Spending Under the House Budget Plan for Years 2012-2021 Current Law Including ACA Spending Under House Budget Plan Total Reduction In Spending Under House Budget Plan Due to ACA
Repeal and Block Grant Baseline with ACA Repeal
Spending Under House Budget
Plan
Reduction in Spending Under House Budget Plan Due to Medicaid Block Grant $(billions) $(billions) ∆ ($ billions) ∆ (%) $(billions) $(billions) ∆ ($ billions) ∆ (%)
US TOTAL 4,017 2,657 1,361 34% 3,407 2,657 750 22% Connecticut 44.3 29.7 14.6 33% 37.9 29.7 8.2 22% Maine 26.8 18.8 7.9 30% 24.3 18.8 5.5 23% Massachusetts 109.4 77.7 31.7 29% 100.7 77.7 23.0 23% New Hampshire 12.5 8.3 4.2 33% 10.4 8.3 2.1 20% Rhode Island 19.3 14.0 5.3 28% 17.9 14.0 3.9 22% Vermont 10.0 7.4 2.6 26% 9.5 7.4 2.1 22% New England: 222.3 156.0 66.3 30% 200.8 156.0 44.8 22% Delaware 12.8 7.6 5.1 40% 9.9 7.6 2.3 23% District of Columbia 19.6 14.4 5.2 26% 18.5 14.4 4.1 22% Maryland 64.6 40.1 24.5 38% 51.8 40.1 11.7 23% New Jersey 87.5 60.7 26.8 31% 76.5 60.7 15.8 21% New York 461.9 320.6 141.3 31% 409.6 320.6 89.0 22% Pennsylvania 179.7 123.7 56.1 31% 159.1 123.7 35.4 22% Middle Atlantic: 826.2 567.2 259.0 31% 725.5 567.2 158.3 22% Illinois 143.5 98.0 45.4 32% 125.9 98.0 27.9 22% Indiana 69.8 47.8 21.9 31% 61.8 47.8 13.9 23% Michigan 111.5 79.2 32.3 29% 101.7 79.2 22.5 22% Ohio 168.1 112.8 55.2 33% 144.7 112.8 31.8 22% Wisconsin 62.2 42.0 20.2 32% 54.5 42.0 12.5 23%
East North Central: 555.0 379.9 175.1 32% 488.5 379.9 108.6 22%
Iowa 31.1 22.8 8.3 27% 29.4 22.8 6.6 22% Kansas 27.9 19.4 8.6 31% 25.0 19.4 5.6 22% Minnesota 62.3 46.0 16.4 26% 59.4 46.0 13.5 23% Missouri 86.5 59.3 27.2 31% 74.9 59.3 15.6 21% Nebraska 19.8 13.5 6.3 32% 17.5 13.5 4.0 23% North Dakota 7.6 4.8 2.8 37% 6.2 4.8 1.4 23% South Dakota 8.9 6.0 2.9 33% 7.7 6.0 1.8 23%
West North Central: 244.2 171.8 72.4 30% 220.2 171.8 48.5 22%
Florida 189.6 106.7 82.8 44% 137.7 106.7 30.9 22% Georgia 115.1 67.5 47.6 41% 86.3 67.5 18.8 22% North Carolina 155.4 94.3 61.1 39% 121.2 94.3 26.8 22% South Carolina 66.6 41.5 25.0 38% 52.6 41.5 11.0 21% Virginia 55.4 35.3 20.1 36% 45.5 35.3 10.2 22% West Virginia 39.8 24.1 15.7 40% 31.0 24.1 6.9 22% South Atlantic: 621.8 369.4 252.4 41% 474.2 369.4 104.8 22% Alabama 58.0 38.8 19.2 33% 49.1 38.8 10.3 21% Kentucky 68.8 47.0 21.8 32% 60.3 47.0 13.3 22% Mississippi 51.7 35.4 16.2 31% 45.3 35.4 9.9 22% Tennessee 106.6 68.5 38.2 36% 88.3 68.5 19.8 22%
East South Central: 285.0 189.6 95.4 33% 242.9 189.6 53.3 22%
Arkansas 50.4 31.8 18.7 37% 41.0 31.8 9.3 23% Louisiana 88.6 53.6 35.0 40% 66.8 53.6 13.2 20% Oklahoma 48.4 33.5 14.9 31% 43.2 33.5 9.7 22% Texas 293.6 181.0 112.6 38% 230.4 181.0 49.4 21%
West South Central: 481.0 299.9 181.2 38% 381.5 299.9 81.6 21%
Arizona 99.5 65.1 34.4 35% 83.7 65.1 18.6 22% Colorado 36.3 21.3 15.0 41% 27.2 21.3 6.0 22% Idaho 17.6 11.6 6.0 34% 15.1 11.6 3.4 23% Montana 10.9 7.3 3.6 33% 9.4 7.3 2.1 23% Nevada 15.3 9.1 6.3 41% 11.6 9.1 2.5 22% New Mexico 43.4 28.3 15.1 35% 36.7 28.3 8.3 23% Utah 24.0 15.4 8.6 36% 19.9 15.4 4.5 23% Wyoming 6.0 3.4 2.7 44% 4.4 3.4 1.0 23% Mountain: 253.1 161.4 91.6 36% 207.9 161.4 46.5 22% Alaska 12.9 7.5 5.4 42% 9.8 7.5 2.2 23% California 394.4 272.2 122.2 31% 350.4 272.2 78.2 22% Hawaii 13.9 9.0 4.8 35% 11.7 9.0 2.7 23% Oregon 46.8 27.6 19.2 41% 35.7 27.6 8.1 23% Washington 60.6 45.0 15.6 26% 57.9 45.0 12.9 22% Pacific: 528.6 361.4 167.2 32% 465.5 361.4 104.1 22%
Table 2. Change in Federal Spending Under House Budget Plan for 2021 Current Law Including ACA Spending Under House Budget Plan Total Reduction In Spending Under House Budget Plan Due to ACA
Repeal and Block Grant Baseline with ACA Repeal
Spending Under House Budget
Plan
Reduction in Spending Under House Budget Plan
Due to Medicaid Block Grant $(billions) $(billions) ∆ ($ billions) ∆ (%) $(billions) $(billions) ∆ ($ billions) ∆ (%)
US TOTAL 553.8 310.3 243.5 44% 447.5 310.3 137.1 31% Connecticut 6.1 3.5 2.6 43% 5.0 3.5 1.5 31% Maine 3.6 2.2 1.4 39% 3.2 2.2 1.0 31% Massachusetts 14.8 9.1 5.7 38% 13.2 9.1 4.1 31% New Hampshire 1.7 1.0 0.8 44% 1.4 1.0 0.4 29% Rhode Island 2.6 1.6 1.0 38% 2.4 1.6 0.7 31% Vermont 1.3 0.9 0.5 36% 1.3 0.9 0.4 31% New England: 30.2 18.2 12.0 40% 26.4 18.2 8.2 31% Delaware 1.8 0.9 0.9 50% 1.3 0.9 0.4 31% District of Columbia 2.6 1.7 1.0 36% 2.4 1.7 0.8 31% Maryland 9.0 4.7 4.3 48% 6.8 4.7 2.1 31% New Jersey 12.1 7.1 5.0 41% 10.1 7.1 3.0 30% New York 63.0 37.5 25.5 41% 53.9 37.5 16.5 31% Pennsylvania 24.6 14.4 10.1 41% 21.0 14.4 6.5 31% Middle Atlantic: 113.0 66.3 46.8 41% 95.5 66.3 29.2 31% Illinois 19.6 11.4 8.2 42% 16.5 11.4 5.0 31% Indiana 9.5 5.6 3.9 41% 8.1 5.6 2.5 31% Michigan 15.2 9.3 5.9 39% 13.4 9.3 4.1 31% Ohio 23.1 13.2 10.0 43% 19.0 13.2 5.8 31% Wisconsin 8.5 4.9 3.6 42% 7.2 4.9 2.3 32%
East North Central: 76.0 44.4 31.6 42% 64.1 44.4 19.8 31%
Iowa 4.2 2.7 1.5 36% 3.9 2.7 1.2 31% Kansas 3.8 2.3 1.5 41% 3.3 2.3 1.0 31% Minnesota 8.4 5.4 3.0 36% 7.8 5.4 2.4 31% Missouri 11.9 6.9 4.9 42% 9.8 6.9 2.9 30% Nebraska 2.7 1.6 1.1 42% 2.3 1.6 0.7 31% North Dakota 1.1 0.6 0.5 47% 0.8 0.6 0.3 32% South Dakota 1.2 0.7 0.5 43% 1.0 0.7 0.3 31%
West North Central: 33.2 20.1 13.2 40% 28.9 20.1 8.8 31%
Florida 26.9 12.5 14.4 54% 18.1 12.5 5.6 31% Georgia 16.2 7.9 8.3 51% 11.3 7.9 3.4 30% North Carolina 21.8 11.0 10.8 49% 15.9 11.0 4.9 31% South Carolina 9.3 4.9 4.5 48% 6.9 4.9 2.1 30% Virginia 7.7 4.1 3.6 46% 6.0 4.1 1.9 31% West Virginia 5.6 2.8 2.8 50% 4.1 2.8 1.3 31% South Atlantic: 87.5 43.2 44.4 51% 62.2 43.2 19.1 31% Alabama 8.0 4.5 3.5 43% 6.5 4.5 1.9 30% Kentucky 9.4 5.5 3.9 42% 7.9 5.5 2.4 31% Mississippi 7.1 4.1 2.9 42% 6.0 4.1 1.8 31% Tennessee 14.8 8.0 6.8 46% 11.6 8.0 3.6 31%
East South Central: 39.3 22.2 17.1 44% 31.9 22.2 9.7 31%
Arkansas 7.0 3.7 3.3 47% 5.4 3.7 1.7 31%
Louisiana 12.5 6.3 6.2 50% 8.8 6.3 2.5 29%
Oklahoma 6.6 3.9 2.7 40% 5.7 3.9 1.7 31%
Texas 41.1 21.1 19.9 49% 30.2 21.1 9.1 30%
West South Central: 67.2 35.0 32.2 48% 50.0 35.0 15.0 30%
Arizona 13.7 7.6 6.1 44% 10.9 7.6 3.3 30% Colorado 5.1 2.5 2.6 52% 3.6 2.5 1.1 31% Idaho 2.4 1.4 1.1 44% 2.0 1.4 0.6 31% Montana 1.5 0.8 0.7 43% 1.2 0.8 0.4 31% Nevada 2.2 1.1 1.1 51% 1.5 1.1 0.5 30% New Mexico 6.0 3.3 2.7 45% 4.8 3.3 1.5 31% Utah 3.3 1.8 1.5 46% 2.6 1.8 0.8 31% Wyoming 0.9 0.4 0.5 54% 0.6 0.4 0.2 31% Mountain: 35.0 18.9 16.1 46% 27.2 18.9 8.3 31% Alaska 1.8 0.9 0.9 52% 1.3 0.9 0.4 31% California 53.9 31.8 22.1 41% 46.1 31.8 14.3 31% Hawaii 1.9 1.1 0.9 45% 1.5 1.1 0.5 31% Oregon 6.6 3.2 3.4 51% 4.7 3.2 1.5 31% Washington 8.2 5.3 2.9 36% 7.6 5.3 2.3 31% Pacific: 72.4 42.2 30.2 42% 61.2 42.2 19.0 31%
Table 3. Potential Impact of House Budget Plan on Federal and State Medicaid Payments to Hospitals, 2021 Medicaid Payments to Hospitals Under Current Law Including ACA Medicaid Payments to Hospitals Under House Budget Plan
Effect of House Budget Plan on Medicaid Payments to Hospitals due to ACA Repeal and
Block Grant Medicaid Payments to Hospitals Under Baseline with ACA Repeal Medicaid Payments to Hospitals Under House Budget Plan
Effect of House Budget Plan on Medicaid Payments to Hospitals
due to Block Grant $(billions) $(billions) ∆ ($ billions) ∆ (%) $(billions) $(billions) ∆ ($ billions) ∆ (%)
US TOTAL 219,122 134,854 84,269 38% 194,320 134,854 59,467 31% Connecticut 1,687 1,082 605 36% 1,558 1,082 476 31% Maine 683 444 239 35% 644 444 201 31% Massachusetts 5,991 4,177 1,813 30% 6,074 4,177 1,897 31% New Hampshire 355 220 135 38% 310 220 90 29% Rhode Island 936 612 325 35% 881 612 269 31% Vermont 223 161 63 28% 232 161 71 31% New England: 9,876 6,695 3,181 32% 9,699 6,695 3,003 31% Delaware 590 368 222 38% 534 368 166 31% District of Columbia 1,148 750 398 35% 1,085 750 334 31% Maryland 4,467 2,624 1,842 41% 3,805 2,624 1,180 31% New Jersey 4,613 2,965 1,648 36% 4,216 2,965 1,251 30% New York 26,756 17,754 9,002 34% 25,522 17,754 7,768 30% Pennsylvania 9,371 5,963 3,408 36% 8,640 5,963 2,677 31% Middle Atlantic: 46,944 30,424 16,520 35% 43,801 30,424 13,377 31% Illinois 13,080 8,259 4,821 37% 11,877 8,259 3,618 30% Indiana 2,936 1,826 1,109 38% 2,646 1,826 820 31% Michigan 6,732 4,300 2,432 36% 6,198 4,300 1,898 31% Ohio 7,342 4,455 2,887 39% 6,425 4,455 1,970 31% Wisconsin 2,507 1,610 896 36% 2,355 1,610 745 32%
East North Central: 32,597 20,451 12,146 37% 29,502 20,451 9,051 31%
Iowa 1,091 767 324 30% 1,110 767 343 31% Kansas 1,115 700 414 37% 1,011 700 311 31% Minnesota 3,094 2,062 1,032 33% 2,997 2,062 935 31% Missouri 4,918 3,026 1,892 38% 4,293 3,026 1,268 30% Nebraska 803 494 309 38% 718 494 224 31% North Dakota 185 106 79 43% 155 106 49 32% South Dakota 417 254 164 39% 370 254 116 31%
West North Central: 10,531 6,642 3,889 37% 9,546 6,642 2,904 30%
Florida 12,784 6,842 5,942 46% 9,923 6,842 3,080 31% Georgia 7,177 3,885 3,292 46% 5,561 3,885 1,676 30% North Carolina 6,031 3,361 2,670 44% 4,843 3,361 1,482 31% South Carolina 2,662 1,495 1,167 44% 2,131 1,495 636 30% Virginia 2,801 1,684 1,118 40% 2,433 1,684 749 31% West Virginia 1,106 598 507 46% 865 598 266 31% South Atlantic: 32,561 17,866 14,696 45% 25,755 17,866 7,889 31% Alabama 1,520 913 607 40% 1,303 913 390 30% Kentucky 3,128 1,909 1,219 39% 2,751 1,909 842 31% Mississippi 2,331 1,413 918 39% 2,036 1,413 622 31% Tennessee 5,947 3,471 2,476 42% 5,006 3,471 1,536 31%
East South Central: 45,487 25,571 19,916 44% 36,851 25,571 11,279 31%
Arkansas 1,425 800 625 44% 1,163 800 362 31% Louisiana 3,944 2,143 1,801 46% 3,007 2,143 864 29% Oklahoma 2,539 1,580 960 38% 2,282 1,580 702 31% Texas 16,139 9,211 6,928 43% 13,151 9,211 3,940 30%
West South Central: 69,536 39,306 30,230 43% 56,453 39,306 17,147 30%
Arizona N/A N/A N/A N/A N/A N/A N/A N/A
Colorado 2,024 1,143 881 44% 1,646 1,143 503 31% Idaho 610 362 248 41% 525 362 163 31% Montana 343 206 137 40% 299 206 93 31% Nevada 876 502 374 43% 721 502 219 30% New Mexico 2,437 1,471 966 40% 2,131 1,471 660 31% Utah 1,482 851 631 43% 1,228 851 377 31% Wyoming 302 163 139 46% 237 163 74 31% Mountain: 6,049 3,554 2,495 41% 5,141 3,554 1,587 31% Alaska 671 376 295 44% 546 376 170 31% California 23,731 15,070 8,660 36% 21,807 15,070 6,737 31% Hawaii 756 471 285 38% 687 471 215 31% Oregon 2,254 1,244 1,010 45% 1,807 1,244 563 31% Washington 3,981 2,717 1,265 32% 3,925 2,717 1,208 31% Pacific: 31,393 19,879 11,515 37% 28,772 19,879 8,893 31%
Table 4. Change in Enrollment Under House Budget Plan, Assuming Cuts are Spread Among All Groups, 2021 Enrollment Under Current Law Including ACA Reduction in Enrollment Due to House Budget
Plan to Repeal ACA
Reduction in Enrollment Due to House Budget Plan to Block
Grant Medicaid
Total Reduction in Enrollment under House Budget Plan
Growth rate: GDP+1.4% GDP GDP+1.4% GDP
State (thousands) ∆ (thousands) ∆ (%) ∆ (thousands) ∆ (thousands) ∆ (thousands) ∆ (%) ∆ (thousands) ∆ (%)
US TOTAL 75,851 16,984 22% 19,404 13,816 36,388 48% 30,800 41% Connecticut 662 131 20% 175 124 305 46% 255 38% Maine 395 50 13% 114 82 164 42% 132 33% Massachusetts 1,437 15 1% 460 332 475 33% 346 24% New Hampshire 199 59 30% 47 33 107 54% 92 46% Rhode Island 228 32 14% 64 46 96 42% 77 34% Vermont 158 1 1% 49 35 51 32% 37 23% New England: 3,080 287 9% 910 651 1,198 39% 939 30% Delaware 213 26 12% 61 44 86 41% 69 33% District of Columbia 192 26 14% 55 40 81 42% 66 34% Maryland 1,007 254 25% 249 179 503 50% 432 43% New Jersey 1,204 240 20% 323 226 562 47% 465 39% New York 5,639 518 9% 1,653 1,173 2,171 39% 1,691 30% Pennsylvania 2,674 594 22% 690 495 1,283 48% 1,088 41% Middle Atlantic: 10,929 1,657 15% 3,028 2,153 4,685 43% 3,810 35% Illinois 2,965 640 22% 751 533 1,391 47% 1,173 40% Indiana 1,339 326 24% 339 243 665 50% 569 42% Michigan 2,336 473 20% 602 429 1,075 46% 902 39% Ohio 2,846 773 27% 671 479 1,445 51% 1,252 44% Wisconsin 1,174 185 16% 327 237 513 44% 423 36%
East North Central: 10,660 2,398 22% 2,689 1,919 5,086 48% 4,317 40%
Iowa 528 56 11% 153 109 209 40% 166 31% Kansas 515 157 31% 118 84 275 53% 241 47% Minnesota 881 86 10% 263 189 349 40% 276 31% Missouri 1,415 425 30% 323 225 748 53% 650 46% Nebraska 326 87 27% 82 59 169 52% 146 45% North Dakota 102 32 31% 24 17 56 55% 49 48% South Dakota 178 57 32% 41 30 99 55% 87 49%
West North Central: 3,946 900 23% 1,005 716 1,905 48% 1,616 41%
Florida 4,261 1,419 33% 930 668 2,349 55% 2,087 49% Georgia 2,482 789 32% 553 390 1,342 54% 1,179 48% North Carolina 2,232 573 26% 544 388 1,118 50% 961 43% South Carolina 1,313 403 31% 296 207 699 53% 611 47% Virginia 1,177 310 26% 280 200 590 50% 510 43% West Virginia 537 146 27% 127 91 273 51% 237 44% South Atlantic: 12,002 3,640 30% 2,731 1,945 6,371 53% 5,586 47% Alabama 1,203 298 25% 296 208 594 49% 506 42% Kentucky 1,112 289 26% 265 189 553 50% 477 43% Mississippi 986 226 23% 247 176 473 48% 402 41% Tennessee 1,903 464 24% 460 328 924 49% 792 42%
East South Central: 5,204 1,277 25% 1,266 899 2,543 49% 2,176 42%
Arkansas 961 271 28% 228 164 499 52% 435 45%
Louisiana 1,633 535 33% 356 244 891 55% 778 48%
Oklahoma 970 258 27% 233 166 491 51% 425 44%
Texas 5,916 1,702 29% 1,380 970 3,082 52% 2,672 45%
West South Central: 9,479 2,766 29% 2,197 1,545 4,963 52% 4,311 45%
Arizona 1,741 209 12% 480 340 689 40% 549 32% Colorado 798 242 30% 184 131 426 53% 373 47% Idaho 300 91 30% 69 50 160 53% 141 47% Montana 159 45 28% 38 27 83 52% 72 45% Nevada 367 117 32% 83 59 200 54% 176 48% New Mexico 685 170 25% 170 122 340 50% 292 43% Utah 438 128 29% 102 73 230 52% 200 46% Wyoming 108 31 29% 26 19 57 53% 50 46% Mountain: 4,596 1,032 22% 1,155 822 2,187 48% 1,855 40% Alaska 170 51 30% 40 29 91 54% 80 47% California 13,395 2,491 19% 3,835 2,746 6,326 47% 5,237 39% Hawaii 282 59 21% 75 54 133 47% 112 40% Oregon 755 249 33% 175 126 424 56% 375 50% Washington 1,353 175 13% 407 291 583 43% 467 34% Pacific: 15,955 3,025 19% 4,523 3,240 7,549 47% 6,265 39%
Table 5. Change in Enrollment Under House Budget Plan, Assuming Disproportionate Share of Spending Reductions Fall on Adults and Children, 2021 Enrollment Under Current Law Including ACA Enrollment of Adults and Children
Under Current Law Including ACA
Reduction in Enrollment Due to House Budget Plan to
Repeal ACA
Reduction in Enrollment Due to House Budget Plan to Block Grant Medicaid
Total Reduction in Enrollment under House Budget Plan
∆ (%)
(thousands) (thousands) ∆ (thousands) ∆ (%) ∆ (thousands) ∆ (thousands) Total Adults & Children US TOTAL 75,851 61,284 16,984 28% 26,791 43,775 58% 71% Connecticut 662 532 131 25% 302 432 65% 81% Maine 395 281 50 18% 175 225 57% 80% Massachusetts 1,437 845 15 2% 539 553 �8% 65% New Hampshire 199 162 59 37% 68 127 64% 79% Rhode Island 228 163 32 19% 95 127 55% 77% Vermont 158 117 1 1% 72 74 47% 63% New England: 3,080 2,101 287 14% 1,237 1,524 49% 73% Delaware 213 177 26 14% 67 93 44% 53% District of Columbia 192 144 26 18% 81 107 56% 74% Maryland 1,007 807 254 31% 380 634 63% 79% New Jersey 1,204 902 240 27% 574 814 68% 90% New York 5,639 4,475 518 12% 2,705 3,224 57% 72% Pennsylvania 2,674 1,925 594 31% 1,026 1,620 61% 84% Middle Atlantic: 10,929 8,431 1,657 20% 4,819 6,477 59% 77% Illinois 2,965 2,461 640 26% 885 1,525 51% 62% Indiana 1,339 1,105 326 29% 453 778 58% 70% Michigan 2,336 1,890 473 25% 831 1,304 56% 69% Ohio 2,846 2,308 773 34% 1,150 1,923 68% 83% Wisconsin 1,174 888 185 21% 601 786 67% 89%
East North Central: 10,660 8,652 2,398 28% 3,796 6,193 58% 72%
Iowa 528 414 56 14% 273 329 62% 79% Kansas 515 415 157 38% 182 339 66% 82% Minnesota 881 678 86 13% 445 531 60% 78% Missouri 1,415 1,143 425 37% 384 809 57% 71% Nebraska 326 269 87 32% 118 205 63% 76% North Dakota 102 83 32 38% 49 81 79% 98% South Dakota 178 149 57 38% 52 109 61% 73%
West North Central: 3,946 3,152 900 29% 1,476 2,377 60% 75%
Florida 4,261 3,411 1,419 42% 1,281 2,700 63% 79% Georgia 2,482 2,062 789 38% 546 1,335 54% 65% North Carolina 2,232 1,766 573 32% 682 1,255 56% 71% South Carolina 1,313 1,088 403 37% 354 757 58% 70% Virginia 1,177 920 310 34% 414 724 61% 79% West Virginia 537 385 146 38% 172 319 59% 83% South Atlantic: 12,002 9,631 3,640 38% 3,423 7,063 59% 73% Alabama 1,203 886 298 34% 340 639 53% 72% Kentucky 1,112 799 289 36% 299 588 53% 74% Mississippi 986 737 226 31% 329 555 56% 75% Tennessee 1,903 1,456 464 32% 485 948 50% 65%
East South Central: 5,204 3,878 1,277 33% 1,432 2,709 52% 70%
Arkansas 961 776 271 35% 360 631 66% 81%
Louisiana 1,633 1,322 535 40% 549 1,084 66% 82%
Oklahoma 970 800 258 32% 277 535 55% 67%
Texas 5,916 4,969 1,702 34% 1,524 3,226 55% 65%
West South Central: 9,479 7,868 2,766 35% 2,621 5,388 57% 68%
Arizona1 1,741 1,515 209 14% 345 554 32% 37% Colorado 798 674 242 36% 287 529 66% 79% Idaho 300 248 91 37% 104 196 65% 79% Montana 159 129 45 35% 55 99 63% 77% Nevada 367 306 117 38% 118 234 64% 77% New Mexico 685 593 170 29% 188 357 52% 60% Utah 438 386 128 33% 114 242 55% 63% Wyoming 108 93 31 34% 39 70 65% 76% Mountain: 4,596 3,943 1,032 26% 1,135 2,167 47% 55% Alaska 170 147 51 35% 43 94 55% 64% California 13,395 11,535 2,491 22% 6,285 8,776 66% 76% Hawaii 282 235 59 25% 85 143 51% 61% Oregon 755 622 249 40% 221 471 62% 76% Washington 1,353 1,091 175 16% 540 716 53% 66% Pacific: 15,955 13,630 3,025 22% 6,987 10,012 63% 73%
1Estimates in spending and enrollment reductions in Arizona may be low because the state reports an unusually low share of enrollment and expenditures for
the aged and disabled; this means the cuts reported in Table 3 are mostly from adults and children and thus, the cuts in Table 4 are similar. Assumes per enrollee spending growth at GDP.
Table 6. Impact of House Block Grant Proposal on State Expenditures to Maintain Medicaid Enrollment, 2021 State Expenditures
Under Baseline with ACA Repeal
New State Spending to Avoid Enrollment Cuts Due to Ryan Block Grant Assuming Cuts Spread Equally Across Eligibility Groups
Growth rate: GDP+1.4% GDP
($ billions) ∆ ($ billions) ∆ (%) ∆ ($ billions) ∆ (%)
US TOTAL 339.2 240.8 71% 152.1 45% Connecticut 5.0 3.1 61% 1.9 39% Maine 1.8 1.5 88% 1.0 56% Massachusetts 13.2 8.2 63% 5.3 40% New Hampshire 1.4 0.8 58% 0.5 35% Rhode Island 2.1 1.4 64% 0.9 41% Vermont 0.9 0.6 76% 0.4 48% New England: 24.3 15.6 64% 9.9 41% Delaware 1.3 0.8 62% 0.5 40% District of Columbia 1.0 1.1 103% 0.7 65% Maryland 6.8 4.2 62% 2.7 40% New Jersey 10.1 6.0 59% 3.7 37% New York 53.8 32.8 61% 20.6 38% Pennsylvania 17.4 11.9 68% 7.6 43% Middle Atlantic: 90.4 56.8 63% 35.8 40% Illinois 16.2 10.0 61% 6.3 39% Indiana 4.5 3.9 87% 2.5 55% Michigan 8.8 6.8 77% 4.3 49% Ohio 11.6 9.4 81% 5.9 51% Wisconsin 4.9 3.8 78% 2.5 50%
East North Central: 46.0 33.9 74% 21.4 47%
Iowa 2.3 1.9 83% 1.2 52% Kansas 2.2 1.7 77% 1.1 49% Minnesota 7.8 4.9 62% 3.1 40% Missouri 5.7 4.6 80% 2.8 50% Nebraska 1.6 1.2 77% 0.8 49% North Dakota 0.5 0.4 86% 0.3 55% South Dakota 0.6 0.5 84% 0.3 54%
West North Central: 20.6 15.2 73% 9.6 46%
Florida 14.6 10.1 70% 6.5 44% Georgia 6.2 5.3 85% 3.3 53% North Carolina 8.7 7.5 86% 4.8 55% South Carolina 3.0 2.9 100% 1.8 62% Virginia 5.9 3.7 62% 2.3 39% West Virginia 1.4 1.7 118% 1.1 75% South Atlantic: 39.8 31.2 79% 19.7 50% Alabama 3.0 2.8 94% 1.8 58% Kentucky 3.4 3.5 103% 2.2 65% Mississippi 1.9 2.4 127% 1.5 80% Tennessee 6.4 5.5 86% 3.5 55%
East South Central: 14.7 14.2 97% 9.0 61%
Arkansas 2.0 2.3 115% 1.5 73%
Louisiana 3.5 3.5 100% 2.2 61%
Oklahoma 2.9 2.6 90% 1.7 57%
Texas 20.6 15.2 74% 9.5 46%
West South Central: 29.0 23.7 82% 14.8 51%
Arizona1 5.7 5.0 89% 3.2 56% Colorado 3.6 2.2 61% 1.4 39% Idaho 0.9 0.9 103% 0.6 66% Montana 0.6 0.6 98% 0.4 63% Nevada 1.5 0.9 61% 0.6 38% New Mexico 2.0 2.1 106% 1.3 68% Utah 1.1 1.1 105% 0.7 67% Wyoming 0.6 0.4 62% 0.2 40% Mountain: 15.8 13.2 83% 8.3 53% Alaska 1.3 0.8 63% 0.5 40% California 45.9 28.4 62% 18.1 39% Hawaii 1.3 0.9 70% 0.6 45% Oregon 2.8 2.3 83% 1.5 53% Washington 7.3 4.6 63% 2.9 40% Pacific: 58.6 37.0 63% 23.5 40%
1 3 3 0 G ST R E E T N W , WA S H I N G T O N, D C 2 0 0 0 5 PH O N E: ( 2 0 2 ) 3 4 7 - 5 2 7 0 , FA X: ( 2 0 2 ) 3 4 7 - 5 2 7 4
WE B S I T E: W W W.K F F.O R G/ K C M U
A d d i t i o n a l c o p i e s o f t h i s r e p o r t ( # 0 0 0 0 ) a r e a v a i l a b l e o n t h e K a i s e r F a m i l y F o u n d a t i o n ’ s w e b s i t e a t w w w . k f f . o r g .
The Kaiser Commission on Medicaid and the Uninsured provides information and analysis on health care coverage and access for the low-income population, with a special focus on Medicaid’s role and coverage of the uninsured. Begun in 1991 and based in the Kaiser Family Foundation's Washington, DC office, the Commission is the largest operating program of the Foundation. The Commission's work is conducted by Foundation staff under the guidance of a bi-partisan group of national leaders and experts in health care and public policy.