R E S E A R C H A R T I C L E
Open Access
Gene- or region-based association study via
kernel principal component analysis
Qingsong Gao
1, Yungang He
2,3, Zhongshang Yuan
1, Jinghua Zhao
4, Bingbing Zhang
1and Fuzhong Xue
1*Abstract
Background:In genetic association study, especially in GWAS, gene- or region-based methods have been more popular to detect the association between multiple SNPs and diseases (or traits). Kernel principal component analysis combined with logistic regression test (KPCA-LRT) has been successfully used in classifying gene expression data. Nevertheless, the purpose of association study is to detect the correlation between genetic variations and disease rather than to classify the sample, and the genomic data is categorical rather than numerical. Recently, although the kernel-based logistic regression model in association study has been proposed by projecting the nonlinear original SNPs data into a linear feature space, it is still impacted by multicolinearity between the projections, which may lead to loss of power. We, therefore, proposed a KPCA-LRT model to avoid the multicolinearity.
Results:Simulation results showed that KPCA-LRT was always more powerful than principal component analysis combined with logistic regression test (PCA-LRT) at different sample sizes, different significant levels and different relative risks, especially at the genewide level (1E-5) and lower relative risks (RR = 1.2, 1.3). Application to the four gene regions of rheumatoid arthritis (RA) data from Genetic Analysis Workshop16 (GAW16) indicated that KPCA-LRT had better performance than single-locus test and PCA-LRT.
Conclusions:KPCA-LRT is a valid and powerful gene- or region-based method for the analysis of GWAS data set, especially under lower relative risks and lower significant levels.
Background
It is commonly believed that genetic factors play an important role in the etiology of common diseases and traits. With rapid improvements in high-throughout gen-otyping techniques and the growing number of available markers, genome-wide association studies (GWAS) have been promising approaches for identifying common genetic variants. The first successful wave of GWAS has reproducibly identified hundreds of associations of com-mon genetic variants with more than 100 diseases and traits, including age-related macular degenerative dis-eases [1], Parkinson’s disease [2] and type 2 diabetes [3,4]. Recently GWAS meta-analysis, which combines the evidence for association from individual studies with appropriate weights, is becoming an increasingly impor-tant method to identify new loci of complex disease and
traits [5-7]. Although this has improved our understand-ing of the genetic basis of these complex diseases and traits, and has provided valuable clues to their allelic architecture, there are still many analytic and interpreta-tion challenges in GWAS [8-11]. For both GWAS and GWAS meta-analysis, it is customary to run single-locus association tests in the whole genome to identify causal or associated single nucleotide polymorphisms (SNPs) with strong marginal effects on disease or traits. How-ever, such a SNP-by-SNP analysis leads to computational burden and the well-known multiplicity problem, with a highly inflated risk of type I error and decreased ability to detect modest effects. One way to deal with these and related challenges is to consider higher units for the ana-lysis such as genes or regions. Several studies have shown that treating gene or region instead of SNP as the unit of association may alleviate the problems of intensive com-putation and multiple testing [8,10], lead to more stable results and higher interpretability [12,13], be regarded as good standards for subsequent replication studies [14] * Correspondence: [email protected]
1
Department of Epidemiology and Health Statistics, School of Public Health, Shandong University, Jinan 250012, China
Full list of author information is available at the end of the article
© 2011 Gao et al; licensee BioMed Central Ltd. This is an Open Access article distributed under the terms of the Creative Commons Attribution License (http://creativecommons.org/licenses/by/2.0), which permits unrestricted use, distribution, and reproduction in any medium, provided the original work is properly cited.
and suit for network (or pathway) approaches to interpret the finds from GWAS [15].
However, given the SNPs allocated into genes or regions, the issue of how to evaluate genetic association for each candidate gene or genome region remains. To examine whether multiple SNPs in the candidate gene or region are associated with disease or trait, several multi-marker analysis methods have been developed, including haplotype-based methods [16,17], Hotelling’s
T2
test [18,19], principal component analysis (PCA)-based methods [20-23], and P-value combination meth-ods [11,24,25]. Especially, the PCA-based methmeth-ods have been shown to be as or more powerful than standard joint SNP or haplotype-based tests [23]. PCA can cap-ture linkage disequilibrium information within a candi-date gene/region, but is less computationally demanding compared to haplotype-based analysis. It also avoids multicolinearity between SNPs, for the principal compo-nents (PCs) are orthogonal.
However, one cannot assert that linear PCA will always detect all structure in a given genomic data set. If the genomic data contains nonlinear structure, PCA will not be able to detect it [26]. Furthermore, it is well known that PCA can not accurately represent non-Gaussian distribu-tions. Up to now, many researchers have introduced appropriate nonlinear process into PCA and developed nonlinear PCA algorithms [27-31]. Among these modified PCA methods, the kernel PCA (KPCA) is the most well known and widely adopted [27-30], which has several advantages than other methods: (1) it does not require nonlinear optimization, but just the solution of an eigenva-lue problem; (2) it provides a better understanding of what kind of nonlinear features are extracted: they are principal components in a feature space which is fixed a priori by choosing a kernel function; (3) it comprises a fairly general class of nonlinearities by the possibility to use different kernels.
KPCA has been studied intensively in the last several years in the field of machine learning, face recognition and data classification, and has been claimed success in many applications [27-30]. Especially, for classifying tumour samples, Liu et al proposed to combine KPCA with logistic regression test (KPCA-LRT) by gene expression data [30]. Nevertheless, the purpose of association study is to detect the correlation between genetic variations and disease rather than to classify the sample, and the genomic data is categorical rather than numerical. Recently, Wu et al proposed a kernel-based logistic regression model to detect the association between multiple SNPs and disease by projecting the nonlinear original SNPs data into a linear feature space [32]. However, the logistic model is still impacted by multicolinearity between the projections, which may lead to loss of power. We, therefore, propose a KPCA-LRT model to avoid the multicolinearity. The
algorithm conducts KPCA first to account for the non-linear relationship between SNPs in a candidate region, and then apply LRT to test the association between kernel principal components (KPCs) scores and diseases. Simula-tions and real data application are conducted to evaluate its performance in association study.
Methods
PCA
As a traditional multivariable statistical technique, PCA has been widely applied in genetic analysis, both for reduction of redundant information and interpretation of multiple SNPs. The basic idea of PCA is to efficiently represent the data by decomposing a data space into a linear combination of a small collection of bases consist-ing of orthogonal axes that maximally decorrelate the data. Assuming thatMSNPs in a candidate gene or spe-cific genome region of interests have coded values {xiÎ
RM|i= 1,2,...,N}, whereNrepresents sample size giving
a genetic model (assuming additive model here). PCA diagonalizes the covariance matrix of the centered observationsxi, N i=1 xi= 0, defined as C= 1 N N i=1 xixTi (1)
To do this, one has to solve the following eigenvalue problem:
Cv=λv (2)
whereνare the eigenvectors ofC, andlare the corre-sponding eigenvalues. AsCv= 1 N N i=1 (xi·v)xi, all
solu-tions νmust lie in the span of {xiÎ RM |i = 1,2,...,N}, hence (2) is equivalent to
λ (xi·v)=xi·Cvfor alli= 1, 2, ..., N,
where the dot product of two vectorsa = (a1, a2, ..., aN) and b = (b1, b2, ..., bN) is defined as a·b= N i=1 aibi=a1b1+a2b2+· · ·+aNbN. KPCA
Given the observations, we first map the data nonli-nearly into a feature spaceFby
:RM →F x→X.
Again, we make the assumption that our data mapped into feature space, F(x1),...,F(xN), is centered, i.e.
¯ C= 1 N N i=1
(xi) (xi)T. To do PCA for the covariance
matrix ¯ C= 1 N N i=1 (xi) (xi)T
we have to find eigenvaluesl ≥0 and eigenvectorsν
ÎF\{0} satisfying
Cv=λv. (3)
By the same argument as above, the solutionsν lie in the span of F(x1),...,F(xN). This implies that we may
consider the equivalent equation λ ( (xi)·v)=
(xi)· ¯Cv
for alli= 1, 2, ..., N (4) and that there exist coefficients ai (i = 1,...,N) such that v= N i=1 αi(xi). (5)
Substituting (3) and (5) into (4), we arrive at
K2α=NλKα (6)
whereadenotes the column vector with entriesa1, ...,
aN, and Kis a symmetric N×Nmatrix defined by
Kij:= ((xi)·(xj)), (7)
It has a set of eigenvectors which spans the whole space, thus
Kα=Nλα (8)
gives all solutionsaof equation (6).
Assume l1 ≤ l2 ≤... ≤lNrepresent the eigenvalues
for the matrix K with a1, a2, ..., aN being the corre-sponding complete set of eigenvectors. lp is the first nonzero eigenvalue. We do the normalization for the solutionsap, ...,aN by requiring that the corresponding vectors inFbe normalized, i.e. νk ·νk= 1 for all k=p,
p+ 1, ...,N. Based on (5), (6) and (8), this translates into 1 =αikαkj (xi)· xj =αk·Kαk =λk αk·αk (9)
We need to compute projections on the eigenvectors νkinFto do principal component extraction. Suppose x
is the SNP set within previously defined gene or genome region of an individual, with an imageF(x) inF, then
(vk·(x)) = N i=1 αk i((xi)·(x)) (10)
are its nonlinear principal components corresponding toF.
Note that neither (7) nor (10) requiresF(xi) in explicit form - they are only needed in dot products. We, there-fore, are able to use kernel functions for computing these dot products without actually performing the map
F: for some choices of a kernel k(xi,xj), by methods of functional analysis, it can be shown that there exists a mapF into some dot product spaceF(possibly of infi-nite dimension) such thatk(xi, xj) can compute the dot product in F. This property is often called “kernel trick” in the literature.
Theoretically, a proper function can be created for each data set based on the Mercer’s theorem of functional analysis [29]. The most common kernel functions include linear kernel, polynomial kernel, radial basis function (RBF) kernel, sigmoid kernel [30], IBS kernel and weighted IBS kernel [32]. In particular, KPCA with linear kernel is the same as standard linear PCA. It is worth noting that in general, the above kernel functions show similar performance if appropriate parameters are cho-sen. In present work, we chose the RBF kernel owing to its flexibility in choosing the associated parameter [33].
There are two widely used approaches for the selection of parameters for a certain kernel function. The first method chooses a series of candidate values for the con-cerned kernel parameter empirically, performs the learning algorithm using each candidate value, and finally assigns the value based on the best performance to the kernel parameter. As is well-known to us, the second one is the cross-validation. However, both approaches are time-consuming and with high computation burden [34]. For RBF kernel applied in present study, there is a popular way of choosing the bandwidth parameters, which is to set it to the median of all pairwise Euclidean distances ||xi-xj|| in the set {xkÎRM|k= 1, 2, ...,N} for all 1≤i<j
≤N[35-37]. Models
To test the associations between multiple SNPs and dis-ease, the PCA-LRT and KPCA-LRT models are defined as follows: Logit[Pr(D= 1|PC1, PC2, . . ., PCL)] =β0+β1PC1+· · ·+βLPCL (11) Logit[Pr(D= 1|KPC1, KPC2, . . ., KPCL)] =β0+β1KPC1+· · ·+βLKPCL (12)
where PCsandKPCsare the firstLthlinear and non-linear (kernel) principal component scores of the SNPs, respectively. The value ofLcan be chosen such that the cumulative contributing proportion of the total variabil-ity explained by the first LPCs (l1 +l2+ ···+lL)/(l1 +
l2 + ··· +lM) exceeds some threshold. For comparison,
we set the same threshold of 80% in both PCA-LRT and KPCA-LRT as Gauderman et al [34].
Data simulation
To assess the performance of KPCA-LRT and compare it with PCA-LRT, we apply a statistical simulation based on HapMap data under the null hypothesis (H0) and
alternative hypothesis (H1). The corresponding steps for
the simulation are as follows:
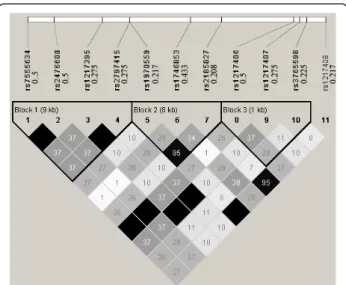
Step 1. Download the phased haplotype data of a gen-ome region from the HapMap web site (http://snp.cshl. org): we select the Protein tyrosine phosphatase, non-receptor type 22 (PTPN22) gene region to generate the simulating genotype data of CEU population using HapMap Phase 1& 2 full dataset. This region is located at Chr 1: 114168639..114197803, including 11 SNPs. Figure 1 shows their pair-wise R2 structure and minor allele fre-quencies (MAF).
Step 2. Based on the HapMap phased haplotype data, we generate large samples with 100 000 cases and 100 000 controls asCEUpopulations using the software HAPGEN [38]. To investigate the performance of the two methods on different causal SNPs with different MAF and different
LD patterns, each of the 11 SNPs was defined as the causal variant. We remove the causal SNP in the simulation to assess the indirect association with disease via correlated markers,. UnderH0, we set the relative risk per allele as
1.0 to assess the type I error. UnderH1, different levels of
relative risks are set (1.1, 1.2, 1.3, 1.4 and 1.5 per allele) to assess the power. The SNPs in this region are coded according to the additive genetic model.
Step 3. From the remained SNPs, we sample the simu-lation data and perform the PCA-LRT and KPCA-LRT under different sample sizes N (N/2 cases and N/2 controls, N = 1000, 2000, ..., 12000) using the R packages kernlab (http://cran.r-project.org/web/ packages/kernlab/index.html) and Design (http://cran.r-project.org/web/packages/Design/index.html). UnderH0,
we repeat 10 000 simulations at two significant levels (0.05 and 0.01). UnderH1, for each model with a given
relative risk, we repeat 10 000 simulations at four signif-icant levels (0.05, 0.01, 1E-5 and 1E-7).
Application
The proposed method is applied to rheumatoid arthritis (RA) data from GAW16 Problem 1. The data consists of 2062 Illumina 550 k SNP chips from 868 RA patients and 1194 normal controls collected by the North Amer-ican Rheumatoid Arthritis Consortium (NARAC) [39]. At present study, only 1493 females (641 cases and 852 controls) are analyzed to avoid potential bias with the fact that rheumatoid arthritis is two to three times more common in women than in men [40].
To illustrate the performance of PCA-LRT and KPCA-LRT, we mainly focus on four special regions in chromo-some 1, within the genes PTPN22, ANKRD35, DUSP23, RNF186 involved, respectively. The reasons are as follows: 1) Both the PTPN22 gene (R620W, rs2476601) and ANKRD35 gene have been reported to be associated with RA [41-43]; 2) DUSP23 can activate mitogen-activated protein kinase kinase [43], which may regulate a pathway in rheumatoid arthritis [44,45]; 3) RNF186 involves a ulcerative colitis-risk loci (rs3806308) [44], and RA may be associated with ulcerative colitis [45].
Results
Data simulation
Type I error
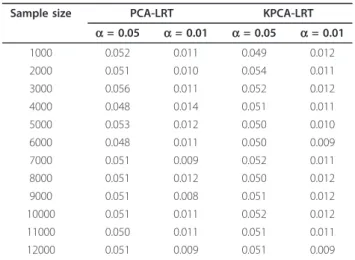
Simulation results underH0are shown in Table 1, which
indicates that the type I error rates of both PCA-LRT and KPCA-LRT are very close to given nominal values (a= 0.01,a= 0.05) under different sample sizes. This suggests that both the models perform well under null hypothesis.
Power
When defining the 6th SNP (rs1746853) as the causal variant, Figure 2 shows the powers of the two models under different significant levels at the given relative Figure 1 Pairwise R2 among the 11 SNPs in the selected
region. The 11 SNPs are: rs7555634, rs2476600, rs1217395, rs2797415, rs1970559, rs1746853, rs2185827, rs1217406, rs1217407, rs3765598, rs1217408. The triangles mark the three haplotype blocks within this region. The value in each diamond is the R2value and the shading indicates the level of LD between a given pair of SNPs. The values to the right of the 11 dbSNP IDs (rs# IDs) are the corresponding minor allele frequencies.
risk of 1.3 and sample size of 3000. It is clear that KLRT is always much more powerful than PCA-LRT, especially at the significant level of 1E-5 (the sug-gested genewide level in Neale and Sham [14]). In the following, only the results at the significant level of 1E-5 are presented.
With the same causal variant as above, Figure 3 shows the powers of the two models under different sample sizes at the given relative risk of 1.3, while Figure 4 shows the powers under different relative risks at the given sam-ple size of 3000. As expected, the powers are monotoni-cally increasing functions of sample sizes and the relative
risk levels for both models. Furthermore, the powers of KPCA-LRT are much higher than PCA-LRT when the sample size is not less than 3000 (Figure 3). Both models are less powerful when RR is less than 1.2. At higher rela-tive risks, KPCA-LRT also shows greater power than Table 1 Type I error of PCA-LRT and KPCA-LRT
Sample size PCA-LRT KPCA-LRT
a= 0.05 a= 0.01 a= 0.05 a= 0.01 1000 0.052 0.011 0.049 0.012 2000 0.051 0.010 0.054 0.011 3000 0.056 0.011 0.052 0.012 4000 0.048 0.014 0.051 0.011 5000 0.053 0.012 0.050 0.010 6000 0.048 0.011 0.050 0.009 7000 0.051 0.009 0.052 0.011 8000 0.051 0.012 0.050 0.012 9000 0.051 0.008 0.051 0.012 10000 0.051 0.011 0.052 0.012 11000 0.050 0.011 0.051 0.011 12000 0.051 0.009 0.051 0.009 ● ● ● ● 0. 00 .20 .40 .60 .81 .0 Significant level P owe r ● legend PCA KPCA
Power for RR=1.3 and sample_size=3000
0.05 0.01 1E−5 1E−7
Figure 2The powers of PCA-LRT and KPCA-LRT under different significant levels at the given relative risk of 1.3 and sample size of 3000. The horizontal axis denotes the significant levels and the vertical axis denotes the powers of PCA-LRT and KPCA-LRT.
● ● ● ● ● ● ● ● ● ● ● ● 2000 4000 6000 8000 10000 12000 0. 00 .20 .40 .60 .81 .0 Sample size P owe r ● legend PCA KPCA Power for RR=1.3
Figure 3The powers of PCA-LRT and KPCA-LRT under different sample sizes at the given relative risk of 1.3. The horizontal axis denotes the sample sizes and the vertical axis denotes the powers of PCA-LRT and KPCA-LRT.
● ● ● ● ● 0. 00 .20 .40 .60 .81 .0 Relative risk P owe r ● legend PCA KPCA
Power for sample_size=3000
1.1 1.2 1.3 1.4 1.5
Figure 4The powers of PCA-LRT and KPCA-LRT under different relative risks at the given of sample sizes 3000. The horizontal axis denotes the relative risks and the vertical axis denotes the powers of PCA-LRT and KPCA-LRT.
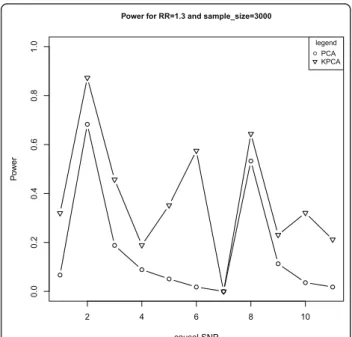
PCA-LRT. Especially at the relative risks of 1.3, the power of PCA-LRT is close to zero while it is about 0.6 for KPCA-LRT (Figure 4). Figure 5 shows the powers of both models at the given sample size of 3000 and relative risk of 1.3 when each of the 11 SNPs is set as the causal variant. Interestingly, KPCA-LRT is always more power-ful than PCA-LRT in each case.
These simulation results indicate that the powers of KPCA-LRT are always higher than PCA-LRT at given sig-nificant levels, sample sizes and relative risks. Particularly, under lower relative risk (1.2 and 1.3) and smaller signifi-cant levels (1E-5 and 1E-7), KPCA-LRT is more powerful than PCA-LRT.
Application
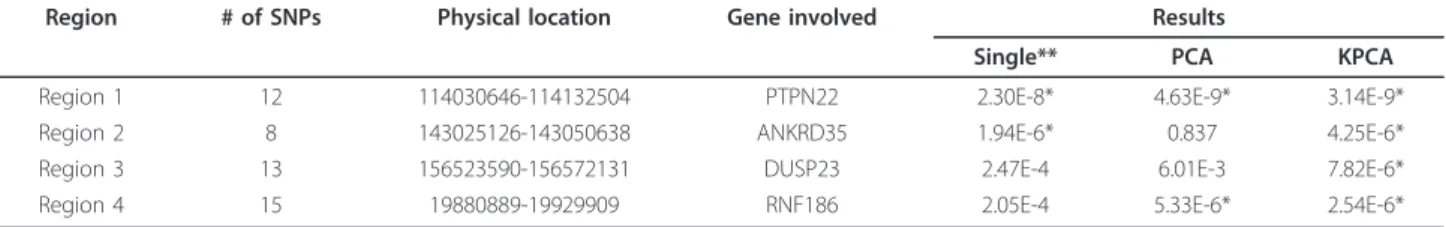
Table 2 shows the information of the selected four regions and the performances of PCA-LRT, KPCA-LRT and single-locus test. For region 1, the statistical significances at the given nominal level (1E-5) were detected by all the three methods. For region 2, the same significance was found by both single-locus test and KPCA-LRT, while PCA-LRT did not identify this region. Only the KPCA-LRT detected the significance for region 3, and both PCA-LRT and KPCA-LRT iden-tified significance for region 4. These results suggested that KPCA-LRT performs the best among the three methods.
Discussion
In genetic association study, especially in GWAS, in order to avoid the collinearity among SNPs and reduce the false positive rate caused by multiple testing, several groups have proposed PCA-based methods and found that these methods are typically as or more powerful than both single locus test and haplotype-based test [20-23]. However, it is not enough to just consider the linear relationship between SNPs, and the PCA-based methods will lose power when the nonlinear relationship exists in the genome. In this paper, based on the ideas of Wu et al [32] and Liu et al [32], we combined KPCA with LRT to propose the KPCA-LRT model for detecting the association between multiple SNPs and diseases. The simulation results (Table 1, Figure 2 to Figure 5) showed that KPCA-LRT performed well under null hypothesis, and all the powers of KLRT were higher than PCA-LRT at given significant levels, sample sizes and relative risks, especially under lower relative risk (1.2 and 1.3) with smaller significant levels (1E-5 and 1E-7). Specifi-cally, we set five low levels of relative risks (1.1-1.5) because the great majority of the identified risk marker alleles conferred very small relative risks [46]. Our simu-lation results show that KPCA-LRT is much more powerful than PCA-LRT when the sample size is not less than 3000 (Figure 3). Both models are less powerful when RR is lower than 1.2. At higher relative risks, KPCA-LRT also shows greater power than PCA-LRT. Especially at the relative risks of 1.3, the power of PCA-LRT is close to zero while it is about 0.6 for KPCA-PCA-LRT (Figure 4). To investigate the performance of the two methods on different causal SNPs with different MAF and different LD patterns, each of the 11 SNPs is defined as the causal variant. In each case, KPCA-LRT is more powerful than PCA-LRT (Figure 5).
To compare the three methods (single-locus test, PCA-LRT and KPCA-PCA-LRT), the four regions from the RA data in GAW16 Problem 1 (Table 2) are considered in this paper. For region 1, the statistical significances at the given nominal level (1E-5) were detected by all three methods. For region 2, the same significance is found by both single-locus test and KPCA-LRT, while PCA-LRT did not identify this region. There are no reports on the association of region 3 and region 4, but in this paper the results of KPCA-LRT show that there may be susceptible locus in the two regions, and the result of PCA-LRT on region 4 coincided with KPCA-LRT. In conclusion, KPCA-LRT performed the best among the three methods.
The four genes involved in the regions for real data analysis are selected based on prior researches and Gene Ontology [47]. The definition of“region”is very broad, such as a single SNP, a haplotype, a gene set, or interval of constant copy number [8]. To be easily interpreted, ● ● ● ● ● ● ● ● ● ● ● 2 4 6 8 10 0. 00 .20 .40 .60 .81 .0 causal SNP P owe r ● legend PCA KPCA
Power for RR=1.3 and sample_size=3000
Figure 5The powers of PCA-LRT and KPCA-LRT at the given sample size of 3000 and relative risk of 1.3 when each of the 11 SNPs was set as the causal variant. The horizontal axis denotes the positions of the causal variant and the vertical axis denotes the powers of PCA-LRT and KPCA-LRT.
genes or genome regions are often defined based on the biological knowledge, such as Gene Ontology and KEGG [48]. For large genes or regions, it is hard to fine map the causal SNPs or associated markers even if association between the whole genes or regions could be detected. Recently sliding-window scan approaches have been widely used to partition the large genes or regions into many overlapping/non-overlapping regions [49,50]. Then the proposed gene- or region-based methods can be used in each region.
There are several limitations about the proposed method. First, only one causal SNP is considered in pre-sent work. Second, how to fix the kernel function with appropriate parameters for each data is still a theoretical problem. Third, when the effect size is smaller (relative risk per allele = 1.1, see Figure 3), both PCA-LRT and KPCA-LRT are less powerful. Fourth, all the frequencies of the causal SNPs are higher than 0.05, so it is hard to decide whether the proposed method is powerful for rare variants. The last, the proposed KPCA-LRT is based on logistic regression, so it could not deal with quantitative traits. To do this, KPCA-based methods could be com-bined with e.g. multivariate regression analysis or partial least squares (PLS) [51]. Further work to solve such pro-blems will certainly be warranted.
Conclusions
In present study, we have proposed a KPCA-LRT model for testing associations between a candidate gene or gen-ome region with diseases (or traits). Results from both simulation studies and application to real data show that KPCA-LRT with appropriate parameters is always as or more powerful than PCA-LRT, especially under lower relative risks and significant levels.
Acknowledgements
This work was supported by the grant from National Natural Science Foundation of China (30871392). We thank NARAC for providing us with the data.
Author details
1Department of Epidemiology and Health Statistics, School of Public Health,
Shandong University, Jinan 250012, China.2CAS-MPG Partner Institute for
Computational Biology, Shanghai Institutes for Biological Sciences, Chinese Academy of Sciences, Shanghai 200031, China.3Key Laboratory of
Computational Biology, CAS-MPG Partner Institute for Computational Biology, Chinese Academy of Sciences, Shanghai 200031, China.4MRC Epidemiology Unit, Institute of Metabolic Science, Addenbrooke’s Hospital, Cambridge, UK.
Authors’contributions
QSG, YGH, ZSY, JHZ, BBZ and FZX conceptualized the study, acquired and analyzed the data and prepared for the manuscript. All authors approved the final manuscript.
Competing interests
The authors declare that they have no competing interests.
Received: 8 May 2011 Accepted: 26 August 2011 Published: 26 August 2011
References
1. Klein RJ, Zeiss C, Chew EY, Tsai JY, Sackler RS, Haynes C, Henning AK, SanGiovanni JP, Mane SM, Mayne ST,et al:Complement factor H polymorphism in age-related macular degeneration.Science2005,
308(5720):385-389.
2. Maraganore DM, de Andrade M, Lesnick TG, Strain KJ, Farrer MJ, Rocca WA, Pant PV, Frazer KA, Cox DR, Ballinger DG:High-resolution whole-genome association study of Parkinson disease.Am J Hum Genet2005,77(5):685-693. 3. Saxena R, Voight BF, Lyssenko V, Burtt NP, de Bakker PI, Chen H, Roix JJ,
Kathiresan S, Hirschhorn JN, Daly MJ,et al:Genome-wide association analysis identifies loci for type 2 diabetes and triglyceride levels.Science
2007,316(5829):1331-1336.
4. Zeggini E, Weedon MN, Lindgren CM, Frayling TM, Elliott KS, Lango H, Timpson NJ, Perry JR, Rayner NW, Freathy RM,et al:Replication of genome-wide association signals in UK samples reveals risk loci for type 2 diabetes.Science2007,316(5829):1336-1341.
5. de Bakker PI, Ferreira MA, Jia X, Neale BM, Raychaudhuri S, Voight BF:
Practical aspects of imputation-driven meta-analysis of genome-wide association studies.Hum Mol Genet2008,17(R2):R122-128.
6. Lindgren CM, Heid IM, Randall JC, Lamina C, Steinthorsdottir V, Qi L, Speliotes EK, Thorleifsson G, Willer CJ, Herrera BM:Genome-wide association scan meta-analysis identifies three Loci influencing adiposity and fat distribution.PLoS genetics2009,5(6):e1000508.
7. Stahl EA, Raychaudhuri S, Remmers EF, Xie G, Eyre S, Thomson BP, Li Y, Kurreeman FAS, Zhernakova A, Hinks A:Genome-wide association study meta-analysis identifies seven new rheumatoid arthritis risk loci.Nature genetics2010,42(6):508-514.
8. Beyene J, Tritchler D, Asimit JL, Hamid JS:Gene- or region-based analysis of genome-wide association studies.Genet Epidemiol2009,33(Suppl 1): S105-110.
9. Kraft P, Hunter D:Genetic risk prediction–are we there yet?New Engl J Med2009,360(17):1701.
10. Buil A, Martinez-Perez A, Perera-Lluna A, Rib L, Caminal P, Soria J:A new gene-based association test for genome-wide association studies.2009, BioMed Central Ltd: S130..
11. Yang HC, Liang YJ, Chung CM, Chen JW, Pan WH:Genome-wide gene-based association study.BMC Proc2009,3(Suppl 7):S135.
12. Lo S, Chernoff H, Cong L, Ding Y, Zheng T:Discovering interactions among BRCA1 and other candidate genes associated with sporadic breast cancer.Proceedings of the National Academy of Sciences2008,
105(34):12387. Table 2 The performances of single-locus test, PCA-LRT and KPCA-LRT
Region # of SNPs Physical location Gene involved Results
Single** PCA KPCA
Region 1 12 114030646-114132504 PTPN22 2.30E-8* 4.63E-9* 3.14E-9*
Region 2 8 143025126-143050638 ANKRD35 1.94E-6* 0.837 4.25E-6*
Region 3 13 156523590-156572131 DUSP23 2.47E-4 6.01E-3 7.82E-6*
Region 4 15 19880889-19929909 RNF186 2.05E-4 5.33E-6* 2.54E-6*
*significant at the level of 1E-5.
13. Qiao B, Huang CH, Cong L, Xie J, Lo SH, Zheng T:Genome-wide gene-based analysis of rheumatoid arthritis-associated interaction with PTPN22 and HLA-DRB1.BMC Proc2009,3(Suppl 7):S132. 14. Neale BM, Sham PC:The future of association studies: gene-based
analysis and replication.Am J Hum Genet2004,75(3):353-362. 15. Liu JZ, McRae AF, Nyholt DR, Medland SE, Wray NR, Brown KM,
Hayward NK, Montgomery GW, Visscher PM, Martin NG,et al:A versatile gene-based test for genome-wide association studies.Am J Hum Genet
2010,87(1):139-145.
16. Hauser E, Cremer N, Hein R, Deshmukh H:Haplotype-based analysis: a summary of GAW16 Group 4 analysis.Genet Epidemiol2009,33(Suppl 1): S24-28.
17. Pryce JE, Bolormaa S, Chamberlain AJ, Bowman PJ, Savin K, Goddard ME, Hayes BJ:A validated genome-wide association study in 2 dairy cattle breeds for milk production and fertility traits using variable length haplotypes.J Dairy Sci2010,93(7):3331-3345.
18. Xiong M, Zhao J, Boerwinkle E:Generalized T2 test for genome association studies.Am J Hum Genet2002,70(5):1257-1268. 19. Fan R, Knapp M:Genome association studies of complex diseases by
case-control designs.Am J Hum Genet2003,72(4):850-868.
20. Peng Q, Zhao J, Xue F:PCA-based bootstrap confidence interval tests for gene-disease association involving multiple SNPs.BMC Genet2010,11:6. 21. Wang K, Abbott D:A principal components regression approach to
multilocus genetic association studies.Genet Epidemiol2008,
32(2):108-118.
22. Wang X, Qin H, Sha Q:Incorporating multiple-marker information to detect risk loci for rheumatoid arthritis.BMC Proc2009,3(Suppl 7):S28. 23. Gauderman WJ, Murcray C, Gilliland F, Conti DV:Testing association
between disease and multiple SNPs in a candidate gene.Genetic Epidemiology2007,31(5):450-450.
24. Yang HC, Lin CY, Fann CS:A sliding-window weighted linkage disequilibrium test.Genet Epidemiol2006,30(6):531-545.
25. Yang HC, Hsieh HY, Fann CS:Kernel-based association test.Genetics2008,
179(2):1057-1068.
26. Silva S, Botelho C, De Bem R, Almeida L, Mata M:C-NLPCA: Extracting Non-Linear Principal Components of Image Datasets..
27. Mika S, Schlkopf B, Smola A, Müller K, Scholz M, Rtsch G:Kernel PCA and de-noising in feature spaces.Advances in neural information processing systems1999,11(1):536-542.
28. Schlkopf B, Smola A, Müller K:Kernel principal component analysis.
Artificial Neural Networks¡ªICANN’971997, 583-588.
29. Scholkopf B, Smola A, Muller KR:Nonlinear component analysis as a kernel eigenvalue problem.Neural Comput1998,10(5):1299-1319. 30. Liu Z, Chen D, Bensmail H:Gene expression data classification with
Kernel principal component analysis.J Biomed Biotechnol2005,
2005(2):155-159.
31. Kramer MA:Nonlinear Principal Component Analysis Using Autoassociative Neural Networks.Aiche J1991,37(2):233-243. 32. Wu MC, Kraft P, Epstein MP, Taylor DM, Chanock SJ, Hunter DJ, Lin X:
Powerful SNP-set analysis for case-control genome-wide association studies.Am J Hum Genet2010,86(6):929-942.
33. Nguyen VH, Golinval JC:Fault detection based on Kernel Principal Component Analysis.Eng Struct2010,32(11):3683-3691.
34. Zhang DQ, Zhou ZH:Adaptive kernel principal component analysis with unsupervised learning of kernels.Ieee Data Mining2006, 1178-1182. 35. Kwok JT, Tsang IW:Learning with idealized kernels.2003, 400. 36. Jaakkola T, Diekhans M, Haussler D:Using the Fisher kernel method to
detect remote protein homologies.1999, 149-158.
37. Brown MPS, Grundy WN, Lin D, Cristianini N, Sugnet CW, Furey TS, Ares M, Haussler D:Knowledge-based analysis of microarray gene expression data by using support vector machines.Proceedings of the National Academy of Sciences of the United States of America2000,97(1):262. 38. Marchini J, Howie B, Myers S, McVean G, Donnelly P:A new multipoint
method for genome-wide association studies by imputation of genotypes.Nat Genet2007,39(7):906-913.
39. Plenge RM, Seielstad M, Padyukov L, Lee AT, Remmers EF, Ding B, Liew A, Khalili H, Chandrasekaran A, Davies LRL,et al:TRAF1-C5 as a risk locus for rheumatoid arthritis - A genomewide study.New Engl J Med2007,
357(12):1199-1209.
40. Firestein GS:Evolving concepts of rheumatoid arthritis.Nature2003,
423(6937):356-361.
41. Begovich A, Carlton V, Honigberg L, Schrodi S, Chokkalingam A, Alexander H, Ardlie K, Huang Q, Smith A, Spoerke J:A missense single-nucleotide polymorphism in a gene encoding a protein tyrosine phosphatase (PTPN22) is associated with rheumatoid arthritis.The American Journal of Human Genetics2004,75(2):330-337.
42. Carlton V, Hu X, Chokkalingam A, Schrodi S, Brandon R, Alexander H, Chang M, Catanese J, Leong D, Ardlie K:PTPN22 genetic variation: evidence for multiple variants associated with rheumatoid arthritis.The American Journal of Human Genetics2005,77(4):567-581.
43. Källberg H, Padyukov L, Plenge R, Rnnelid J, Gregersen P, van der Helm-van Mil A, Toes R, Huizinga T, Klareskog L, Alfredsson L:Gene-gene and gene-environment interactions involving HLA-DRB1, PTPN22, and smoking in two subsets of rheumatoid arthritis.The American Journal of Human Genetics2007,80(5):867-875.
44. Silverberg MS, Cho JH, Rioux JD, McGovern DPB, Wu J, Annese V, Achkar JP, Goyette P, Scott R, Xu W:Ulcerative colitis-risk loci on chromosomes 1p36 and 12q15 found by genome-wide association study.Nat Genet
2009,41(2):216-220.
45. Boyer F, Fontanges E, Miossec P:Rheumatoid arthritis associated with ulcerative colitis: a case with severe flare of both diseases after delivery.
Ann Rheum Dis2001,60(9):901-901.
46. Manolio T, Brooks L, Collins F:A HapMap harvest of insights into the genetics of common disease.The Journal of clinical investigation2008,
118(5):1590.
47. Ashburner M, Ball CA, Blake JA, Botstein D, Butler H, Cherry JM, Davis AP, Dolinski K, Dwight SS, Eppig JT,et al:Gene ontology: tool for the unification of biology. The Gene Ontology Consortium.Nat Genet2000,
25(1):25-29.
48. Kanehisa M, Goto S:KEGG: kyoto encyclopedia of genes and genomes.
Nucleic Acids Res2000,28(1):27-30.
49. Sha Q, Tang R, Zhang S:Detecting susceptibility genes for rheumatoid arthritis based on a novel sliding-window approach.BMC Proc2009,
3(Suppl 7):S14.
50. Tang R, Feng T, Sha Q, Zhang S:A variable-sized sliding-window approach for genetic association studies via principal component analysis.Ann Hum Genet2009,73(Pt 6):631-637.
51. Wold H:Partial least squares.1985.
doi:10.1186/1471-2156-12-75
Cite this article as:Gaoet al.:Gene- or region-based association study via kernel principal component analysis.BMC Genetics201112:75.
Submit your next manuscript to BioMed Central and take full advantage of:
• Convenient online submission
• Thorough peer review
• No space constraints or color figure charges
• Immediate publication on acceptance
• Inclusion in PubMed, CAS, Scopus and Google Scholar
• Research which is freely available for redistribution
Submit your manuscript at www.biomedcentral.com/submit