458
ENVIRONMENTAL
PROTECTION
T h e F i n n i s h E n v i r o n m e n t
• • • • • • • • • • • • • • • • • • • • • • • • • • • • • • • • •
Finnish Expert Report on
Best Available Techniques in
HELSINKI 2001
Finnish Expert Report on
Best Available Techniques in
Large Combustion Plants
ISBN 952-11-0861-4 ISSN 1238-7312 Taitto: Diaidea Oy Edita Oyj Helsinki 2001 057
The publication is available in the internet: http://www.vyh.fi/eng/orginfo/publica/electro/fe458/fe458.htm
Preface
The European Council Directive on Integrated Pollution Prevention and Control (IPPC Directive 96/61/EC of September 24, 1996) aims at an integrated approach of pollution prevention and control arising from industrial activities listed in its Annex I. The directive requires that “The Commission shall organise an exchange of information between Member States and the industries on best available tech-niques, associated monitoring, and developments in them”. The results of ex-change of information will be published by the Commission as Best available tech-niques reference documents (BREFs) on each industrial activity listed in Annex I. To organise the exchange of information the Commission has set up the so called Sevilla process in order to produce BREFs in all for 33 industrial activities. One of the BREFs will be the BREF on Large Combustion plants (LCP), which ac-cording to the IPPC directive’s Annex I deals with “Combustion installations with rated thermal input exceeding 50 MW”.
The Finnish Environment Institute has set up the national working group on large combustion plants in order to contribute to the Sevilla process and the prep-aration of LCP BREF. In the national LCP working group there are following mem-bers; Mr Ahti Itkonen from North Savo Regional Environment Centre, Mr Jukka Leskelä from Finnish Energy Industries Federation, Mr Pentti Puhakka from Min-istry of Trade and Industry, Mr Juha Pesari from Southeast Finland Regional En-vironment Centre, Mr Eljas Hietamäki from Southwest Finland Regional Environ-ment Centre, Ms Pirjo-Liisa Nurmela from Vaasa Administrative Court, Mr Juha Kouki from UPM-Kymmene Oyj, Mr Tapio Öhman from Helsinki Energy, Mr Kari Kankaanpää from Fortum Power and Heat Oy, Ms Leena Nurmento from Fortum Oyj, Mr Jari Niemelä and Mr Petri Vesa from Pohjolan Voima Oy, Ms Ann-Mari Häkkinen from West Finland Regional Environment Centre, Ms Anneli Karjalai-nen from Ministry of the Environment, Mr Tapio KovaKarjalai-nen from Western Finland Environmental Permit Authority as well as Mr Timo Jouttijärvi, Mr Seppo Ruona-la and Ms Irina HakaRuona-la from Finnish Environment Institute.
National LCP working group has produced this report on the best available techniques in large combustion plants. Report gives a comprehensive review over the LCPs and burned fuels including specialities in the Finnish LCPs. The main emphasis is on the relevant issues where the Finnish LCP operator and boiler/ equipment manufactures have gained experience. In Finland the co-generation of power and heat is existing widely and experiences are positive. Finland has been a pioneer in utilisation of biomass and peat in combustion processes. The co-com-bustion techniques are highly advanced. Specially, the fluidised bed comco-com-bustion technique has been very successful.
Funding for the work was provided by the Finnish Environment Institute, Technology Development Centre Tekes and Finnish Energy Industries Federation Finergy.
Acknowledgements
The report brings together the know-how and experience of experts from energy producers, equipment manufacturers and competent authorities. Fortum Engi-neering Ltd has put together the basic information and the manuscript of the re-port. Authors from Fortum Engineering Ltd were Prof. Timo Korpela (responsibil-ity for the manuscript and chapters 1; 2.1–2.3; 4.8–4.9; 6), Ms Anna-Liisa Leinonen (chapters 4.5–4.6), Mr Tommi Lyyra (chapters 3; 4.1–4.4), Mr Markku Raiko (chap-ters 2.4–2.6) and Dr Jari Puttonen (chapter 4.7). The boiler suppliers Foster Wheel-er EnWheel-ergia Oy, KvaWheel-ernWheel-er Pulping Oy and Fortum EngineWheel-ering Ltd provided the authors with information and illustrations on advanced fluidised bed applications. The practical experience of Fortum Engineering Ltd as a supplier of pulverised fuel
low-NOX burners and desulphurisation plants was indispensable in evaluating the
different available techniques.
Mr Jukka Leskelä from Finnish Energy Industries Federation Finergy, mem-ber of the national LCP working group, was responsible for writing the conclusive chapter five according to the comments and decisions of the national LCP work-ing group.
Contents
Preface ... 3
Acknowledgements ... 4
1
General information ... 9
1.1 Large combustion plants in Finland ... 9
1.1.1 Energy supply ... 9
1.1.2 Large combustion plants ... 9
1.2 Pollutants from large combustion plants ... 11
1.2.1 Development of SO2 and NO2 emissions ... 11
1.2.2 Effect of district heating on air quality ... 12
1.3 Scope of report...13
2
Applied processes and techniques ... 14
2.1 Condensing power plants ... 14
2.1.1 Steam only condensing power plants ... 14
2.1.2 Combined cycle power plants (CCGT) ... 16
2.1.3 Emerging power generation techniques ... 18
2.2 Cogeneration of heat and power (CHP) ... 18
2.3 Fuels used at large combustion plants ... 21
2.3.1 Hard coal and lignite ... 21
2.3.2 Fuel oils ...21
2.3.3 Natural gas ... 22
2.3.4 Peat ...22
2.3.5 Biomass ... 23
2.3.6 Solid recovered fuels for co-firing ... 23
2.3.7 Comparison of fuels ... 25
2.4 Overview of the traditional combustion techniques ... 26
2.4.1 Oil and gas burners ... 26
2.4.2 Pulverised coal and peat combustion ... 27
2.4.3 Grates and stokers ... 27
2.4.4 Gas turbine combustors ... 28
2.5 Fluidised bed combustion ... 29
2.5.1 Description of fluidised bed combustion ... 29
2.5.2 Comparison between bubbling and circulating fluidised bed techniques ... 29
2.5.3 SOX and NOX control in fluidised bed combustion ... 31
2.6 Fuel storage and treatment ... 32
2.6.1 Storage, mechanical treatment and heating ... 32
2.6.2 Gasification and other chemical treatment ... 32
3
Emission balances of selected large combustion plants ... 34
3.1 Peat-fired CFBC boiler ... 34
3.2 Wood-fired BFBC boiler ... 35
3.4 Pulverised coal-fired boiler with semi-dry desulphurisation
and low-NOX burners ... 37
3.5 Gas turbine ...37
3.6 Comparison of the fuels and combustion techniques ... 38
4
Techniques to be considered in the determination of BAT ... 39
4.1 Techniques for reducing SO2 emissions ... 39
4.1.1 Wet scrubbers ... 39
4.1.2 Dry flue gas desulphurisation ... 42
4.1.3 Semi-dry spray towers ... 46
4.1.4 Reduction of SOX emissions in fluidised bed boilers ... 47
4.1.5 Comparison of desulphurisation techniques ... 50
4.2 Techniques for reducing nitrogen oxides ... 51
4.2.1 Primary techniques in burner furnaces ... 51
4.2.2 Primary techniques in fluidised bed combustion ... 56
4.2.3 Secondary measures ... 57
4.2.4 Gas turbine combustors ... 61
4.2.5 Comparison of NOX reduction techniques ... 63
4.3 Reduction of emissions of unburned gases (CO/CXHY) ... 64
4.4 Particulate emissions ... 65
4.4.1 Electrostatic precipitators ... 66
4.4.2 Fabric filters ... 67
4.4.3 Wet scrubbers ... 69
4.4.4 Mechanical separators ... 70
4.4.5 Comparison of particle collection techniques ... 71
4.5 Prevention of water and soil pollution... 72
4.5.1 Oil ...72
4.5.2 Wastewater from water treatment systems ... 72
4.5.3 Cooling water ... 74
4.6 Disposal and utilisation of solid wastes ... 75
4.6.1 Quality of by-products ... 75
4.6.2 Deposition in landfill sites ... 76
4.6.3 Utilisation of by-products ... 76
4.7 Noise reduction techniques ... 77
4.7.1 Theoretical background for noise reduction ... 77
4.7.2 Noise reduction methods ... 78
4.8 Accident risk management ... 80
4.9 Integrated approach to pollution prevention and control ... 81
5
Best available techniques at large combustion plants ... 84
5.1 Energy efficiency ... 85
5.1.1 Energy efficiency of condensing power plants ... 86
5.1.2 Energy efficiency in cogeneration of heat and power (CHP) 86 5.1.3 Improvement of power generation efficiency ... 88
5.2 Reduction of sulphur dioxide emissions ... 88
5.2.1 Large pulverised coal combustion (and oil-fired) plants ... 89
5.2.2 Fluidised bed combustion (FBC) ... 92
5.2.3 Summary of the SO2 emission levels associated to BAT technologies ... 93
5.3 Reduction of nitrogen oxide (NOX) emissions ... 94
5.3.1 Primary NOX control techniques in boiler furnaces ... 94
5.3.2 Primary NOX control techniques in fluidised bed combustion ... 95 5.3.3 Primary NO control techniques in gas turbine combustors 96
5.3.4 Secondary NOX reduction techniques ... 97
5.3.5 NOX emission BAT levels ... 98
5.4 Reduction of particulate and heavy metal emissions ... 99
5.4.1 Reduction of particulate emissions ... 99
5.4.2 Heavy metals ... 100
5.5 Prevention of water and soil pollution... 101
5.5.1 Wastewater treatment ... 101
5.5.2 Cooling water ... 102
5.6 Utilisation and disposal of solid wastes ... 102
5.6.1 Bottom ash and fly ash ... 102
5.6.2 End product of flue gas desulphurisation ... 103
5.7 Noise prevention ... 103
5.8 Operation and maintenance of LCP ... 104
6
Outlook on emerging techniques ... 106
6.1 Power generation technology ... 106
6.1.1 Gas turbine and CCGT ... 106
6.1.2 IGCC and PFBC power plants ... 107
6.1.3 Efficiency improvement at conventional condensing plants ... 108
6.2 Pollution abatement techniques ... 109
6.2.1 Fuel cells and catalytic combustion ... 109
6.2.2 Emerging GT pollution abatement techniques ... 109
6.2.3 Combined SOX/NOX reduction processes ... 110
Acronyms and Definitions ... 112
References and literature ... 116
Appendices ... 120
Appendix 1. Selected Finnish Energy Statistics. ... 120
Appendix 2. Large Combustion Plants in Finland. ... 122
Appendix 3. Trace Metals in Fuels ... 130
Appendix 4. Selected finnish emission statistics ... 131
Appendix 5. Emission Monitoring ... 136
General information
Chapter 1 gives general information on the Finnish energy consumption and sup-ply, focusing on the consumption fuels in large combustion plants. Also time
se-ries of SO2 and NOX as NO2 emissions are given and the environmental benefits
of district heating discussed. Finally, the scope of the report is defined.
1.1 Large combustion plants in Finland
1.1.1 Energy supply
The primary energy consumption in Finland in 1998 amounted to 34.5 Mtoe. Of this, 25.6 Mtoe were fuels and industrial waste heat. The primary energy equiva-lent of nuclear, hydro and imported electricity amounted to 7.5 Mtoe, in which a notional 35 % apparent primary energy efficiency was used. Typical to the Finn-ish energy supply is also the unusually high share of wood and wood residue fu-els, altogether 5.5 Mtoe, i.e. 16 % of the total. The wood based primary energy consists of black liquor (3.2 Mtoe), pulp and paper industry wood and wood resi-due (1.6 Mtoe), and of small scale use of firewood (1.1 Mtoe). Black liquor is the spent cooking liquor from pulp industry. The primary energy consumption per capita in Finland was 6.4 toe in 1997, while the OECD Europe average was 3.4 toe (Energiatilastot 1999).
The Finnish power generation amounted to 67.3 TWh in 1998. Half of it came from the non-fuel nuclear and hydropower. With net imports of 9.6 TWh, the to-tal electricity supply was 76.6 TWh. The per capita consumption of electricity in Finland was 14.5 MWh in 1997, while the OECD Europe average was 5.4 MWh. Another unusual feature is the very high share of cogeneration of power and heat in fuel based power generation. Cogenerated power amounted to 25.2 TWh in 1998, while only 6.9 TWh were generated in conventional coal or peat fired con-densing plants (Energiatilasto 1999).
The in international comparison high per capita consumption of both elec-tricity and primary energy is mainly explained by the strong pulp and paper and basic metal industries. The cold climate and the long transport distances are con-tributing factors, too. Further details of the Finnish energy supply can be found in Appendix 1.
1.1.2 Large combustion plants
Large combustion plants (LCP) in Finland are found among the condensing pow-er plants, cogenpow-eration powpow-er plants for industry and district heating, and among the peaking heat only boilers (HOB) in district heat and industrial heat distribu-tion systems. Convendistribu-tional condensing power plants are the least important of these, because power generation in Finland is dominated by cogeneration, nucle-ar and hydro generation, in this order by annual volume.
Of the total primary energy input, one third consists of (mostly solid) fuels consumed in large combustion plants. Another third consists of other fuel use, mainly oil in transportation and local heating. The rest includes electricity specif-ic non-fuel inputs: nuclear and hydro generation and electrspecif-icity imports.
From the viewpoint of large combustion plants, the special characteristics of the Finnish energy system can be summarised in three rather unusual features:
• the very high share (72 %) of cogeneration as a consumer of LCP fuels,
• the high share (15 %) of biomass and biomass (excl. black liquor) in the LCP
fuel mix,
• the very low share (14 %) of LCP fuels burned in condensing power plants
The high share of cogeneration is largely explained by the high market share of district heating and strong forest industries. The very low share of fossil based condensing power results from the extensive use of cogeneration, nuclear, hydro generation and imported power. A more detailed picture of the estimated Finnish LCP fuel use is given in Table 1 below. Because black liquor is no more included in the figures, coal takes the position of the most important LCP fuel, closely followed by natural gas, peat and biomass. The fuels burned in cogeneration plants consti-tute 72 % of the total LCP fuels.
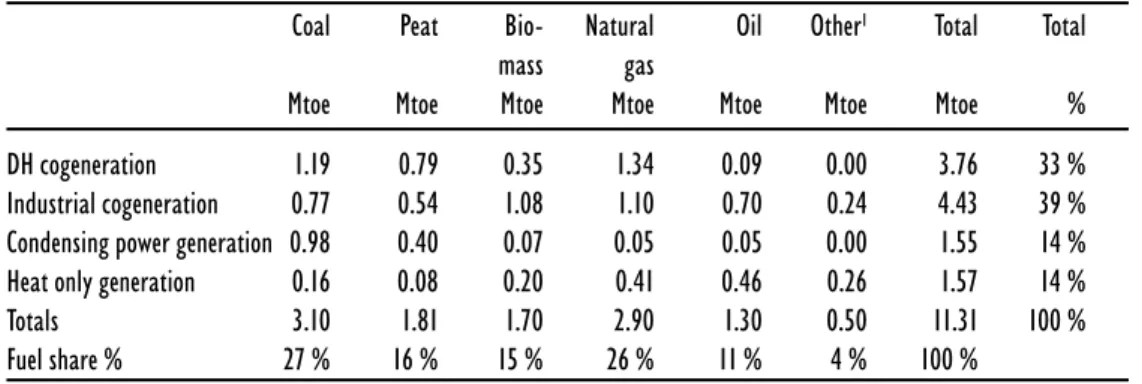
Table 1. Fuels in Finnish large combustion plants in 1998.
Coal Peat Bio- Natural Oil Other1 Total Total
mass gas
Mtoe Mtoe Mtoe Mtoe Mtoe Mtoe Mtoe %
DH cogeneration 1.19 0.79 0.35 1.34 0.09 0.00 3.76 33 %
Industrial cogeneration 0.77 0.54 1.08 1.10 0.70 0.24 4.43 39 % Condensing power generation 0.98 0.40 0.07 0.05 0.05 0.00 1.55 14 % Heat only generation 0.16 0.08 0.20 0.41 0.46 0.26 1.57 14 %
Totals 3.10 1.81 1.70 2.90 1.30 0.50 11.31 100 %
Fuel share % 27 % 16 % 15 % 26 % 11 % 4 % 100 %
Source: (Energiatilasto 1999) & author’s estimates 1) Coke oven & blast furnace gas; refinery gases; LPG
Some 50 % of the Finnish households are connected to district heating systems. As a result, in 1998, cogeneration in district heating accounted for 20 % of the in-digenous power generation. The corresponding figure for industrial cogeneration was 18 %. Cogeneration in Finland is four times the conventional fuel based con-densing power generation (Energiatilasto 1999). The total share of cogeneration plants is 72 % of the total LCP fuel consumption in Finland, with the share of in-dustry slightly bigger than that of district heating. Therefore the majority of the Finnish LCP experience is in relation to boilers and gas turbines in the 50–300 MW fuel input range. Further details of the LCP fuel consumption can be found in Appendix 1, and a listing of the Finnish LCP plants in Appendix 2.
Because of the existence of the large hydro capacity in the Nordic countries, there is little need for fuel based daily peaking power plants in Finland. The co-generation plants are operated mainly based on the heat demand, in that sense electricity is a by-product. The Nordic condensing power capacity – mainly in Denmark and Finland – is in use in any given year dependent on the availability of hydro generation – mainly in Norway and Sweden. At the time of this writing, not all of the installed condensing capacity was considered necessary in the Nor-dic countries. As a result, several coal and HFO fired condensing units are
The unified and liberalised Nordic power market creates a situation, where oil based condensing power is not competitive. Even HFO based cogeneration in existing plants is not competitive for the most part of the year. The coal or gas fired condensing power plants or combined cycle power plants operate in merit order regardless of the national boundaries, unless the transmission network becomes a constraint. Therefore any tightening of environmental regulations relating to large condensing power plants in one country without the corresponding measures in the other countries makes such an action self-defeating. The lowest marginal cost producers on the Nordic market always produce the fossil fuel based condensing power. This was clearly demonstrated, when Finland introduced a carbon tax on power plant coal, while Denmark did not. The expected tax revenue did not ma-terialise, the coal based condensing generation did not decrease, but simply shift-ed to Denmark, and the power price went up. Eventually, Finland was forcshift-ed to repeal the carbon tax in power generation. When the EU-wide liberalised power market develops, similar situations may arise on the European level.
1.2 Pollutants from large combustion plants
1.2.1 Development of SO
2and NO
Xemissions
The SO2 mainly originates from large combustion plants, and, to some extent, also
the processes of pulp and paper industry are significant emitters. With regard to
NOX, the biggest polluters in Finland are still road vehicles, however, the
contri-bution of LCPs is also significant. With today’s techniques for particle removal from the flue gas, the LCPs play a minor role in particulate emissions; the big emitters are the numerous small wood burning hearths and stoves, distributed all over the sparsely populated areas of the country.
When the SO2 and NOX as NO2 balances for Finland are estimated, we find
that only a minority of the SO2 and NO2 pollution originates from indigenous
sources. Most of these pollutants are carried by winds from countries to the west
and south-west of Finland. There is also a considerable SO2 load in the
south-east-ern part of the country, originating from the big oil shale burning power plant in
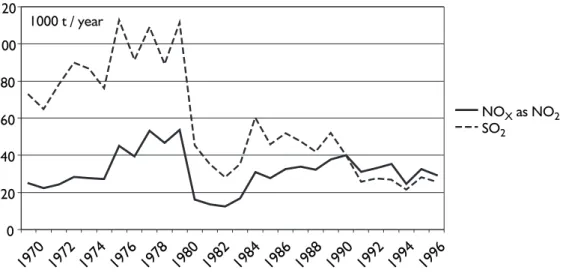
Figure 1. Development of emissions of SO2 and NOX from power generation in Finland.
0 20 40 60 80 100 120 NOX as NO2 SO2 1970 1972 1974 1976 1978 1980 1982 1984 1986 1988 1990 1992 1994 1996 1000 t / year
Narva, Estonia. In Fig. 1 we see the development of SO2 and NOX as NO2 emissions
from power generation in Finland. There has been a big decrease in SO2, while the
NOX as NO2 emissions have been more difficult to curb. The sudden decrease in
emissions in 1980–1982 was caused by the four nuclear units commissioned in a rapid succession prior to said period. More details on the emissions can be found in Appendix 4.
1.2.2 Effect of district heating on air quality
With regard to the district heating boilers, which are typically located within or close to the population centres, the very beneficial effect of district heating on the local air quality should be pointed out. A few big and well-maintained boilers with flue gas cleaning and with high stacks replace a great number of individual heat-ing installations with low stacks and often poorly controlled combustion (there is no gas available for heating in most places). As a result, the total emissions of par-ticulates, CO and unburned hydrocarbons are reduced considerably. With
mod-ern technology, there need not be any appreciable increase in SO2 and NO2
emis-sions either, even if the fuel quality in the district heating boilers were lower than that of the fuels it replaces in individual heating. With the same quantity of total emissions, the high stacks result in a high degree of dilution before the pollutants reach the ground level. This causes local air quality in the district heated cities and villages to be far better than it would be using individual heating.
In all major Finnish cities the market share of district heating exceeds 80 %, and some 50 % of the space heating demand in the country is met by district heat-ing. In 1998 the district heat gross demand was 28.3 TWh, of which cogenerated heat accounted for 23.3 TWh, i.e. 82 %. Distribution losses were 9.7 % of the total generation at 2.7 TWh.
An illustrative example of the improvement in energy efficiency, emission reduction and the environment is the city of Helsinki. It started district heating in the 1950s and is now close to saturation with 92 % of all buildings connected to the district heating network. During the last decade, the partial substitution of natural gas for coal also contributed to the decrease in emissions. Some key indi-cators of the Helsinki energy supply can be found in Table 2 below. The increase in electricity consumption and energy supply efficiency and the big decrease in
specific emissions and measured SO2 concentrations can be seen in it. In Helsinki,
the trend of total SO2 emissions has also been strongly downwards over the past
two decades, while the decrease in total NO2 emissions only began a decade ago.
Table 2. Key figures of the Helsinki energy supply 1960–1998.
1960 1975 1998
Electricity supply GWh/a 583 1 667 5 023
District heat supply GWh/a 357 3 305 7 054
Market share of district heating % 8 60 92
Energy efficiency of Helsinki Energy % 47 77 88
Specific heat consumption in buidlings kWh/m3/a 65 58 43
Emissions of SO2/produced net energy ton /GWh 5.8 1,6 0.3 Emissions of NO2/produced net energy ton /GWh 1.9 1,5 0.4
SO2 concentration annual average microgram/m3 n.a. 41 2–61 Source: Helsinki – the Energy Efficient City (brochure)
1.3 Scope of report
This report confines itself to the pollution prevention techniques applied at a large combustion plant site. It is therefore focused on techniques used to prevent
air-borne pollution such as SO2, NOX and particulates. Environmental issues outside
the site are not discussed in any detail. However, in connection with the waste materials from the LCP plant, such as slag, flyash, gypsum, etc., the impact of their quality on their recycling and acceptability on normal waste dumpsites are brief-ly discussed.
Pollution issues related to condensing power plant cooling water are dis-cussed only in a broad outline, because industrial cooling is in the Sevilla process an object of a separate BREF report. Black liquor recovery boilers are not includ-ed; they are part of the pulp and paper industry BREF report. Big gas turbines, not covered by the current LCP directive, are included, because they will be included in the amendment to the LCP directive currently being prepared by the Europe-an Union.
Apart from techniques applied on LCP sites, the report also discusses in Chapter 2 structural choices within energy systems with a significant impact on the system-wide energy efficiency and hence on emissions. These include, in par-ticular, the use of cogeneration of power and heat in district heating and industry, fuel choices and energy conversion efficiency in condensing power plants.
The report is particularly focused on the Finnish experience of large combus-tion plants in the sense that a more thorough treatment is given to issues of par-ticular interest to Finland, e.g. biomass and peat. Special emphasis is also placed on such Finnish experience that is believed to be of particular interest to the EU-wide audience, e.g. cogeneration and fluidised bed combustion. Despite the clear national focus, an attempt is made to give to the reader at least an outline of the larger picture of the best available techniques for pollution abatement in large combustion plants.
Applied processes and techniques
In this chapter we discuss the processes and techniques that have found their applications at large combustion plants. The chosen points of view are, on one hand, those taken from the energy system level, and, on the other hand, those from the theoretical basis of the key technical processes: steam and gas turbine cycles for power generation, combustion and flue gas cleaning.
2.1 Condensing power plants
In most countries, fossil-fuelled condensing power plants are the backbone of the power generation system. As we have seen, this is not so in Finland. Nevertheless there are in Finland several fossil-fuelled condensing plants, which consume con-siderable quantities of coal and peat. Because the coal is imported, mainly from Poland, only good quality coal with low ash and water contents is used (both typ-ically around 10 %). In the EU, most of the fuels fired at LCPs are fired at large condensing power plants, in Finland the share of condensing at LCP fuels plants is only 14 %.
2.1.1 Steam only condensing power plants
In condensing power plants, fuel is burned in steam generator (boiler) furnaces. In the furnace, and in heat exchangers arranged into the flue gas path after the furnace, heat from the hot combustion gas is transferred into the steam and water flowing inside the boiler tubes, where high pressure (160–300 bar) and
tempera-ture (530–600 °C) steam is generated. This steam is then expanded in a steam
bine, which drives an electric generator. The steam exhausted from the steam
tur-bine is condensed to water in a vacuum at a temperature of 15 to 45 °C. In a
water-cooled condenser, there is a great number of small-diameter tubes, the cooling water flows inside the tubes and the turbine exhaust steam is condensed on the cold outer surface of the tubes. From the condenser, the boiler feed water is pumped back into the boiler through the regenerative feed water heating system, in which the water is heated in 6–9 stages by steam extracted from the turbine, hence the name regenerative feed water heating. The heated feed water enters the
boiler at a temperature of 240–300 °C. Figure 2 below describes, in a broad outline,
the structure of a condensing power plant, with emission abatement equipment highlighted in boldface text.
In the majority of the steam only condensing power capacity in operation to-day, the fuel input to power output ratio (heat rate) is around 2.5 (i.e. efficiency e = 40 %; LHV). In other words, for each unit of power output, 1.5 units of heat is re-jected into the atmosphere via the stack and into the cooling system mainly via the condenser. The established standard practice since the 1960s has been to use either natural circulation boilers with the boiler steam pressure at around 170 bars, or once-through supercritical boilers with a pressure at around 240 bars. In both
cas-es, the superheating and reheating temperatures have been around 540 or 570 °C,
○ ○ ○ ○ ○ ○ ○ ○ ○ ○ ○ ○ ○ ○ ○ ○ ○ ○ ○ ○ ○ ○ ○ ○ ○ ○ ○ ○ ○ ○ ○ ○ ○ ○ ○ ○ ○ ○ ○ ○ ○ ○ ○ ○ ○ ○ ○ ○ ○ ○ ○ ○ ○ ○
depending on the selected tube materials. Using the most advanced high tempera-ture materials, coal-fired condensing power plants with a steam pressure of ca 300
bars and a steam temperature approaching 600 °C have been built recently. For
ex-ample, a coal-fired condensing plant with a net heat rate of 2.08 (e = 48 %) has been commissioned in 1998 in Denmark using direct water cooling (MPS 1998).
Niederaussem K in Germany is another example of the latest condensing power technology. Its commissioning is planned for year 2002, and it will achieve a net heat rate of 2.22 (e = 45 %) with lignite fuel and a wet cooling tower
(Heit-Figure 2. Coal-fired condensing power plant process in principle.
COAL STORAGE
COAL MILLS
STEAM GENERATOR
·
Low-NO
Xburners
· furnace
· evaporator
· steam superheaters
· ECO 2
SCR DENOx
@ ca. 350 °C
· STEAMTURBINE
PLANT
· Regenrative feed
water heating (FH)
· GENERATOR
FH
ESP or baghouse
CONDEN-SER
COMBUSTION AIR HEATER
Flue gas pre-cooler
DESULPHURISATION
PLANT @ ca. 45 °C
Flue gas reheater to > 75 °C
P
O
W
E
R
O
U
T
Cooling water source
LEGEND:
Energy
Air or
Flue gas
Feedwater
Steam
Cooling
water
STACK
Gyp-sum
Fly-ash
Waste
water
Lime-stone
Bottom
ash
müller R.J. u. Kather A 2000; Pruschek R. & al. 1999). Most of the new coal or lig-nite-fired condensing power plants built in the 1990s have had a heat rate of around 2.3 (e = 43 %). The newest Finnish condensing plant, Meri-Pori power plant, commissioned in 1993, has a net heat rate of 2.30 (e = 43.5 %) (EPI 1994). When possible, direct once-through cooling is used to achieve the lowest possible condenser pressure and a temperature to maximise the plant power generation efficiency.
The condensing power plant units of today are usually quite large, typically with power outputs from 300 to 900 MW. At such big plants, the fuel is burned in atomising spray burners (oil) or pulverised coal burners. As bigger fluidised bed combustion (FBC) boilers have become available, they have also found their ap-plications at the smaller condensing plants. Currently, the largest condensing FBC power generation unit in operation has a power output of 250 MW, and concept
studies exist for a 600 MWe unit. To control the NOX emissions, special low-NOX
burners and other primary NOX abatement techniques are used. If these measures
are not sufficient, selective catalytic (SCR) reduction or selective non-catalytic
re-duction (NSCR) with urea or ammonia can be used to remove NOX from the flue
gas. In Finland, there is currently (March 2001) only one condensing power plant
with SCR, the 550 MWe Meri-Pori coal-fired plant.
Flue gas desulphurisation at condensing power plants is typically performed with scrubbers fitted between the steam generator and the flue gas stack. If fluid-ised bed combustion is used, desulphurisation is best achieved in the fluidfluid-ised bed itself by adding calcium carbonate into the bed, and no end of pipe desulphurisa-tion plant is needed.
The oldest environmental protection measure at conventional condensing power plants is the removal of ash and char particles from the flue gas. For this purpose, the most popular method is the electrostatic precipitator. Baghouses with fabric filters are also frequently used.
2.1.2 Combined cycle power plants (CCGT)
Today, about half of the new power generation capacity ordered consists of the combined cycle power plants. At these, a gas turbine is combined with a steam turbine to generate electricity. For technical and cost reasons, the only practicable CCGT fuels are natural gas and light fuel oil (as a reserve for interruptible gas).
At combined cycle power plants, gas turbines generate power at an efficien-cy of ca. 33–38 %. The gas turbine exhaust gas typically has a temperature of 530–
630°C, depending on the turbine type and ambient conditions. This hot gas is led
to a heat recovery steam generator (HRSG), where it is used to generate steam, which then expands at a steam turbine power plant inprinciple similar to the one described above. The great attractions of a CCGT plant are its low heat rate and low investment cost, which have made CCGT competitive, despite the high cost of the natural gas fuel. In the past 20 years, the heat rate of a CCGT plant has de-creased from 2.2 to 1.7, i.e. the LHV efficiency has grown from 45 % to 58 %. Gas turbines are currently still undergoing rapid development, making possible a CCGT heat rate below 1.67 (efficiency over 60 %) in the near future. In a CCGT plant of today, approximately 2/3 of the output comes from the gas turbine, 1/3 from the steam turbine. The structure of a combined cycle power plant is present-ed in Fig. 3.
Because less than 1/3 of the oxygen in the gas turbine inlet air is consumed for combustion in the gas turbine combustor, supplementary firing of fuel in the gas turbine exhaust gas is possible. In modern CCGTs, this causes a slight increase in the power generation heat rate, and it has been seldom used at condensing
CCGTs. However, in industrial cogeneration, it is frequently used as a means to controlling HRSG steam generation independently of the gas turbine output. In cogeneration applications, supplementary firing also improves the overall efficien-cy of heat and power generation.
Because both natural gas and light fuel oil are very clean fuels and allow a practically complete combustion in gas turbine combustors, there are no problems
with ash, char or SO2 at CCGT plants. The only problem is NOX, which, at
mod-ern plants, is controlled by using special low-NOX burners. In older burners, the
NOX can be controlled by water or steam sprays into the burners, but it happens
at the expense of the plant heat rate. In some regions, an extremely tight control
of NOX has been considered necessary; in those regions, selective catalytic
reduc-tion with ammonia is added to the HRSG.
Gas turbines are inherently very noisy, therefore they are built into special noise attenuation enclosures, and there are silencers integrated into the gas tur-bine air intake and exhaust gas outlet channels.
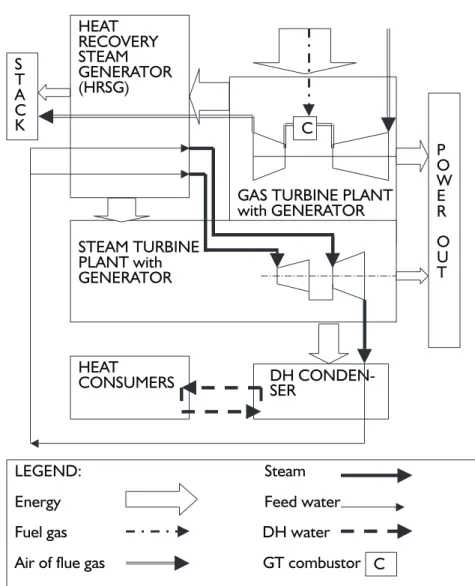
Figure 3. CCGT power plant for DH cogeneration in principle.
HEAT RECOVERY STEAM GENERATOR (HRSG)
GAS TURBINE PLANT with GENERATOR S T A C K C STEAM TURBINE PLANT with GENERATOR P O W E R O U T DH SER HEAT CONSUMERS LEGEND: Steam Energy Feed water Fuel gas DH water
2.1.3 Emerging power generation techniques
Integrated coal gasification combined cycle (IGCC) and pressurised fluidised bed combustion (PFBC) are two emerging power generation techniques, which can be considered to be in the late demonstration or early commercialisation phase of development, depending on how one chooses to assess the so far somewhat dis-couraging operation experiences. Both of them hold the triple promise of higher efficiency, better environmental performance and lower power generation costs in comparison to the conventional power plants described above. A more detailed discussion of these technologies can be found in Chapter 6 of this report together with other emerging power generation technologies.
2.2 Cogeneration of heat and power (CHP)
We have found that only a fraction of 40 % to 60 % of fuel energy (measured as the fuel lower heating value LHV) can be converted into electric power at electric-ity only power plants. The rest is lost as low temperature waste heat into the air and water. Because a lot of heat is also needed by the end users in space heating and many industrial processes, one is led to ask how this rejected heat of condens-ing power plants could be made useful. The thermodynamic answer to this is quite simple: Raise the temperature of the rejected heat to the useful level required, say,
to 70–120 °C in space heating and 120–200°C in industrial processes. However, this
always happens at the cost of power generation. This simultaneous generation of power and useful heat is usually referred to as cogeneration or combined heat and power (CHP).
Cogeneration is a means to improving energy efficiency by influencing the energy supply system structure. In all cases, cogeneration saves fuel in compari-son to separate generation of heat and power from fossil fuels. If the local heat load is big enough, and consequently the cogeneration plant big enough, cogeneration
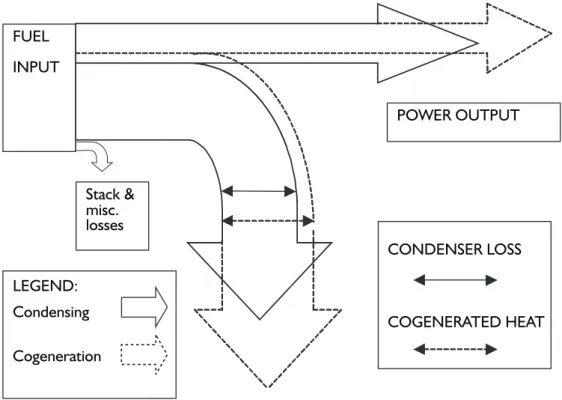
Figure 4. Energy balance comparison of condensing cogeneration power plants.
Stack & misc. losses POWER OUTPUT CONDENSER LOSS COGENERATED HEAT FUEL INPUT LEGEND: Condensing Cogeneration
also saves money. Technically, all condensing power plant types discussed above can be modified for cogeneration.
One obvious application of cogeneration is space heating, provided there is a large enough district heating system as a heat consumer. For heating, a fairly low temperature level of the rejected heat is sufficient. In the Finnish district heating
systems, the return water temperature hovers around 50 °C and the outgoing flow
water temperature varies with heat demand from 75 to 120°C, with 85 °C being a
representative average value. When this hot water is used as cooling water in the
condenser instead of cooling with cold water of 1–20 °C, the loss of electric power
for each 1 MWth of heat recovered at 85 °C is from 0.1 to 0.15 MWe, a good bargain.
This in energy terms small but economically big difference between a district heat cogeneration plant and a condensing power plant is illustrated in Figure 4.
In industrial applications, the heat is usually consumed as steam with pres-sures ranging from 3 to 16 bars, for which the condensing temperatures are 134 to
202 °C respectively. The loss of electric power compared to a condensing plant is,
in this case, already considerable. Nevertheless, in large enough applications also industrial cogeneration is profitable.
Due to the economies of scale in power plant investment and operation costs, small cogeneration plants may be uneconomic in conditions where large ones can be very profitable. The success of cogeneration in Finland has been essentially achieved without state subsidies, and it is attributable to a number of factors, of which the two below are of overriding importance:
(i) there are large concentrated industrial heat loads in the pulp and paper
in-dustry,
(ii) in the cold climate, large district heating schemes could develop in the ab-sence of natural gas.
In making comparisons between separate condensing power generation and co-generation, the problem of assigning the investment, fuel and other operating costs to the two marketable products arises. Therefore, for example, the heat rate of cogenerated electric power is dependent on its definition, and opinions differ as to the most appropriate way of doing it. For simplicity, in this discussion the fuel consumption is assigned as pro rata to the power and heat outputs. With this def-inition, the heat rate in cogenerated power and heat typically ranges from 1.1 to 1.2 at nominal load. This is quite favourable in comparison to the typical values of 2.3 and 1.8 in modern conventional condensing and CCGT plants respectively. In today’s liberalised power market, the discussion on the appropriate assignment of cost is not commercially relevant, although it is necessary, if the fuels for power and heat generation have different tax regimes, as is currently the case in Finland. Commercially, the value of electricity in today’s liberalised power market is not determined by its cost of generation at an individual plant – in whichever way computed. The power market determines the electricity price. Similarly, the heat market determines the commercial value, i.e. the price of heat. In principle, it is the cost of the least expensive available alternative means of heat generation.
Another important quantity describing a cogeneration power plant is its pow-er/heat output ratio. Obviously, because electric power is economically two to four times as valuable as heat, we would prefer to have as high a power/heat ratio as possible in combination with a low overall heat rate. Here again the laws of phys-ics set the limits. As explained above, the higher the temperature level of the covered heat, the less power and more heat is gained from the process. In this re-spect, the combined cycle (CCGT) is far more favourable than the conventional steam process. At a condensing CCGT, 2/3 of the power output come from the gas turbine, and cogeneration-related power loss only occurs in the steam turbine producing 1/3 of the output. The power / heat output ratio of a CCGT at nominal
load can be 1.1 in district heating applications and 0.9 in the pulp and paper in-dustry, while the figures in steam only cogeneration are 0.6 and 0.3 respectively. The annual average figures are typically clearly lower, due to, among others, part load operation and start up / shut down cycles.
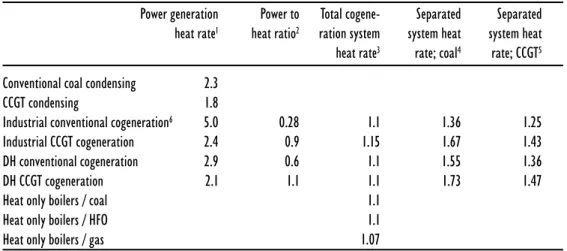
In Table 3, the total system heat rates (the three columns on the right) are comparable in each row. They tell how much fuel is needed in a cogeneration sys-tem and in a separated syssys-tem with the same power and heat outputs, but with heat and power generated separately. We can see that in each case the separated system – whether conventional or CCGT-based – clearly consumes more fuel than the cogeneration system providing the same energy service. When the compari-son basis is conventional condensing power, the reduction in fuel consumption by cogeneration ranges from 20 % for the conventional industrial cogeneration to 57 % for the district heating CCGT cogeneration. If CCGT condensing is assumed for the separate power generation, the savings are smaller, 12 % and 34 % respective-ly. These figures are given only to give a general idea of fuel savings through co-generation, the actual figures always depend on the specifics of each project and the energy supply system, of which it is a part.
For cogeneration to compete successfully in the marketplace, a high price of electricity and a big enough local heat demand are required. For a small heat de-mand, the plant size remains under the limit of economic competitiveness. Big local industrial heat loads typically exist in the pulp and paper industry, in refin-eries and in the chemical industry, and, in some cases, in food and textile indus-tries. In Finland, the pulp and paper industry is by far the most important cogen-erating industry.
Table 3. Indicative comparison of cogeneration to separate power and heat generation.
Power generation Power to Total cogene- Separated Separated heat rate1 heat ratio2 ration system system heat system heat
heat rate3 rate; coal4 rate; CCGT5
Conventional coal condensing 2.3
CCGT condensing 1.8
Industrial conventional cogeneration6 5.0 0.28 1.1 1.36 1.25
Industrial CCGT cogeneration 2.4 0.9 1.15 1.67 1.43
DH conventional cogeneration 2.9 0.6 1.1 1.55 1.36
DH CCGT cogeneration 2.1 1.1 1.1 1.73 1.47
Heat only boilers / coal 1.1
Heat only boilers / HFO 1.1
Heat only boilers / gas 1.07
1) Qf/P ; Fuel input (LHV) / Net power output 2) Qh/P ; Net heat output / Net power output
3) Qf/(P+Qh); Fuel input (LHV) / (Net power + heat output)
4) Combined heat rate of producing separately in conventional coal condensing plants and heat only boilers (HR = 1.1) the same amounts of power and heat as in the cogenerating system. To be compared with the HR indicated on the row no. 3. 5) Combined heat rate of producing separately in CCGT condensing plants and heat only boilers (HR=1.1) the same amounts
of power and heat as in the cogenerating system. To be compared with the HR indicated on the row no. 3 6) Live steam 80 bar 480 °C; back-pressure 4 bar
All figures refer to nominal full load operation.
Because, in Finland, the natural gas only became available in 1973, and then even in a small part of the country, district heating has been able to take a big market share in all Finnish cities without exception, and even in small towns and villag-es. For district heating, irrespective of the possible cogeneration benefit, the con-siderable improvement in the local air quality resulting from the disappearance of numerous individual furnaces with low stacks is an important factor in areas
where natural gas is not available. Today, the market penetration of district heat-ing is in Finland close to 50 % in the space heatheat-ing market. Overall, 38 % of power generation in Finland came from cogeneration in 1998, while the EU-15 average is 10 % (Energiatilastot 1999).
The environmental benefits of cogeneration come from each saved tonne of
fuel, when the corresponding amounts of NOX, SO2, particulate emissions and also
CO2 are avoided. When the cost of avoiding pollutant emissions is calculated,
large-scale cogeneration is one of the cheapest methods of pollution abatement, in addition to being a method of energy conservation. From the Finnish energy balance for 1998, on can infer that had there been no cogeneration at all, ca. 2.3 Mtoe more fuels would have been needed, if coal condensing and heat only boil-ers had been used instead of cogeneration. This is 22 % of the total of fossil and biomass fuels actually burned at the LCPs of the country.
2.3 Fuels used at large combustion plants
2.3.1 Hard coal and lignite
Hard coal and lignite are currently the dominant solid LCP fuels in the European Union. Coal is transported economically over long distances by ship and a few hundred kilometres by barge and railroad cars. Lignite is usually produced in open cast mines, and the power plants are located next to the mine. Lignite usual-ly contains 40–60 % of water by weight, while, in hard coal, the water content is typically 8–15 %. Both hard coal and lignite can contain considerable amounts of sulphur, typically 1–4 % of the dry substance. Ash content is highly variable, the range being typically from 10 to 20 % of dry substance, but coals with up to 40 % or more ash are sometimes used at power plants close to the mine. It is apparent
from these figures that both ash and SO2 in flue gases are important
environmen-tal issues for coal and lignite. NOX formation in coal combustion is on the high side
even with low-NOX combustion, while, in the case of lignite, low-NOX combustion
alone often achieves an acceptable level of NOX emissions.
In Finland, all coal is imported, mostly from Poland. As all coal transported over longer distances, it is of high quality, with typically 1 % S, 11 % ash and 9 % water. In Finland in 1998, 3.10 Mtoe of coal were burned at large combustion plants, 27 % of the total LCP fuel use (see Table 1).
2.3.2 Fuel oils
Of the fuel oils, heavy fuel oil (HFO) is the important LCP fuel, while only small amounts of light fuel oil (LFO) are used at large combustion plants, due to its high price. Light fuel oil has a low sulphur content, because sulphur is removed from it in the refinery process. In general, the use of HFO without FGD is limited by national regulation, in Finland, the higher allowed HFO sulphur content is 1 %. Certain HFO qualities can have quite high sulphur contents, and in those cases flue gas desulphurisation (FGD) is necessary. The ash content of HFO is low, usu-ally well below 2 %, but particle removal from the flue gas is needed. The oil flame
temperature is high, but the oil nitrogen content low, as a result the NOX
forma-tion is moderate.
In Finland, consumption of fuel oils at large combustion plants was 1.30 Mtoe, i.e.11 % of the total LCP fuel use (see Table 1).
2.3.3 Natural gas
Natural gas is a clean fuel causing practically no SO2 or particulate emissions. Also
the control of primary NOX emissions in gas fired boilers is easier than of other
fuels. Secondly, most of the natural gas-fuelled LCP applications offer a lower power generation heat rate at the CCGT plants than conventional condensing power plants using oil or solid fuels.
The CO2 emissions from natural gas combustion are inherently far lower than
from other fossil fuels. Obviously, the low heat rates in comparison to other fuels is an important contributing factor, as less fuel is needed. Another important
fac-tor is the low CO2 emission of natural gas in relation to the heat released in
com-bustion. The difference is particularly pronounced, when we compute the CO2
released per kWh of electricity generated, when both the lower CCGT heat rate
and the low CO2 per MJ heat released come into play, as shown in Table 4.
In Finland, natural gas consumption at large combustion plants was 2.9 Mtoe, i.e. 26 % of the total LCP fuel use (see Table 1).
2.3.4 Peat
Within the EU, peat is significant as an LCP fuel only in Ireland and Finland. Peat as a fuel in Finland was quite insignificant at the beginning of the 1970s, with a 0.1 % share of the primary energy input. With rising import fuel prices, peat has gained a strong position, with a 6 % share of the primary energy input and a 16 % share of the LCP fuels in 1998.
Peat bogs deep and large enough for economical peat production occur in all parts of Finland, and only a small fraction of them are being exploited, because no demand for peat can be found at an economical distance. Peat is a relatively clean fuel characterised by low ash and sulphur contents, typically around 5 % and 0.5 % respectively of the dry substance. Peat has a high volatile content and is very reactive, if its moisture content falls below 40 % (see Table 4). In large-scale, it is typically used as milled peat, produced during May to August and dried to 45 to 60 % moisture by the sun and wind on the production site and subsequently stored next to the production site. With respect to the high moisture content, peat is comparable to lignite, while, in terms of dry substance composition, it is closer to biomass than lignite.
Peat is a voluminous fuel with a low heating value. It can therefore rarely be economically transported over distances of more than ca. 100 km. As a result, the number of plants burning peat mainly consists of small-scale local cogeneration or heat only plants for small to medium size district heating systems. A great number of those plants in Finland are below 50 MW fuel input and, as such, do not qualify as large combustion plants. However, in energy terms, the largest con-sumer of peat fuel consists of the LCP cogeneration and heating plants in the dis-trict heating systems of the (mostly inland) cities with populations in the 50 000 to 200 000 range. Overall, the district heating sector consumed 0.86 Mtoe of peat in 1998, industrial cogeneration and heating plants consumed 0.58 Mtoe, and the two
peat-fired condensing power plants with 155 and 120 MWe outputs consumed 0.40
Mtoe.
In Finland, peat consumption at large combustion plants was 1.81 Mtoe, i.e. 16 % of the total LCP fuel use (see Table 1).
2.3.5 Biomass
Biomass is defined in the current LCP directive as the “clean” portion of vegeta-ble matter, including the waste derived fuels, but excluding mixed municipal waste and treated wood (see Acronyms and Definitions).
Most of the Finnish LCP biomass is barking or other residue from pulp or sawmills. It contains 40–60 % of water and is burned on specially designed slop-ing grates (older technique) or in fluidised beds. Although the chemical composi-tions of the bark and wood of different species are slightly different, and the amount of dirt and soil affects the ash content and composition, the biomass de-rived from forestry and forest industries has, in broad terms, certain common qualities as a fuel. The sulphur content is small and the ash content moderate (see Table 4). Burned together with peat, the wood ash can react with the sulphur from the peat and act as a desulphurising agent. At a closer look, the differences in fuel moisture and consistency are considerable, which affects the fuel handling and combustion properties. All these details need to be taken into account when de-termining the techniques of their storage, transportation, combustion and possi-ble flue gas treatment.
An emerging class of biomass fuel used by pulp and paper mills and at heat-ing plants is forestry residue, i.e. small trees, treetops and branches of trees, col-lected specifically for fuel in connection with other forestry operations. Experi-mentation has also been going on for over two decades with growing of various Salix-species specifically for fuel. The economics of these fuels is not very good, due to the cost of collection and transport, and the amount used at LCPs is so far insignificant.
The small amounts of forestry residue actually used, are usually co-fired with other fuels at existing installations, particularly at peat or barking residue-fired FBC plants. However, all forestry biomass is not automatically suitable for burn-ing even at FBCs designed for peat or bark. The issue of co-firburn-ing is discussed in more detail in the following Chapter 2.3.5.
In Finland, biomass consumption at large combustion plants was 1.70 Mtoe, i.e. 15 % of the total LCP fuel use (see Table 1).
2.3.6 Solid recovered fuels for co-firing
Waste fuels of unknown chemical composition must be burned in dedicated in-cineration facilities with complicated flue gas cleaning installations. Waste fuel (and biomass) co-firing, i.e. firing waste fuels at conventional large combustion plants together with its main fuel, is possible provided that
• the harmful emissions, in particular those related to Hg, Cd, As, Cl, K, As are
known and remain within acceptable limits
• there is no adverse effect on the boiler operation, particularly as regards ash
properties
• the fuel conveyors and feeders are capable of handling the waste
Biomass received directly from forestry or agriculture does not pose any particu-lar environmental problems in co-firing, although technical problems in fuel han-dling and combustion may arise. When using waste-derived fuels in co-firing, one has to make sure that the waste fuel complies with the set environmental require-ments. To ensure this, quality control needs to be arranged. In Finland, the quali-ty categories and the qualiquali-ty control methods for waste-derived fuels for co-firing are prescribed by the national standard (SFS 5875).
The most suitable combustion technique for co-firing is fluidised bed combus-tion. Co-firing of biomass and clean waste-derived fuels has been very successfully applied at many Finnish FBC power plants, where the main fuel is peat, coal or wood residue. However, FBC is not a solution to all fuel problems, but there are considerable differences between fuels in terms of problems encountered in firing them in FBC boilers. One classification of solid recovered fuels in terms of lower heating value and difficulty in combustion is given in Figure 5 below. Peat and barking residue are included for comparison.
Another approach must be taken, when the local fuel cannot be burned to-gether with the commercial main fuel, due to its handling or ash properties. Then a dedicated combustion facility must be constructed for the local fuel in connec-tion with the bigger power plant. The following approaches have been applied:
• An uncooled furnace, from which the hot flue gas is led into the main boiler
for heat recovery
• An uncooled gasifier, from which the generated gas is led to the main boiler
for combustion
• A separate complete boiler for the local fuel.
The cost disadvantage of a separate boiler of gasifier compared to co-firing in an FBC boiler is obvious. In Denmark, several separate combustion facilities for straw combustion have been constructed in connection with coal or gas-fired large com-bustion plants (Johnsen F. 1999). The gasification has been demonstrated at a Finn-ish and an Austrian power plant (Nieminen J. & al. 1999; Anderl H. 2000).
Figure 5. Classification of solid recovered fuels (Courtesy of Foster Wheeler Energia Oy).
BARK PEAT WOOD BIOMASS DEMOLITION WOOD PDF COMMERCIAL PDFINDUSTRIAL CHIP-BOARD RF PELLETS PLY-WOOD COLORED OR PRINTED MIXED PLASTICS COLORED OR PRINTED CLEAN PLASTICS POLYOLE-FIN PLASTICS PE, PP, PC C FIBRE RESIDUE A M S W R D F P V C
MULTIPLE PROBLEMS SOME PROBLEMS – NO PROBLEMS FUEL RANK 35 5 20 10 B CONSUMER PDF: A. MIXED PLASTICS B. WOOD AND PLASTICS C. PAPER AND WOOD
2.3.7 Comparison of fuels
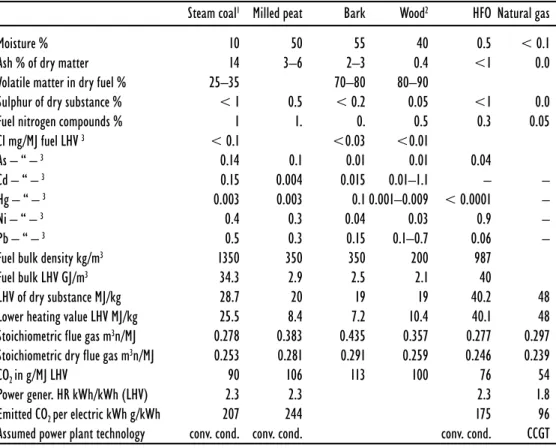
From the emission point of view, the important aspects of fuel are its contents of ash, sulphur, heavy metal and, to a lesser degree, of nitrogen and water. The key characteristics of the most common Finnish LCP fuels are given in Table 4 below. There are more examples of fuel data for individual boilers in Appendix 6.
Table 4. Comparison of LCP fuels used in Finland, typical values.
Steam coal1 Milled peat Bark Wood2 HFO Natural gas
Moisture % 10 50 55 40 0.5 < 0.1
Ash % of dry matter 14 3–6 2–3 0.4 <1 0.0
Volatile matter in dry fuel % 25–35 70–80 80–90
Sulphur of dry substance % < 1 0.5 < 0.2 0.05 <1 0.0
Fuel nitrogen compounds % 1 1. 0. 0.5 0.3 0.05
Cl mg/MJ fuel LHV 3 < 0.1 <0.03 <0.01 As – “ – 3 0.14 0.1 0.01 0.01 0.04 Cd – “ – 3 0.15 0.004 0.015 0.01–1.1 – – Hg – “ – 3 0.003 0.003 0.1 0.001–0.009 < 0.0001 – Ni – “ – 3 0.4 0.3 0.04 0.03 0.9 – Pb – “ – 3 0.5 0.3 0.15 0.1–0.7 0.06 –
Fuel bulk density kg/m3 1350 350 350 200 987
Fuel bulk LHV GJ/m3 34.3 2.9 2.5 2.1 40
LHV of dry substance MJ/kg 28.7 20 19 19 40.2 48
Lower heating value LHV MJ/kg 25.5 8.4 7.2 10.4 40.1 48
Stoichiometric flue gas m3n/MJ 0.278 0.383 0.435 0.357 0.277 0.297
Stoichiometric dry flue gas m3n/MJ 0.253 0.281 0.291 0.259 0.246 0.239
CO2in g/MJ LHV 90 106 113 100 76 54
Power gener. HR kWh/kWh (LHV) 2.3 2.3 2.3 1.8
Emitted CO2 per electric kWh g/kWh 207 244 175 96
Assumed power plant technology conv. cond. conv. cond. conv. cond. CCGT
1) Polish export coal 2) Wood chips
3) Order of magnitude figures only. For more details see Appendix 3, Table 1.
Another important aspect of a fuel are its handling and combustion characteris-tics. Especially problematic are many waste fuels both in terms of handling, com-bustion and possible releases of harmful substances. One classification of waste fuels, in terms of ease of handling and combustion in fluidised beds, suggested by Foster Wheeler Energia Oy is given in Fig. 5.
As regards various trace metals, their contents in fuel varies, depending on the source of the fuel. Among commercial fuels, coal usually contains more trace metals than other fuels, with vanadium in heavy fuel oil being the notable excep-tion. Water treatment sludges, which sometimes are co-fired at large combustion plants, can also show quite high concentrations of trace metals. For more details see Appendix 3.
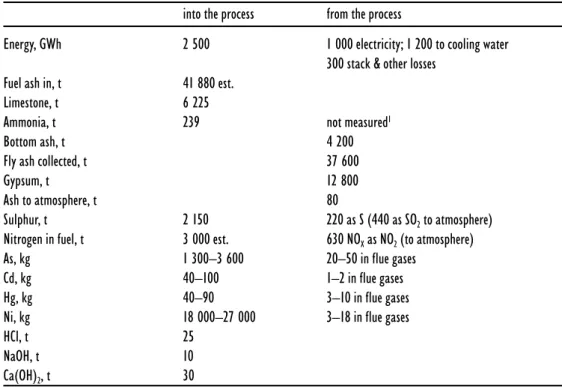
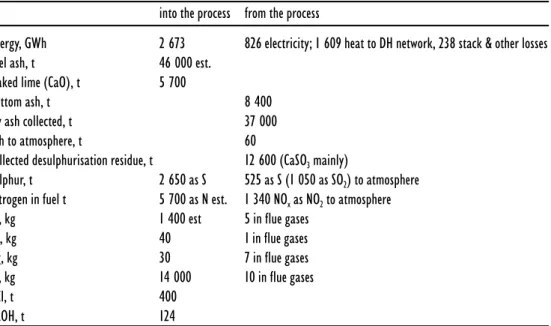
Trace metals in fuels remain, for the most part, bound to the ash and other particles and will be removed from the flue gas flow together with them. Some trace metals, mercury in particular, also appear in vapour phase and are not cap-tured by particle collectors. The observed levels of atmospheric emissions and re-tention in ash of As, Cd, Hg and Ni are illustrated in Chapter 3 by way of four example plants.
2.4 Overview of the traditional combustion techniques
2.4.1 Oil and gas burners
In Finnish conditions, heavy fuel oil at large combustion plants is mostly used in mid merit or peaking operation in industry and district heating applications. The more expensive light oil is used at LCPs mainly for start-up and similar sporadic use. Heavy oil contains nitrogen 0.2–0.6 %, sulphur 0.1–0.2 % and ash 0.1–0.2 %.
Heavy fuel oil for burners is typically pressurised up to 70 bar and preheated
so that it can be atomised to small droplets (2–5 µm) or even vaporised to allow
stable combustion and a small share of unburned oil char. Pressurised air, steam or water can be used for exciting the atomisation. The atomisation can also be done by a mechanical spinning cup, which generates a thin conical layer of oil, which in turn disintegrates into small droplets in front of the burner, when the cone ex-pands and is heated by the flame.
The highest fuel output per furnace volume is typically in large boilers 250–
400 kW/m3 limited by the increase in unburned oil char and thermal NO
X.
Nitro-gen oxide is formed in burners for two reasons: from combustion air for high com-bustion temperature called thermal NO) and from fuel-bound nitrogen (so-called fuel-NO).
Nitrogen molecule and oxygen molecule cannot react directly in the combus-tion process. The chemical bond between two nitrogen atoms is very strong. Ther-mal NO is formed, when the nitrogen molecule of combustion air reacts with the oxygen atom at a high combustion temperature and generates NO and N atoms (R1). Then the N atom reacts with the oxygen molecule and generates NO and O atoms (R2). These two reactions are called Zeldowich mechanism. It is strongly dependent on the combustion temperature, with NO formation increasing with the increasing flame temperature.
Another reaction generates so-called prompt NO. Here the reaction route
goes through the hydrocarbon radicals (CHi). This reaction is not dependent on
the combustion temperature.
Fuel can contain quite a lot of nitrogen in compounds, which release nitro-gen radicals during combustion. The nitronitro-gen content of fuels vary from 0.5 % to 2–3 %. In most cases, the fuel NO has a bigger influence than the thermal NO on
NOX emissions.
The low-NOX combustion techniques are based on influencing these known
NO formation mechanisms. Flue gas recirculation lowers the combustion flame temperature and oxygen concentration, thereby affecting the formation of ther-mal NO. Also, the decrease in the air/fuel ratio close to or below its stoichiomen-tric value lowers the partial pressure of oxygen in the flame, and therefore the
reaction activity of the NO formation also decreases. Fuel NOX can be reduced by
low-NOX burners, flue gas recirculation, combustion air staging or fuel staging.
Low-NOX burners typically apply low air/fuel ratio and flame internal flue gas
re-circulation. The basic idea inr low-NOX burners is to have a reducing atmosphere
in the core of the flame and the other oxidising flame zone around the core. Gas burners are, in principle, similar to oil burners, except that no atomisa-tion systems are needed. The maximum capacity of one oil or gas burner is about 70 MW.
Because natural gas contains no fuel-bound nitrogen, there is no need for operating the burners in a reducing atmosphere. The only emission to be
con-cerned about is thermal NOX , which can be controlled by keeping the flame
tem-perature sufficiently low. Natural gas has no ash, and therefore the furnace can be sized comparatively small. The highest fuel output per furnace volume is limited
to 500 kW/m3 because of the increase in the thermal NO
2.4.2 Pulverised coal and peat combustion
Nearly all large (200 MWe) power plants burning solid fuels are equipped with
pulverised fuel burners. Apart from these, pulverised firing can also be found in considerably smaller boilers. Pulverised combustion is similar in principle to gas or oil combustion. Coal needs to be dried and ground to small particle sizes in coal mills so that stable flame can be maintained in all burners. The largest combustion
capacity of a single burner is about 80 MWth, and therefore the big boilers have
several burners. The burners can be located on one or two opposite walls (so-called wall firing) or they can be located in the furnace corners (so-called tangential fir-ing). The burners are located at the furnace height on typically 2–6 burner levels. One mill is usually feeding fuel to one level. In the partial load operation, one or more burner levels are taken out of operation.
Pulverised combustion is a beneficial combustion technique for boiler design. It allows a high combustion temperature, which is important for the coal char to burn satisfactorily. Combustion efficiency is therefore high, and the resulting fly ash with low unburned coal content (<5 %) can be utilised for cement and in con-crete manufacture. Large boiler units can be designed without any risk, and once-through evaporators can be used, a precondition for high efficiency power plants. The drawback of the high combustion temperature in pulverised coal
com-bustion is that it causes high primary NO and NO2 emissions. The modern
low-NOX burners have been developed to curb these emissions. The low-NOX
burn-ers operate at the under-stoichiometric combustion range (air ratio 0.85–0.95) and a high combustion temperature is needed to ensure ignition. A limiting factor
to-day is the fact that the share of thermal NOX increases, if lower reduction of fuel
NOX is targeted.
Sulphur reduction in the furnace can be implemented by limestone or dolo-mite injection, but the method is not very efficient. The principle is the same as in the method used in fluidised bed combustion, but the limiting factors are the lower suspension density and sintering effects caused by a higher furnace temperature than in the case of fluidised bed combustion.
2.4.3 Grates and stokers
Grate firing is the oldest firing principle used in boilers. It has been the most pop-ular firing system in small size boilers until the beginning of the 1980s, when the fluidised bed combustion started its expansion largely replacing grate firing. In Finland, most new solid fuel-fired boilers with a fuel input of over 5 MW are flu-idised bed boilers. However, grate firing in this size range is somewhat more pop-ular in some countries (Sweden, Denmark) and with some special fuels (wood pellets, straw, plywood and chipboard waste and domestic waste). Today, grates and stokers are used only infrequently at large combustion plants of fuel input in excess of 50 MW.
The combustion process in grate firing is not so well controlled as in pulver-ised fuel burners or in fluidpulver-ised beds. The combustion chemistry and the temper-ature can vary within the same kind of fuel particles, depending on the location on the grate. Actually, on a grate, all fuels will first be dried, then pyrolysed and, finally, the char is burned on the grate. Pyrolysing share of fuel energy can be about 80 % with biofuels and drop down to 20–40 % with coal.
The typical operation principle in grate firing of coal differs from biofuels. Sloped grates are typically used for biofuels. They can be static or mechanically activated. For coal, travelling grates are used for the most part, and a homogene-ous layer of coal is fed on it, or the fuel can be fed on the grate by a so-called
spreader located on the furnace wall. The spreader throws the fuel on the grate against the direction of the grate movement. Thus the longest burning time can be achieved for the biggest particles, because they are thrown over a longer dis-tance close to the entry of the travelling grate.
Sulphur removal on the grate is not possible because of the minimal contact time of sulphur oxides with reactive alkali fed on the grate. Limestone injection into the furnace is possible but not efficient.
NOX reduction mechanisms are the same as with bubbling fluidised bed
com-bustion. Efficient low-NOX combustion requires a sophisticated secondary air
sys-tem and special furnace design enabling two combustion zones.
2.4.4 Gas turbine combustors
The pressurised (15–30 bar) combustion of natural gas in gas turbine combustors is more demanding than in atmospheric boilers. The outlet temperature of the combustor is limited by the strength of the rotating turbine blade materials. The
highest gas inlet temperature values today are about 1 300 °C. The material
tem-perature of the blades can be kept at the level of 850 °C using cooling air and,
pos-sibly, also cooling steam. As the result from this limiting combustion outlet tem-perature, the stoichiometric air ratio in combustion is 3–3.5.
Natural gas contains no nitrogen compounds in fuel except inert N2
mole-cules, and therefore the only design criterion for the gas turbine combustor is to
keep the formation of thermal NOX minimal. In the conventional diffusion
com-bustors, air and fuel are introduced separately much in the way discussed in con-nection with boiler burners. In the diffusion flame, fuel and air mix gradually, which results in high local temperatures and high levels of CO and unburned hydrocarbons. Locally, very high combustion temperatures in locations where
sto-ichiometric air/fuel ratio occurs also result in high NOX emissions.
For controlling thermal NOX formation in gas turbine combustors, both
wa-ter and steam injection into the flame is used. Both of these methods are feasible for conventional diffusion combustors. Water molecules have good radiation prop-erties, and therefore they smooth the temperature profile in the combustor. How-ever, increased problems are met with the increase in the thermal stress of the combustor and turbine blades, because of the insufficient mixing of cool and hot
gas streams. Furthermore, the use of water or steam injection to control NOX
for-mation in gas turbine combustion chambers decreases the efficiency of power generation.
Today, diffusion flame combustors are no more built into new natural
gas-fired gas turbines. Instead, the so-called dry low-NOX combustors are used. They
are based on premixing of fuel with the combustion air flow before the combus-tor zone. The premixing prevents any local high temperature areas from forming
in the flame, which again decreases the NOX formation considerably in
compari-son to the diffusion flame. In part load operation, the share of diffusion flow in-creases and the emission level rises.
When light fuel oil is used, premixing cannot be used, but each fuel droplet
burns by necessity in the diffusion mode. The only feasible low-NOX techniques
2.5 Fluidised bed combustion
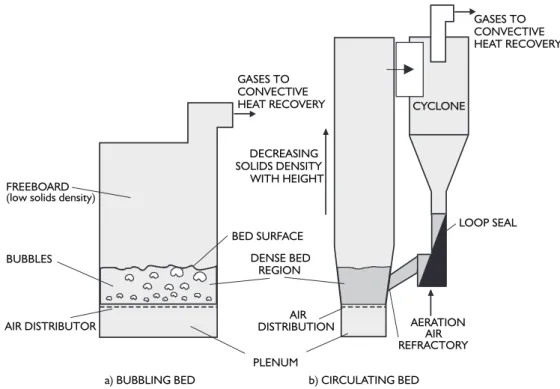
2.5.1 Description of fluidised bed combustion
Bubbling fluidised bed combustion (BFBC) is a modern combustion technology especially suitable for unhomogeneous biofuels. BFBC consists of a 0.5–1.5 m high bed on the fluidising air distribution plate. The fluidising velocity is about 1m/s.
The density of the bubbling bed is about 1 000 kg/m3. Bed materials used can be