An Approach to Classify Software Maintenance Requests
G.A. Di Lucca , M. Di Penta
, S. Gradara
[email protected], [email protected], [email protected]
University of Naples ”Federico II”, DIS - Via Claudio 21, I-80125 Naples, Italy
RCOST - Research Centre on Software Technology
University of Sannio, Department of Engineering
Palazzo ex Poste, Via Traiano, I-82100 Benevento, Italy
Abstract
When a software system critical for an organization ex-hibits a problem during its operation, it is relevant to fix it in a short period of time, to avoid serious economical losses. The problem is therefore noticed to the organization having in charge the maintenance, and it should be correctly and quickly dispatched to the right maintenance team.
We propose to automatically classify incoming mainte-nance requests (also said tickets), routing them to special-ized maintenance teams. The final goal is to develop a router, working around the clock, that, without human in-tervention, dispatches incoming tickets with the lowest mis-classification error, measured with respect to a given rout-ing policy.
6000 maintenance tickets from a large, multi-site, soft-ware system, spanning about two years of system in-field operation, were used to compare and assess the accuracy of different classification approaches (i.e., Vector Space model, Bayesian model, support vectors, classification trees and k-nearest neighbor classification). The application and the tickets were divided into eight areas and pre-classified by human experts. Preliminary results were encouraging, up to 84% of the incoming tickets were correctly classified.
Keywords: maintenance request classification, machine
learning, maintenance process
1. Introduction
Business critical or mission critical software system fail-ures are often cause of serious economic damages for com-panies, thus fixing quickly these problems is essential. For example, in a software handling credit card payments or in a telephone switching system, while a degradation of perfor-mance may be accepted for a short time, the complete down time of the system is a catastrophic event causing millions
of dollars of losses.
High availability may be thought of as composed by two elements: the mean time between failures and the mean time to repair. While the mean time between failures is es-sentially a result of the development process, the mean time to repair depends mostly on the maintenance process.
Software outsourcing has been considered as a solution to increase software availability reducing the total costs of ownership. Indeed, there are several advantages: costs may be reduced; moreover, each company concentrates efforts on its core business. However, in recent years, company organizations dramatically changed due to the globaliza-tion process connected to Informaglobaliza-tion and Communicaglobaliza-tion Technologies (ICT). The ICT boom is pervasively and rad-ically changing several areas.
Maintenance teams, customers and sub-contractors may be spread out rather evenly all around the world and work-ing around the clock. Thus, when a system is gowork-ing to be outsourced and maintained in this new scenario, a mainte-nance process, accounting for the de-centralized company structures, needs to be conceived.
Large multi-site software systems, such as software han-dling stock markets or telephone switching systems, are likely to embed different technologies, languages and com-ponents. There may be real time software sub-systems, cou-pled with databases, user interfaces, communication mid-dleware, and network layers cooperating to provide busi-ness critical functionalities. Therefore, a variety of infor-mation, knowledge and skills are required to maintain the system. Maintaining networking, databases, middleware, Commercial Off-The-Shelf (COTS) components, real time applications, or GUI requires programmers trained on the different technologies and application area.
Given the ICT infrastructure, different teams, with dif-ferent expertise, may be located in difdif-ferent places. The overall goal of obtaining the lowest, economically feasible, mean time to repair may be thus conceived as the problem
of routing an incoming maintenance request (ticket) to a maintenance team, balancing the workload between teams, matching required maintenance knowledge with team skill, and minimizing the time to repair. Maintenance ticket clas-sification also allows to give each ticket the appropriate pri-ority, thus speeding up most critical tasks.
In this paper we propose to adopt an approach inspired by intelligent active agents (also called bots), to automati-cally classify incoming tickets routing them to maintenance teams. The final goal is to develop a router, working around the clock, that, without human interventions, routes incom-ing tickets with the lowest misclassification error, measured with respect to a given routing policy.
Tools exist supporting similar approaches; for example, Bug-Buddy (see http://www.gnome.org) is a front end help-ing the customers to fill the ticket request assignhelp-ing severity level, area, etc. Tickets are then dispatched by the team leader, or by someone in charge to coordinate maintenance activities.
Software systems, such as the intelligent active software agents may, possibly, be used in this context. However, such agents are more tied to applications where people want to know how to get the information they need from the Inter-net. We are mostly concerned here with the classification of incoming maintenance requests, thus the essential com-ponent is a ticket classifier. In that case, users explicitly in-dicate the category of the request selecting it from a combo box of the tool.
To build the classification engine, we compared different approaches, derived from pattern recognition (classification trees, support vectors, Bayesian classifiers), information retrieval (distance classification) and clustering (k-nearest neighbor classification) on a ticket classification task. 6000 maintenance tickets from a very large, multi-site, software system, spanning about two years of system in-field op-eration, were used to assess the accuracy of different ap-proaches. The application and the tickets were divided into eight areas and pre-classified by human experts (i.e., main-tenance team leaders). The eight ticket categories are rep-resentative both of the different skills required to maintain the system and the available team composition. In other words, each category matches a dedicated pool of mainte-nance teams.
The paper is organized as follows. First, basic notions on classification approaches are briefly summarized in Section 2 for the sake of completeness. Then, Section 3 introduces the adopted classification schema and the approach. Sec-tions 4 and 5 present the case study and the results obtained from the classification task.
2. Background Notions
In the following subsections five models are described: Probabilistic model, Vector Space model, Support Vec-tor Machine, Classification And Regression Trees and k-nearest neighbor classification. Experiments were also per-formed using neural networks, but results obtained were poor, if compared with other methods. In the Probabilis-tic model, free text documents are ranked according to the probability of being relevant to a query. The Vector Space model treats documents and queries as vectors; documents are ranked against queries by computing a distance function between the corresponding vectors. Support Vector Ma-chine, a new learning method introduced by V. Vapnik [18], finds the optimal linear hyperplane such that the expected classification error for unseen test sample is minimized. Classification And Regression Trees is a non-parametric technique that can select from among a large number of variables those and their interactions that are most impor-tant in determining the outcome variable to be explained. K-nearest neighbor classification clusters objects according to their Euclidean distance.
In this paper we consider as documents to be classified the incoming maintenance tickets. Queries are the tickets in the training set.
2.1. Probabilistic IR model
This model computes the ranking scores as the probabil-ity that a ticket is related to a class of tickets (see Section
4) (that is the query ).
!"#%$
Applying Bayes’ rule [3], the above conditioned proba-bility can be transformed in:
!"&%$'(
!"&)$*!"& !"&'
For a given class of ticket,+-,/.0)1 is a constant and we
can further simplify the model by assuming that all tickets have the same probability. Therefore, for a given class of tickets , all incoming tickets 2 are ranked by the
con-ditioned probabilities +-,3.54*1. Under quite general
as-sumptions [6, 15] and considering a unigram approxima-tion, that is, all words6'7 in the ticket are independent, the
following expression is obtained:
8* %'9:!"#)$ 9 (1) :!"&8;"<=;?>@BABABA=;DCE$ 2F C G HBI < !"&8; H $
Unigram estimation is based on the term frequency of each word in a ticket. However, using the simple term
frequency would turn the product
7
+-,/.6 7 4 1 to
zero, whenever any word6 7 is not present in the ticket .
This problem, known as the zero-frequency problem [19], can be avoided using different approaches (for more details see [6, 15]).
2.2. Vector Space IR model
Vector Space IR models map each incoming ticket and each query (i.e., tickets in the training set) onto a vec-tor [10]. In our case, each element of the vecvec-tor corresponds to a word (or term) in a vocabulary extracted from the tick-ets themselves. If 4 4 is the size of the vocabulary, then the
vector
represents the ticket
2. The
-th element is a measure of the weight of the -th term
of the vocabulary in the ticket9. Different measures have
been proposed for this weight. In the simplest case it is a Boolean value, either 1 if the -th term occurs in the ticket , or 0 otherwise; in other cases more complex measures
are constructed according to the frequency of the terms in the documents.
We use a well known IR metric called - ! " [16].
Ac-cording to this metric, the -th element
is derived from
the term frequency
of the
-th term in the ticket and
the inverse document frequency " !
of the term over the
entire set of documents. The vector element is:
#
%$&" (' %$&*) ,+.-8
#
'&@
In this paper we adopted a common similarity measure, know as the cosine measure, which determines the angle between the ticket vectors and the query vector when they are represented in a -dimensional Euclidean space.
2.3
Support Vector Machine
Support Vector Machine (SVM) is a learning algo-rithm based on the idea of structural risk minimization (SRM) [18] from computational learning theory. The clas-sification’s main purpose is to obtain a good generaliza-tion performance, that is a minimal error classifying unseen test samples. SRM shows that the generalization error is bounded by the sum of the training set error and a term depending on the Vapnik-Chervonenkis (VC) dimension of the learning machine.
Given a labeled set of/ training samples.0 1 1, where 0 *24365 is the i-th input vector component and1 is the
as-sociated label .1#7298;:=<<?> 1, a SVM classifier finds the
optimal hyperplane that correctly separates (classifies) the largest fraction of data points while maximizing the dis-tance of either class from the hyperplane (the margin).
Vapnik [18] shows that maximizing the margin distance is equivalent to minimizing the VC dimension in construct-ing an optimal hyperplane. Computconstruct-ing the best hyperplane is posed as a constrained optimization problem and solved using quadratic programming techniques. The discriminat-ing hyperplane is defined by the level set of
.01@
A
B
C
1#ED GF6H.00 1JILK (2)
where H.C1 is a kernel function and the sign of .0 1
determines the membership of0 . Constructing an optimal
hyperplane is equivalent to finding all the nonzeroD . Any
vector0 that corresponds to nonzeroD is a supported vec-tor (SV) of the optimal hyperplane. A desirable feature of
SVM is that the number of training points, which are re-tained as support vectors is usually quite small, thus provid-ing a compact classifiers.
For a linear SVM, the kernel function is just a simple dot product in the input space, while the kernel function in a nonlinear SVM effectively projects the samples to a feature space of higher (possible infinite) dimension via nonlinear mapping functionM from the input space3ON toPQ@RM .01
in a feature space F and the construct a hyperplane in F. The motivation behind this mapping is that it is more likely to find a linear hyperplane in the high dimensional feature space.
2.4
Classification And Regression Trees
The Classification and Regression Trees (CART) method, introduced by Breiman et al. [4], is a binary recur-sive method that yields a class of models called tree-based models. CART is an alternative to linear and additive mod-els for regression and classification problems. It is inter-esting due to its capability of handling both continuous and discrete variables, its inherent ability to model interaction among predictors and its hierarchical structure. CART can select those variables and their interactions that are most im-portant in determining an outcome or dependent variable. If the dependent variable is continuous, CART produces regression trees; if the dependent variable is categorical, CART produces classification trees. In both classification and regression trees, CART’s major goal is to produce an accurate set of data classifiers by uncovering the predictive structure of the problem under consideration.
CART generates binary decision trees: the recursive par-titioning method can be described on a conceptual level as a process of reducing the measure of “impurity”. For a
classi-fication problem, this impurity is measured by the deviance (or the sum of squares) of a particular node :
J@ B 7 7/.< : 71 (3)
where , known as the Gini index, is the deviance for
the J: node,& is the number of classes in the node and
7 is the proportion of observation that are in the classH .
2.5
H-Nearest Neighbor classification
H -Nearest Neighbor algorithm is the most basic
instance-based classification method. It assumes all object corre-spond to points in a -dimensional space. The distance
be-tween two object0 and1 is determined by .0J1/1, defined
as the standard Euclidean distance, and, given a query ob-ject0 to be categorized, theH -nearest neighbors are
com-puted in terms of this distance. The value ofH is critical,
and typically it is determined through conducting a series of experiments using different values ofH . More details can
be found in [13].
3. The Proposed Approach
When users detect a fault on a software system, they prepare an error-reporting log (what we call maintenance ticket), describing the problem as it appears from an ex-ternal point of view (thus having no clue on what kind of problem is it, nor who could better solve it). The ticket is then sent to an assessment team that performs analysis on the ticket description, according to the experience and to the knowledge previously built by solving similar problems. After analyzing it, the assessment team sends the ticket to the most appropriate maintenance team (e.g., DBMS ad-ministrators, CICS experts, GUI programmers, etc.).
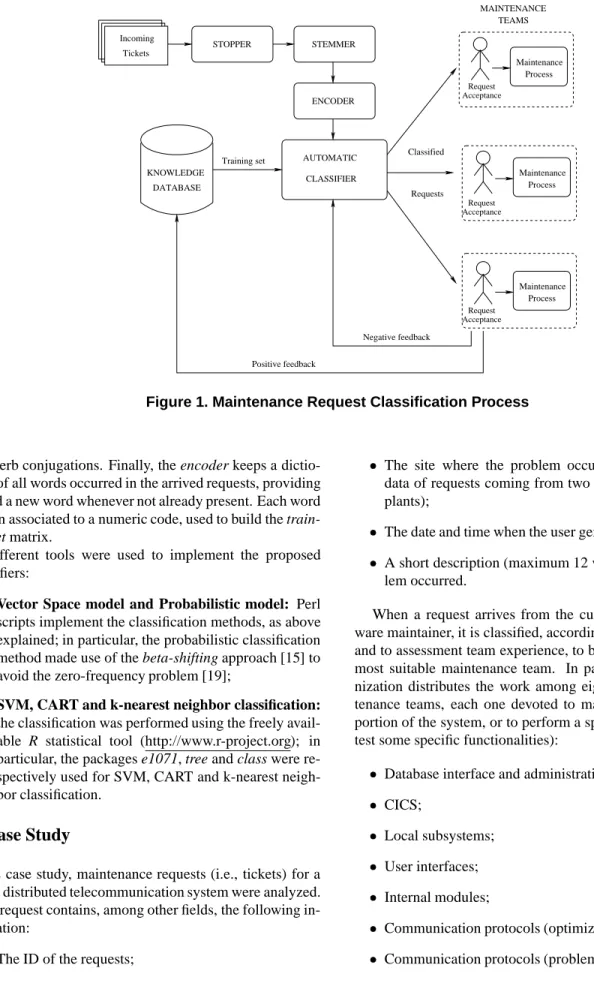
Our purpose is to apply information retrieval and machine-learning methods to automatically perform the classification activity above described. The classification process, described in this section, is shown in Figure 1.
When a maintenance request arrives, its textual descrip-tion is firstly pruned from stop words using a stopper; then, a stemmer provides to bring back each word to its radix (i.e., verbs to infinitive, nouns to singular form, etc.). In case of classification by SVM, CART, and k-nearest neighbor clas-sification, all words of each request are also numerically encoded.
Subsequently the classifier, exploiting the knowledge contained into the knowledge database, coming from previ-ous arrived (and therefore already classified) requests, pro-vides to classify the request.
The classification approach, and the content of the
knowledge database, change according to the classification
method adopted:
Vector Space model: the knowledge database
con-tains, for each request of the training set, the frequency of each word, and the class the request belongs to; the incoming request is then compared with each one of the training set, and it is then associated to the class of the training set request having the smaller Euclidean distance from it;
Probabilistic model: for each class of requests, a
word probability distribution is estimated, according to training set requests. The incoming request is then associated to the class maximizing the request proba-bility;
SVM, CART and k-nearest neighbor classification:
training set requests are represented as a matrix of
codes, each row represents a request and each column a word. Such a matrix is used to build a mathemati-cal model (i.e., a SVM, a CART or a k-nearest neigh-bor classifier) to predict the class of incoming requests. The number of column of the matrix corresponds to the maximum number of words available for describing a request; the absence of words is denoted with a spe-cial code. As highlighted in Section 5, not all columns (i.e., not all the words) are, in general, used to build the mathematical model.
Once a request has been classified, it is dispatched to an associated maintenance team. The team produces a feed-back to the classifier:
1. The team recognizes the request as belonging to it, and therefore the feedback is positive; the classified request is added to the knowledge database;
2. The team does not recognize the request, and sends a negative feedback to the classifier, that perform a new classification based on the new gained knowledge. In this paper, this simply means that a new classification is performed excluding the previously chosen class. However, more sophisticated reinforcement-learning strategies [13] can be adopted.
3.1. Tool Support
The process shown in Figure 1 was completely auto-mated. This is particularly relevant, since the purpose of this work is to dispatch maintenance requests without any human intervention.
The stopper was implemented by a Perl script that prunes requests from all words contained in a stop-list. The
MAINTENANCE TEAMS Process Maintenance Process Maintenance Process Maintenance Request Acceptance Request Acceptance Request Acceptance AUTOMATIC STOPPER ENCODER CLASSIFIER DATABASE KNOWLEDGE Positive feedback Negative feedback Training set Requests Classified Incoming STEMMER Tickets
Figure 1. Maintenance Request Classification Process
and verb conjugations. Finally, the encoder keeps a dictio-nary of all words occurred in the arrived requests, providing to add a new word whenever not already present. Each word is then associated to a numeric code, used to build the
train-ing set matrix.
Different tools were used to implement the proposed classifiers:
Vector Space model and Probabilistic model: Perl
scripts implement the classification methods, as above explained; in particular, the probabilistic classification method made use of the beta-shifting approach [15] to avoid the zero-frequency problem [19];
SVM, CART and k-nearest neighbor classification:
the classification was performed using the freely avail-able R statistical tool (http://www.r-project.org); in particular, the packages e1071, tree and class were re-spectively used for SVM, CART and k-nearest neigh-bor classification.
4. Case Study
As case study, maintenance requests (i.e., tickets) for a large, distributed telecommunication system were analyzed. Each request contains, among other fields, the following in-formation:
The ID of the requests;
The site where the problem occurred (we analyzed data of requests coming from two different telephone plants);
The date and time when the user generated the request;
A short description (maximum 12 words) of the prob-lem occurred.
When a request arrives from the customer to the soft-ware maintainer, it is classified, according to its description and to assessment team experience, to be dispatched to the most suitable maintenance team. In particular, this orga-nization distributes the work among eight different main-tenance teams, each one devoted to maintain a particular portion of the system, or to perform a specific task (e.g., to test some specific functionalities):
Database interface and administration;
CICS; Local subsystems; User interfaces; Internal modules;
Communication protocols (optimization);
Generic problem solving.
For instance, a request having the description “Data
modified by another terminal while booking” belongs to
category “User interfaces”, while “Data not present in
per-mutator archive” belongs to category “Local subsystems”.
A total of 6000 requests, arrived from the beginning of 1998 to the June of 2000, were analyzed.
5. Experimental Results
Maintenance request tickets from the case study de-scribed in Section 4 were classified following the process explained in Section 3. We compared all methods described in Section 2, also analyzing performances obtained with the availability of maintainer’s feedback.
5.1. Comparison of the Classification Methods
In order to compare performances of the different meth-ods, a 10-fold cross-validation [17] for the five models was performed on the entire pool of tickets (6000). Percentages of correct classification (Table 1) and paired t-test results (Table 2) show how Probabilistic model, k-nearest neighbor classification (for which we experienced that the best choice forH isH @ < ) and SVM perform significantly better than
other methods.
Method % of correct
classifications
Vector Space model 70%
Probabilistic model 80%
k-nearest neighbor classification 82%
CART 71%
SVM 84%
Table 1. Percentage of correct classifications (10-fold cross validation)
Vector Prob. k-nearest CART SVM
Spaces model neighbor
Vector Spaces X 0 0 0 0
Prob. model 1 X 0.47 1 0.26
k-nearest neighbor 1 0.53 X 1 0.18
CART 1 0 0 X 0
SVM 1 0.74 0.82 1 X
Table 2. Paired t-test p-values (D@ ) - Hyp:
one method performs better than others
In particular, Table 2 shows, in each position ,
p-values for a paired t-test, where the hypothesis tested is that
the method in row performs better than method in column
.
Successively, different kind of experiments were per-formed:
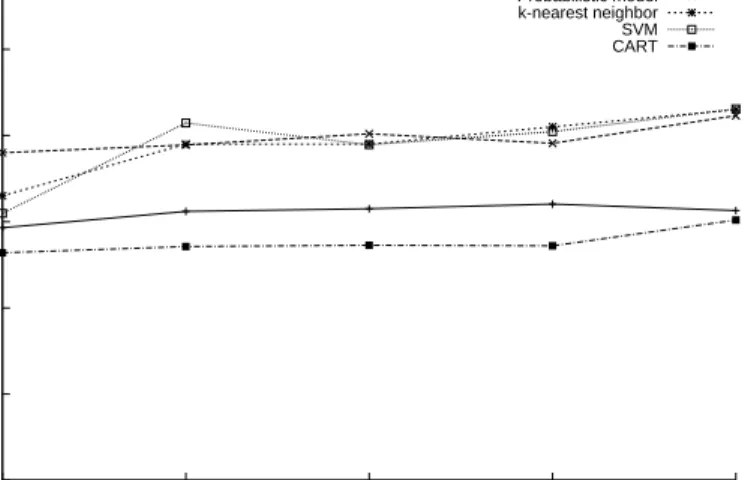
1. In the first case, the training set and the test set were randomly extracted from the entire request set; the ex-periment was repeated a high number of times, to en-sure a convergence (i.e., a standard deviation of results for different iterations below 5%), and the average re-sults are reported in Figure 2 where, for different sification methods, the percentage of successfully clas-sified request is shown. The size of the training set var-ied from 1000 tickets (with a test set of 5000 tickets) to 5000 tickets (with a test set of 1000 tickets). 2. In the second case, training set and test set were built
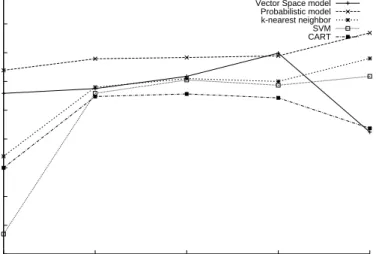
considering the requests in the same order they arrived to the maintainer. The size of the training sets consid-ered was the same as for the randomly generated sets. This experiment aimed to simulate how the arriving re-quests were, firstly, classified according to the previous arrived ones, and then, on their own, put in the knowl-edge database (Figure 1) to better classify successive arrivals. Results are shown in Figure 3. Similar re-sults were obtained increasing the training set every six months.
Further details should be given for SVM, k-nearest neighbor and CART classification. One may decide to use all available information (i.e., all words of each request) to perform a classification. However, we experienced that, us-ing few words, the results substantially improved. In partic-ular, two words for SVM and k-nearest neighbor, and three for CART, ensured the best performances. Analysis per-formed on the tickets revealed that, usually, first words of each ticket description sufficed to perform a ticket classi-fication (the remaining part of the ticket is a detailed de-scription of the problem occurred). Similar analysis per-formed for other methods (Probabilistic model and Vector Space model) revealed that, reducing the set of words used for classification, performances decreased.
Let us now analyze the results obtained. Figures 2 and 3 show how the Probabilistic model, SVM and k-nearest neighbor perform substantially better than other methods, although SVM and k-nearest neighbor require a slightly larger training set (i.e., its plots start lower) to reach high performances.
It is worth noting how, sometimes, Vector Space model and CART tend to get worse as training set grows. This non-intuitive behavior is due to the fact that, since for Vec-tor Space model the classification is performed comparing a request with all the requests in the training set, and search-ing for the one havsearch-ing the smallest distance, then it may
40 50 60 70 80 90 100 1000 2000 3000 4000 5000 Correct Classifications (%) Training set
Vector Space model Probabilistic model k-nearest neighbor SVM CART
Figure 2. Classification of randomly-selected requests
happen that a training set request, very similar to the one to be classified, belongs to a different class. This may lead to a classification failure. It is evident how the probability that this phenomenon occurs increases with the training set. Instead, the Probabilistic model aims to build a word distri-bution for each class of requests, so such a kind of request does not substantially affect the results.
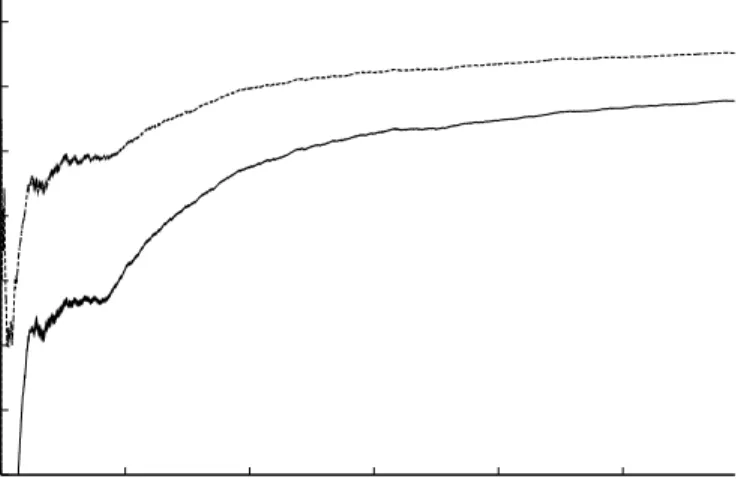
5.2. Classification with Feedback
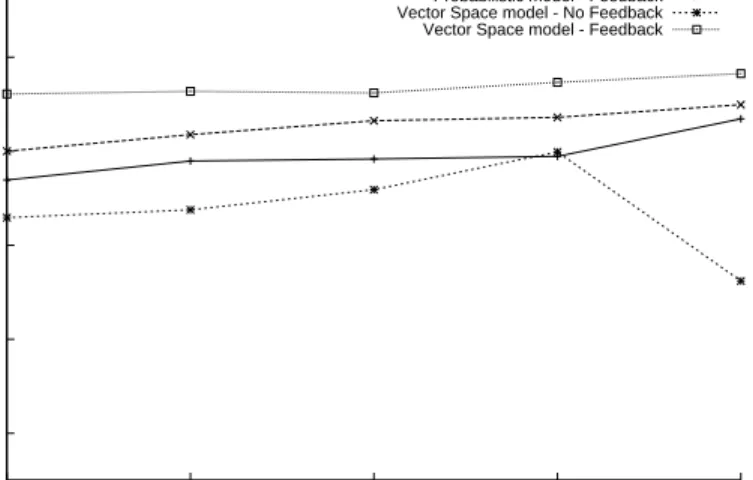
This step aims to analyze how, when a classification fails, a maintainer’s negative feedback can be used to perform a new, possibly better, classification. Results, for Proba-bilistic model and Vector Space model, are shown in Fig-ure 4. As in FigFig-ure 3, the training set and the test set were extracted following a time sequence. For the Probabilis-tic model the performance increase is, on average, of about 7%, and the 30% of the misclassified requests are success-fully classified using the added negative information. For the Vector Space model the performance increase is of about 25% and, in the 72% of the cases, fed-back requests are cor-rectly classified. 10-fold cross-validation reported 86% of correct classifications for Probabilistic model and 93% for Vector Space model. Also the paired t-test (withD @ )
confirms the significance of the results (
:
@ on
both cases for the hypothesis that distributions are equal). Finally, we experienced that the behavior for SVM, CART and k-nearest neighbor is similar to that of Probabilistic model.
Analysis performed revealed that the phenomenon is es-sentially due to the fact that, often, a misclassification can be due to the fact that an incoming ticket could be very
sim-ilar to one in the training set belonging to a different class, and it is therefore associated to it. Excluding that request from the training set usually grants a correct classification. For Probabilistic model, classification is performed using as queries word distribution of entire class of requests, there-fore if a request badly fits a distribution (of fits a wrong one), after removing that class the request may be again wrongly associated to another distribution.
5.3. Incremental Training Set
Finally, we tried to simulate the process exactly as de-scribed in Figure 1: each request was classified according to the previous arrived ones, i.e., considering all them as
training set. Results, computed applying the Probabilistic
model, for chronologically ordered requests, are shown in Figure 5.
6. Lesson Learned
Results reported in Section 5 showed how the proposed approach allows to effectively classify maintenance request tickets upon their description.
Thus, such a tool, properly integrated in a workflow management system, can substantially improve the perfor-mances of the maintenance process. Moreover, it may be considered as a part of a queueing network composed by multiple, parallel queues, one for each type of request (so-phisticating therefore the model proposed in [2], where a single-queue model was adopted to dispatch requests to maintenance teams independently from the type of
inter-10 20 30 40 50 60 70 80 90 100 1000 2000 3000 4000 5000 Correct Classifications (%) Training set
Vector Space model Probabilistic model k-nearest neighbor SVM CART
Figure 3. Classification following a time sequence
vention and the expertise of each team). The automatic dis-patcher may also be integrated in a bug-reporting tool like Bug-Buddy or in an environment such that described in [7], where maintenance requests for a large-use commercial or open-source product are posted via Internet.
A comparison of the different classification methods highlights that a Probabilistic model performs, on average, better than the other methods and, moreover, ensures that growing the training set almost always increase the classifi-cation precision (this is not guaranteed by the other method, especially the Vector Space model, as explained in Sec-tion 5). Good results (as highlighted performing 10-fold cross-validation, see Table 1) were also obtained adopting SVM or k-nearest neighbor. In the opinion of the authors, a Probabilistic model classification may be further improved, considering the words appearing inside each request not in-dependent each one from another, i.e., modelingK 3,
. Classification using SVM, k-nearest neighbor and CART confirmed that, as also stated by Votta and Mockus in [14], a request can be successfully classified using few,
discrim-inating words. However, our approach differs from that
of [14], in that we could not apply a keyword-based cri-terion: even if we experienced that often the first words of a ticket contain most of the useful information needed for classification, these words are, in our case study, (and could be in general) uniformly distributed respect to the whole dictionary of terms.
Figure 4 shows that feedback improves performances differently for different method. Since Probabilistic model performs better in the first classification, while Vector Space model takes maximum advantage from the feedback, a hy-brid strategy ensures the best performances. Further
inves-tigations, particularly devoted to apply reinforcement learn-ing, should be performed.
Finally, Figure 5 highlights how the system “learns” as the knowledge database grows. It is worth noting how, after an initial transient exhibiting oscillations and a slow raise time, performances tends to reach a steady-state value.
7. Related Work
Several similarities exist between this paper and the work of Mockus and Votta [14]. In [14] maintenance re-quests were classified according to maintenance categories as IEEE Std. 1219 [1], then rated on a fault-severity scale using a frequency-based method. On the other hand, we adopted a different classification schema, where severity rate is actually imposed by customers, while the matching of the ticket with the maintenance team is under the respon-sibility of the maintenance company.
Burch and Kung [5] investigated into the changes of maintenance requests, during the lifetime of a large soft-ware application, by modeling the requests themselves.
The necessity of an automatic dispatcher for mainte-nance request was highlighted in [7], where web-based maintenance centers were modeled by queueing theory, and in the more general queueing process described in [2]. In particular, in [7] was demonstrated that, for moderate lev-els of misclassification, the overall system performance is somehow degraded and, however, the majority of customers still experiences a reduction of the average service time.
In recent years there has been a great deal of interest in applying, besides traditional statistical approach, machine-learning and neural network methods to a variety of
prob-20 40 60 80 100 120 1000 2000 3000 4000 5000 Correct classifications (%) Training set
Probabilistic model - No Feedback Probabilistic model - Feedback Vector Space model - No Feedback Vector Space model - Feedback
Figure 4. Probabilistic-model Classification following a time sequence case of feedback
lems related to classify and extract information from text. Literature reports some relevant research in the area of auto-mated text categorization: in 1994 Lewis and Ringuette [12] presented empirical results about the performance of a Bayesian classifier and a decision tree learning algorithm on two text categorization data sets, finding that both al-gorithms achieve reasonable performance. In 1996 Gold-berg [9] empirically tested a new machine learning algo-rithm, CDM, designed specifically for text categorization, and having better performances than Bayesian classifica-tion and decision tree learners. In 1998, Dumais et al. [8] compared different automatic learning algorithms for text categorization in terms of learning speed and classification accuracy; in particular, they highlighted SVM advantages in terms of accuracy and performances. Joachims [11] per-formed a set of binary text classification experiments using the SVM and comparing it with other classification tech-niques.
8. Conclusions
We proposed an approach, inspired by intelligent active agents, for the automatic classification of incoming mainte-nance tickets, in order to route them to the most appropriate maintenance teams. Our final goal is to develop a router, working around the clock, that, without human intervention, routes incoming tickets with the lowest misclassification er-ror, ensuring to achieve the shortest possible mean time to repair.
We compared, in classifying real world maintenance tasks, different approaches derived from pattern recognition (classification trees, support vectors, Bayesian classifiers),
information retrieval (distance classification) and cluster-ing (k-nearest neighbor classification). Tickets were clas-sified into eight categories representative both of the differ-ent skills required to maintain the system and the available team composition; in other words, each category matches a dedicated pool of maintenance teams. Empirical evidence showed that, especially using Probabilistic model, k-nearest neighbor and SVM, the automatic classification resulted as affective, thus helpful for the maintenance process.
Future works will be devoted to apply more sophisticated Probabilistic models (i.e., K ,
), as well as reinforce-ment learning strategies. Furthermore, classification will be used for the entire maintenance process, also to determine the specific category of intervention to be executed, accord-ing to the description of maintenance activities previously performed on similar requests. Automatic assignment of priorities will also be introduced, to allow immediate dis-patching of the most critical requests.
9. Acknowledgments
This research is supported by the project ”Virtual Soft-ware Factory”, funded by Ministero della Ricerca Scien-tifica e Tecnologica (MURST), and jointly carried out by EDS Italia Software, University of Sannio, University of Naples ”Federico II” and University of Bari.
Authors would also thank anonymous reviewers for giv-ing precious inputs to prepare the camera-ready copy of the paper.
20 30 40 50 60 70 80 90 100 0 1000 2000 3000 4000 5000 Correct Classifications (%) Training set No Feedback Feedback
Figure 5. Incremental Training Set: Probabilistic-model Classification (following a time sequence)
References
[1] IEEE std 1219: Standard for Software maintenance. 1998. [2] G. Antoniol, G. Casazza, G. A. Di Lucca, M. Di Penta, and
F. Rago. A queue theory-based approach to staff software maintenance centers. In Proceedings of IEEE International Conference on Software Maintenance, November 2001. [3] L. Bain and M. Engelhardt. Introduction to Probability
and Mathematical statistics. Duxburry Press, Belmont,CA, 1992.
[4] L. Breiman, J. Friedman, R. Olshen, and C. Stone. Classifi-cation and Regression Trees. Chapman & Hall, New York, 1984.
[5] E. Burch and K. H.J. Modeling software maintenance re-quests: A case study. In Proceedings of IEEE International Conference on Software Maintenance, pages 40–47, 1997. [6] R. De Mori. Spoken dialogues with computers. Academic
Press, Inc., Orlando, Florida 32887, 1998.
[7] M. Di Penta, G. Casazza, G. Antoniol, and E. Merlo. Model-ing web maintenance centers through queue models. In Con-ference on Software Maintenance and Reengineering, pages 131–138, March 2001.
[8] S. Dumais, J. Platt, D. Heckerman, and M. Sahami. In-ductive learning algorithm and representation for text cat-egorization. In Conference on Information and Knowledge Management, pages 148–155, November 1998.
[9] J. Goldberg. Cdm: an approach to learning in text cate-gorization. International Journal on Artificial Intelligence Tools, 5(1/2):229–253, 1996.
[10] D. Harman. Ranking algorithms. In Information Retrival: Data Structures and Algorithms, pages 363–392. Prentice-Hall, Englewood Cliffs, NJ, 1992.
[11] T. Joachims. Text categorization with support vector ma-chines: Learning with many relevant features. In European Conference in Machine Learning, 1998.
[12] D. Lewis and M. Ringuette. A comparison of two learning algorithms for text categorization. In Third Annual Sympo-sium on Document Analysis and Information retrivial, pages 81–93, Las Vegas, NV, April 1994.
[13] T. Mitchell. Machine Learning. McGraw-Hill, USA, 1997. [14] A. Mockus and L. Votta. Idenitifying reasons for software
changes using historic database. In Proceedings of IEEE International Conference on Software Maintenance, pages 120–130, San Jose, California, October 2000.
[15] H. New and U. Essen. On smoothing techniques for bigram-bases natural language modelling. In Proceedings of the IEEE International Conference on Acoustics, Speech and Signal Processing, volume S12.11, pages 825–828, Toronto Canada, 1991.
[16] G. Salton and C. Buckley. Term-weighting approaches in automatic text retrieval. Information Processing and Man-agement, 24(5):513–523, 1988.
[17] M. Stone. Cross-validatory choice and assesment of statisti-cal predictions (with discussion). Journal of the Royal Sta-tistical Society B, 36:111–147, 1974.
[18] V. Vapnik. The Nature of Statistical Learning Theory. Springer-Verlag, Berlin, Germany, 1995.
[19] I. H. Witten and T. C. Bell. The zero-frequency problem: Estimating the probabilities of novel events in adaptive text compression. IEEE Trans. Inform. Theory, IT-37(4):1085– 1094, 1991.