Leveraging Open Source Software to Create Technical
Animations of Scientific Data
by John M. Vines
ARL-TR-3918 September 2006
NOTICES Disclaimers
The findings in this report are not to be construed as an official Department of the Army position unless so designated by other authorized documents.
Citation of manufacturer’s or trade names does not constitute an official endorsement or approval of the use thereof.
DESTRUCTION NOTICE⎯Destroy this report when it is no longer needed. Do not return it to the originator.
Army Research Laboratory
Aberdeen Proving Ground, MD 21005-5066
ARL-TR-3918 September 2006
Leveraging Open Source Software to Create Technical
Animations of Scientific Data
John M. Vines
Computational and Information Sciences Directorate, ARL
REPORT DOCUMENTATION PAGE OMB No. 0704-0188Form Approved
Public reporting burden for this collection of information is estimated to average 1 hour per response, including the time for reviewing instructions, searching existing data sources, gathering and maintaining the data needed, and completing and reviewing the collection information. Send comments regarding this burden estimate or any other aspect of this collection of information, including suggestions for reducing the burden, to Department of Defense, Washington Headquarters Services, Directorate for Information Operations and Reports (0704-0188), 1215 Jefferson Davis Highway, Suite 1204, Arlington, VA 22202-4302. Respondents should be aware that notwithstanding any other provision of law, no person shall be subject to any penalty for failing to comply with a collection of information if it does not display a currently valid OMB control number.
PLEASE DO NOT RETURN YOUR FORM TO THE ABOVE ADDRESS. 1. REPORT DATE (DD-MM-YYYY)
September 2006
2. REPORT TYPE Final
3. DATES COVERED (From - To)
5a. CONTRACT NUMBER
5b. GRANT NUMBER 4. TITLE AND SUBTITLE
Leveraging Open Source Software to Create Technical Animations of Scientific Data
5c. PROGRAM ELEMENT NUMBER
5d. PROJECT NUMBER 6UH7CC 5e. TASK NUMBER 6. AUTHOR(S)
John M. Vines (ARL)
5f. WORK UNIT NUMBER 7. PERFORMING ORGANIZATION NAME(S) AND ADDRESS(ES)
U.S. Army Research Laboratory
Computational and Information Sciences Directorate Aberdeen Proving Ground, MD 21005-5066
8. PERFORMING ORGANIZATION REPORT NUMBER
ARL-TR-3918
10. SPONSOR/MONITOR’S ACRONYM(S) 9. SPONSORING/MONITORING AGENCY NAME(S) AND ADDRESS(ES)
11. SPONSOR/MONITOR’S REPORT NUMBER(S)
12. DISTRIBUTION/AVAILABILITY STATEMENT
Approved for public release; distribution is unlimited. 13. SUPPLEMENTARY NOTES
14. ABSTRACT
Open source animation software packages provide a means for which scientists, researchers, and engineers can develop technically correct animation at no cost. The U.S. Army Research Laboratory spends tens of thousands of dollars annually for software licenses for packages such as Maya, Houdini, and 3D Studio Max, while in many instances, an open source package such as Blender3D would suffice.
15. SUBJECT TERMS
high performance computing; HPC; Python; scientific; visualization 16. SECURITY CLASSIFICATION OF:
19a. NAME OF RESPONSIBLE PERSON John M. Vines a. REPORT Unclassified b. ABSTRACT Unclassified c. THIS PAGE Unclassified 17. LIMITATION OF ABSTRACT SAR 18. NUMBER OF PAGES
15 19b. TELEPHONE NUMBER (Include area code) 410-278-9150
Standard Form 298 (Rev. 8/98) Prescribed by ANSI Std. Z39.18
Contents
List of Figures iv 1. Introduction 1 2. Discussion 1 3. Conclusions 5 4. References 7 Appendix A. Blender Python Script Importing and Animating Time Variant Data 9 Distribution List 12List of Figures
Figure 1. Blender3D user interface...4
Figure 2. Blender3D rendered image, time step 1. ...4
Figure 3. Blender3D rendered image, time step 300. ...5
1. Introduction
The objective of this technical report is to provide data about the use of open source software tools to create scientifically correct technical animations from scientific data. The packages used were Blender 3D, blender3d.org, and the Visualization Toolkit (VTK), www.vtk.org. Television and movie industry animation packages, such as Maya1, Houdini2, Lightwave3 or 3D Studio Max1
, are very powerful and very costly. These programs are very good at importing, animating, and render-ing the millions of polygons created by large scientific data sets. My objective was to see if we could employ an open-source package with the same or nearly the same results as using a professional package.
2. Discussion
The first place that I started when reviewing Blender3D was the number of polygons supported; at present, version 2.42 supports as many as 2 billion faces per scene. A face can be comprised of quadrilateral or triangular polygons. On average, a scientific data set may encompass 500,000 to 1,000,000 cells or polygons; larger data sets contain well over 1,000,000 and approach
1,000,000,000 cells or polygons. The data that I am using have at most 750,000 polygons; therefore, Blender3D will have no problems with the data.
At the very heart of Blender3D is the Python4 programming language. Python is a high-level
programming language designed by Guido van Rossum in 1990. It is a dynamically typed, object-oriented language, which makes it similar to Perl5, Ruby, Scheme, Smalltalk6, and Tcl.
Python runs on Windows7, Linux8 or UNIX9, Palm Handhelds and is the primary programming
language for Nokia mobile phones. It was developed as an open-source project, under the Python Software Foundation. Its versatility allows for many different uses in many different areas. National Aeronautics and Space Administration uses it to streamline communication with Oracle’s databases for space shuttle missions, the New York Stock Exchange uses it to create
1Maya and 3D Studio Max are registered trademarks of Autodesk, Inc. 2Houdini is a registered trademark of Side Effects Software, Inc. 3Lightwave is a registered trademark of NewTek, Inc.
4Python is a trademark of Python Software Foundation. 5Perl is a trademark of The Perl Foundation.
6SmallTalk is a trademark of Active Information Corporation. 7Windows is a trademark of Microsoft Corporation.
8Linux is a registered trademark of Linus Torvalds. 9UNIX is a registered trademark of The Open Group.
graphical user interfaces (GUIs) for the real-time equity trading system, and Industrial Light and Magic use Python to “glue” together the thousands of computers and hundreds of software components in its computer graphics pipeline.
By default, Blender3D does not provide an interface for color-per-vertex shading. We needed to find a way to map scalar values from the data to the vertices, or nodes, of the polygonal data. I was able to accomplish this through the use of VTK and a new Python module, VTKBlender.py, written at the University of Alberta. VTK is an open source, freely available software system for three-dimensional (3-D) computer graphics, image processing, and visualization. VTK is a true visualization program, meaning that it does not just allow for simple geometry visualization but for a wide variety of algorithms that include scalar, vector, tensor, texture, and volumetric methods. It also allows for advanced modeling techniques such as implicit modeling, polygon reduction, mesh smoothing, cutting, contouring, and Delaunay triangulation.
The VTKBlender Python module was written at the University of Alberta's Academic Information and Communication Technology center. The module converts vtkPolyDataMapper’s to Blender3D polygonal meshes, with color-per-vertex information, and converts Blender3D meshes to
vtkPolyData.
VTKBlender.PolyDataMapperToBlender(pmapper, me=None)
If the function is run with only one argument, this function takes a vtkPolyDataMapper pmapper and returns a new blender mesh with the converted polydata. A second optional argument, which takes a pre-existing blender mesh, may be provided, causing the existing mesh to be overwritten with the polydata. Please note that the new mesh is not added to the scene and can be added afterwards via
sc = Blender.Scene.GetCurrent() ob = Blender.Object.New('Mesh') ob.link(me)
sc.link(ob)
The reason why the function takes a vtkPolyDataMapper object as an argument (instead of a vtkPolyData object) is because the vtkPolyDataMapper can also contain a look-up table to color the data, in which case, the blender mesh will have vertex colors set accordingly.
VTKBlender.BlenderToPolyData(me)
This function takes a blender mesh and returns a vtkPolyData object that contains the geometry contained in the mesh.
(http://www.ualberta.ca/CNS/RESEARCH/Vis/VTKBlender/index.html)
Blender 3D is an open-source software package used for 3-D modeling and animation developed as an in-house application by the Dutch animation studio NeoGeo and Not a Number Technologies
(NaN). Blender is available for use on many operating systems, including FreeBSD10, IRIX11,
GNU/Linux, Windows, Mac OSX, Solaris12, SkyOS, and MorphOS. Recent additions to Blender
support for 2 billion faces per scene, user interface enhancements and support for third party ray-tracing packages have brought its capabilities close to those of “high end” 3-D software, such as XSI, 3D Studio Max, and Maya, all professional programs used by Hollywood studios such as Pixar.
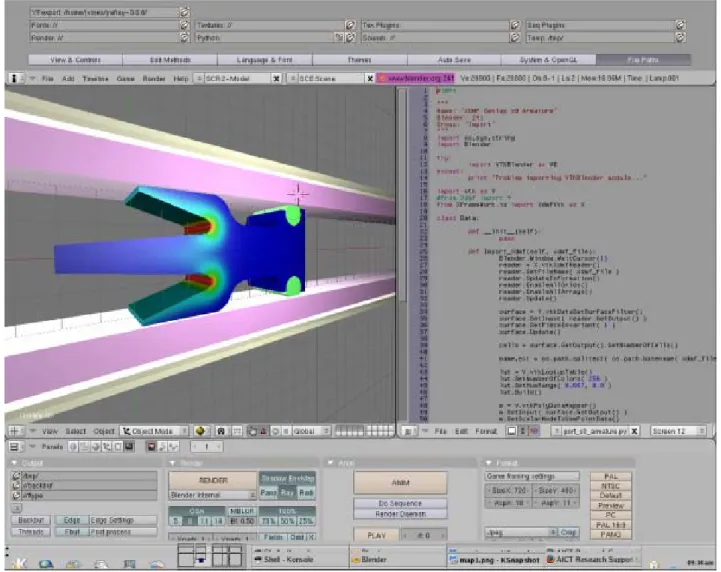
The user interface for Blender3D is highly customizable and configurable by the user. A typical “scripting” setup will have an OpenGL13 showing the data, a text editing window showing the
Python script, and application windows at the bottom of the screen comprised of rendering options, directory information, animation options and hierarchical data.
The Python program shown in figure 1 imports, animates, and renders the time-variant data on a local file system.
All polygonal objects in Blender3D are considered meshes. The VTKBlender module, “VTKBlender.py,” provides the interface between the VTK data and Blender3D creating the polygonal mesh and applying the color-per-vertex information “on the fly”.
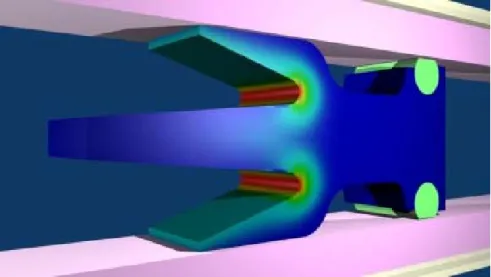
The data represented here are of an experimental armature for an electromagnetic weapon system. The rendered data show the electromagnetic forces in the X axial direction. In the completed animation, I was able to move the camera around the data showing multiple views of the data. The areas of interest (and showing where the forces are the greatest) are in red. The completed animation presents a complete picture of the performance of the candidate armature, presenting the color-per-vertex scientific data in a manner that is easily understood by the viewing audience. Figures 2, 3, and 4 show time-variant electromagnetic data rendered in Blender3D.
10FreeBSD is a registered trademark of The FreeBSD Foundation. 11IRIX is a trademark of Silicon Graphics, Inc. (SGI).
12Solaris is a trademark of Sun Microsystems, Inc. 13OpenGL is a registered trademark of SGI.
Figure 1. Blender3D user interface.
Figure 3. Blender3D rendered image, time step 300.
Figure 4. Blender3D rendered image, time step 500 (the last time step in data).
3. Conclusions
In the past, I have used animation packages such as Maya, Lightwave, 3D Studio Max, and Houdini to present and render scientific data. All these animation packages are tremendous at what they do, but there is a cost associated with each package and in some cases, it may be in the range of tens of thousands of dollars each year. Employing an open-source software package such as Blender3D to render photographic quality images and technical animations at no cost would save ARL and the Department of Defense tens of thousands of dollars each year in fees associated with software licenses and maintenance.
The incorporation of a Python interpreter at the very core of Blender3D provides an application programming interface to the data, thus providing a means to read and manipulate the data in a highly scientific manner.
4. References
1. Wikipedia. Python Programming Language, web site, http://em.wikipedia.org/wiki/ Python_programming_language, 2006.
2. Wikipedia. Visualization Toolkit (VTK), web site, http://em.wikipedia.org/wiki/VTK, 2006.
3. Visualization: VTK and Blender; http://www.ualberta.ca/CNS/ RESEARCH/Vis/
VTKBlender/index.html, 2006. 5. Web site, http://www.vtk.org/, 2006. 6. Web site, http://www.blender.org/, 2006.
Appendix A. Blender Python Script Importing and Animating Time Variant
Data
#!BPY """ Name: 'ANIMATE XDMF' Blender: 241 Group: 'Animation' """ import os,sys,string import Blenderfrom Blender.Scene import Render
try:
import VTKBlender as VB except:
print 'Problem importing VTKBlender module...'
import vtk as V #from Xdmf import *
from XFrameWork.io import XdmfVtk as X
class Data: iteration = 0 datadir = None name = None ext = None me = None ActiveScalar = 'FX' location = [[0,0,0]] def __init__(self):
"""reads XDMF files from directory""" pass
def ComputeAverageDistance(self): x_vector = 255
dx = x_vector / 18.0
print 'Computing average distance...', dx x = 0 for i in range( 18 ): loc = [ x + dx, 0, 0] self.location.append( loc ) x = x + dx print 'X: ', x del x_vector del dx def ImportTimesteps(self):
"""Checks to see if we have multiple timesteps, if so import them into Blender""" print '%d files' % self.iteration
if self.iteration != 0:
self.XdmfDataFiles.sort() for file in self.XdmfDataFiles:
path = self.datadir + '/' + file
self.Import_Xdmf( self.XdmfDataFiles.index( file ), path )
def Import_Xdmf(self, cntr, xdmf_file): print 'XDMF file: ', xdmf_file Blender.Window.WaitCursor(1) reader = X.vtkXdmfReader() reader.SetFileName( xdmf_file )
reader.UpdateInformation() reader.EnableAllGrids() reader.EnableAllArrays() reader.Update() surface = V.vtkDataSetSurfaceFilter() surface.SetInput( reader.GetOutput() ) surface.SetPieceInvariant( 1 ) surface.Update() cells = surface.GetOutput().GetNumberOfCells() lut = V.vtkLookupTable() lut.SetNumberOfColors( 256 ) lut.SetHueRange( 0.667, 0.0 ) lut.Build() m = V.vtkPolyDataMapper() m.SetInput( surface.GetOutput() ) m.SetScalarModeToUsePointData() m.GetInput().GetPointData().SetActiveScalars( self.ActiveScalar ) min, max = m.GetInput().GetScalarRange()
if min < 0.0: min = 0.0
print 'Scalar min: %f max: %f ' % ( min, max ) m.SetLookupTable( lut )
m.GetLookupTable().SetTableRange( min, max ) m.Update()
self.name,self.ext = os.path.splitext( os.path.basename( xdmf_file ) ) scn = Blender.Scene.GetCurrent()
if cntr == 0:
self.me = VB.PolyDataMapperToBlender( m ) ob = Blender.Object.New('Mesh', self.name) ob.link(self.me) #tell object to use new mesh scn.link(ob) #link object to current scene else:
self.u_me = VB.PolyDataMapperToBlender( m, self.me ) c_ob = scn.getActiveObject()
scn.unlink( c_ob )
ob = Blender.Object.New('Mesh', self.name)
ob.link(self.u_me) #tell object to use new mesh scn.link(ob) #link object to current scene cam = Blender.Object.Get('Camera') grp1 = Blender.Object.Get('armature_guides') grp2 = Blender.Object.Get('payload') lamp1 = Blender.Object.Get('Lamp') lamp2 = Blender.Object.Get('Lamp.001')
ob.makeParent( [cam, grp1, grp2, lamp1, lamp2] ) ob.setLocation( self.location[cntr] ) ob.sel = 1 ob.Layers = scn.Layers scn.update() Blender.Window.RedrawAll() del scn def RenderScene(self, cntr): context = Blender.Scene.GetCurrent().getRenderingContext() context.saveRenderedImage("%s.%04d.jpg" % ( self.ActiveScalar, cntr) ) context.setImageType(Render.JPEG) context.enableExtensions(1) context.render() del context def Main(self): self.ComputeAverageDistance() for i in range(1):
file = '/home/jvines/Devel/Coupling_05/EM_DYNA3D_COUPLING/TEST/Coupled_PROBED_%04d.xmf' % i self.Import_Xdmf( i, file ) self.RenderScene( i ) if __name__=="__main__": d = Data() d.Main()
NO. OF
COPIES ORGANIZATION
1 DEFENSE TECHNICAL (PDF INFORMATION CTR ONLY) DTIC OCA
8725 JOHN J KINGMAN RD STE 0944
FORT BELVOIR VA 22060-6218
1 US ARMY RSRCH DEV & ENGRG CMD SYSTEMS OF SYSTEMS INTEGRATION AMSRD SS T 6000 6TH ST STE 100 FORT BELVOIR VA 22060-5608 1 DIRECTOR
US ARMY RESEARCH LAB IMNE ALC IMS
2800 POWDER MILL RD ADELPHI MD 20783-1197 1 DIRECTOR
US ARMY RESEARCH LAB AMSRD ARL CI OK TL 2800 POWDER MILL RD ADELPHI MD 20783-1197 2 DIRECTOR
US ARMY RESEARCH LAB AMSRD ARL CS OK T 2800 POWDER MILL RD ADELPHI MD 20783-1197 ABERDEEN PROVING GROUND 1 DIRECTOR
US ARMY RSCH LABORATORY ATTN AMSRD ARL CI OK (TECH LIB) BLDG 4600
2 DIRECTOR
US ARMY RSCH LABORATORY ATTN AMSRD ARL CI HC J VINES BLDG 394