NBER WORKING PAPER SERIES
LOOKING BEYOND THE INCUMBENT:
THE EFFECTS OF EXPOSING CORRUPTION ON ELECTORAL OUTCOMES Alberto Chong Ana L. De La O Dean Karlan Leonard Wantchekon Working Paper 17679 http://www.nber.org/papers/w17679
NATIONAL BUREAU OF ECONOMIC RESEARCH 1050 Massachusetts Avenue
Cambridge, MA 02138 December 2011
We are grateful to Kyla Levin-Russell, Fernando Martel Garcia, Beniamino Savonitto, Alejandro Ortiz, Anna York and Douglas Randall for excellent research assistance. We also like to thank Katherine Casey, Don Green, Ken Scheve, and Susan Stokes for useful comments, as well as participants of the EGAP-NYU conference, the Political Economy Seminar at the University of Chicago, the CSDS seminar at Columbia University, the experimental lunch seminar at the University of Chicago, the UNC-Duke working group on Latin American politics and Redistribution, Public Goods and Political Market Failures at Yale. We acknowledge partial funding from the Inter-American Development Bank. The views expressed herein are those of the authors and do not necessarily reflect the views of the National Bureau of Economic Research.
NBER working papers are circulated for discussion and comment purposes. They have not been peer-reviewed or been subject to the review by the NBER Board of Directors that accompanies official NBER publications.
© 2011 by Alberto Chong, Ana L. De La O, Dean Karlan, and Leonard Wantchekon. All rights reserved. Short sections of text, not to exceed two paragraphs, may be quoted without explicit permission provided
Looking Beyond the Incumbent: The Effects of Exposing Corruption on Electoral Outcomes Alberto Chong, Ana L. De La O, Dean Karlan, and Leonard Wantchekon
NBER Working Paper No. 17679 December 2011
JEL No. H0
ABSTRACT
Does information about rampant political corruption increase electoral participation and the support for challenger parties? Democratic theory assumes that offering more information to voters will enhance electoral accountability. However, if there is consistent evidence suggesting that voters punish corrupt incumbents, it is unclear whether this translates into increased support for challengers and higher political participation. We provide experimental evidence that information about copious corruption not only decreases incumbent support in local elections in Mexico, but also decreases voter turnout, challengers' votes, and erodes voters' identification with the party of the corrupt incumbent. Our results suggest that while flows of information are necessary, they may be insufficient to improve political accountability, since voters may respond to information by withdrawing from the political process. We conclude with a discussion of the institutional contexts that could allow increased access to information to promote government accountability.
Alberto Chong
Inter-American Development Bank ALBERTOCH@iadb.org Ana L. De La O Yale University 177 Prospect Street New Haven, CT 06520 ana.delao@yale.edu Dean Karlan Department of Economics Yale University P.O. Box 208269 New Haven, CT 06520-8629 and NBER dean.karlan@yale.edu Leonard Wantchekon Princeton University lwantche@princeton.edu
Democratic theory assumes that offering more information to voters will enhance their ability to retain in office incumbents who perform well, and oust from office incumbents who do not (Manin, Przeworski, and Stokes 1999). However, if there is consistent evidence suggesting that voters punish corrupt incumbents (Peter and Welch 1980, Chang and Golden 2004, Ferraz and Finan 2008), it is unclear whether this translates into increased support for challengers and higher political participa-tion.2 In other words, information about corruption may not improve political
ac-countability, if voters respond to it by withdrawing from the political process. We therefore need to further investigate the effect of information beyond the political fate of the corrupt incumbents.
Theoretically, information about corruption could mobilize voters, who would oth-erwise abstain, to vote the corrupt incumbent out of power. Less informed voters may also abstain in order to delegate their vote to more informed voters (Feddersen and Pesendorfer 1996). On the other hand, information about corruption can lead to ab-stentions if voters become disenchanted with their government, and with the political system in general.3 If the exposure of rampant corruption leads voters to believe
that voting will not benefit them (either because they lose trust in governments, or in their ability to respond to their constituents’ needs), then they will not bother to vote since the costs of casting a ballot would be bigger than the benefits (Aldrich 1993). Abstention can also be appealing to voters who disapprove of corrupt incumbents but would prefer to abstain from voting for a party other than their own for ideolog-ical reasons.4 If exposure to information about corruption influences voter turnout, 2Previous work on political corruption has focused mainly on the electoral returns of corrupt incumbents. The empirical record shows that exposure of corruption is associated with incumbent vote loss. However, even when their wrongdoing is exposed and they lose votes, corrupt incumbents often times retain their office (Peters and Welch 1980, Chang and Golden 2004).
3A vast literature has documented that perceptions and experiences of corruption undermine voters’ confidence in public institutions (Della Porta 2000, Clausen, Kraaym and Nyiri 2011, Cho and Kirwin 2007 and Bowler and Karp 2004), erode the legitimacy of the political system, reduce trust in politicians and civil servants (Pharr 2000, Anderson and Tverdova 2003, Selignson 2002, Morris and Klesner 2010, Eek and Rothstein 2006, Richey 2010), and reduce voter’s confidence in their government’s ability to solve problems (Caillier 2010).
then a reduction in support for the corrupt incumbent need not translate into an increase in support for the challenger. Empirically, the scant evidence about the ef-fect of exposing corruption on electoral outcomes other than incumbents’ returns is inconclusive (Peter and Welch 1980, Dominguez and McCan 1998, Davis et al 2004, Kostadinova 2009, Caillier 2010, Bauhr and Grimes 2011, Dominguez and MacCan 1998, and Davis et al 2004).
This article provides unique experimental evidence that information about ram-pant corruption decreases voter turnout, incumbent and challenger support, as well as erodes identification with the corrupt incumbent’s party. To our knowledge, this is the first paper that presents this set of experimental results. Our field experiment consisted of a randomly assigned corruption and public expenditure information cam-paign conducted one week before the 2009 local elections in Mexico. The camcam-paign distributed flyers door-to-door in selected voting precincts with information about the mayor’s responsibility for the provision of public lighting, safe water, sewage, and local roads. In one group of voting precincts, the flyer also included information about the percentage of resources mayors spent in a corrupt manner (i.e. spending where some form of irregularity was identified such as over-invoicing, fake receipts, diverting resources, fraud, etc.). In another group, the flyer included information on the total amount of resources available to mayors to invest in public services and the percentage actually spent by the end of the prior year. In a third group, the flyer included information about the percentage of total resources that mayors spent in poor areas. The control group received no information. The information provided in the flyers was taken from the audit reports produced by the Federal Auditor’s Office in Mexico.
Using electoral data at the precinct level, as well as a post-intervention survey, we
voters’ partisan identification, and that it is incorrect to assume that voters weigh corruption more heavily than other factors. If partisan attachment is strong, voters may discount corruption and vote for the party of the corrupt incumbent anyway (Peters and Welch 1980). Extending this logic, voters with strong partisan attachments may find it too costly to cast a ballot against the party they feel attached to, and thus when confronted with this dilemma they may prefer to abstain.
explore the electoral effects of information about corruption. This empirical strategy allows us to circumvent problems of measurement error, self-reported bias, and reverse causality that have bedeviled previous attempts to uncover the effect of information about corruption on electoral outcomes.
The next section reviews in more detail previous research on political corruption and electoral outcomes, and discusses the methodological challenges to uncovering the effect of information. We then introduce the context of our field experiment, and describe our interventions. The following section presents our results. In this section, we first present the effects of exposing corruption on voter behavior. We then assess whether exposing corruption demobilizes voters that identify with the party of the corrupt incumbent through the estimation of the effect of information about corruption on party identification, with the expectation that if it is partisans who abstain from voting, partisan attachments will remain intact even after learning about corruption. Our results show that the effect of exposing rampant corruption is more consistent with voter disenchantment than with an argument of partisan identification trumping electoral retribution. A final section concludes with a brief discussion of our results, and future research avenues.
1
Information about corruption and voters
behav-ior
Voters need information in order to discern representative from unrepresentative gov-ernments (Manin, Przeworski, and Stokes 1999). In line with this argument, a growing research program has found that improving information availability (via increased me-dia access) promotes government responsiveness (Besley and Burgess 2002), contains opportunistic behavior (Besley, Pande and Rao 2005), prevents widespread theft of public resources (Adser´a et al. 2003, Khemani 2007, Reinikka and Svensson 2005) and improves the performance of representatives in parliaments (Humphreys and We-instein 2007; Snyder and Stromberg 2010, Banerjee et al 2010).
The questions that remain relate to how exposure of information about corrup-tion influences electoral turnout, and challengers’ support. Our understanding of this is limited because much of the previous research assumes that that all voters cast a ballot, and that incumbent losses are challenger’s wins. Empirically, the few studies that focus on the effect of exposure of corruption on turnout find mixed ev-idence. Peter and Welch (1980) find no effect of corruption scandals on turnout in the U.S. Kostadinova (2009) finds that among post-communist countries perceptions of widespread corruption mobilize some voters, but discourage others from voting. Overall, however, she finds that the mobilizing effect is slightly larger than the de-mobilizing effect. Caillier (2010) finds that in the state of Louisiana citizens were less likely to vote when they perceived corruption as increasing. Dom´ınguez and McCann (1998) show that perceptions of (electoral) corruption decrease turnout in Mexico. This pattern seems to hold more generally in Latin America (Davis et al. 2004, and Morris 2004), and across authoritarian countries (Simpser 2004). Bauhr and Grimes (2011) also find that in countries with egregious corruption, increases in governmental transparency demobilize voters.
The evidence on the exposure of corrupt incumbents on challengers’ support is even more scant than the evidence related to voter turnout. The few studies on this find that while perceived corruption is not a significant predictor of voting for an opposition party, nonvoting hurts opposition parties more than the incumbent. Dom´ınguez and MacCann (1998) and Davis et al. (2004) suggest that widespread suspicions about (electoral) corruption in selected Latin American countries affect electoral outcomes by making it less likely that potential opposition supporters turn out to vote.
The study of political corruption, and its consequences for electoral outcomes, presents a variety of challenges. One of the most pressing is how to measure exposure to an illegal activity. Previous work has measured exposure to corruption in at least three ways. One group of studies uses measures of perceptions of corruption based
on survey data. For example, Anderson and Tverdova (2003) use the Transparency International Corruption Index. Hellman and Kaufmann (2004) construct a measure of perceived ’crony bias’ as the difference between firms’ perceptions of their own influence and the influence of other firms they view as having strong political con-nections. Other studies use measures of experiences with corruption. For example, Clausen, Kraaym and Nyiri (2011) and Seligson (2002) use survey items that ask whether the respondent has been asked for a bribe. Finally, a third group of studies use administrative data to measure corruption, for example, the number of arrests related to political corruption (Johnston 1983).
These measures rely on self-reported data (either by government agencies or in-dividuals), which is likely to introduce measurement error if, for example, people (or agencies) are not willing to admit they take or pay bribes (Rothstein 2005), or they inflate their perceptions of corruption in response to their partisanship. Furthermore, measures of perceptions and experiences of corruption capture only indirectly the information available to voters about the misuse of public resources by incumbents, which presumably is one of the most relevant pieces of information that voters need to keep their governments accountable.
An additional challenge to uncovering the effects of exposure of corruption on elec-toral outcomes is the measurement of voter behavior. Most previous work measures these outcomes with survey items that ask respondents about their vote choices in the last election, or ask how they would vote in a hypothetical election. The limitation of these measures is that self-reported voting behavior suffers from social desirability bias.
A final challenge to the study of the electoral consequences of exposure of political corruption is how to establish a causal relation. Simultaneity between corruption exposure and voting is a prevalent concern when using survey data since recall of corruption can be caused by and be itself a cause of reported turnout. Perhaps respondents’ perceptions of, and reported exposure to, corruption drive their electoral
behavior, but the opposite could be just as plausibly: individuals who fail to turn out on Election Day, may justify themselves by expressing the view that corruption is widespread. Furthermore, acquisition of information is endogenous to participation and vote choice. More politically active citizens invest more time getting informed. And an incumbent’s non-partisans may invest more time in finding information about corruption than partisans.
This article diverges from previous work that uses self-reported corruption expe-riences and self-reported electoral behavior. Closer to our work is Ferraz and Finan (2008) who compare the electoral returns of incumbents randomly selected to be au-dited before the election to the returns of incumbents auau-dited after elections in Brazil. This empirical strategy differs from ours in that their exogenous variation in informa-tion is at the municipal level. Our variainforma-tion is at the level of the voting precinct, so we can rule out the possibility that municipal level unobserved factors relate to the audit report and electoral returns. In addition, although their evidence is consistent with an argument about the effects of information on electoral returns, they have no direct evidence that voters were, in fact, informed by the audit reports.
2
Mayors, local expenditures, and federal audits
in Mexico
Despite optimistic views about fiscal decentralization in Mexico, local government’s performance has remained poor. In 2008, for example, more than eighty percent of lo-cal government’s resources were either spent on the bureaucracy or were unaccounted for.5 Although elections should enable voters to discipline their representatives, the 5The bad performance of local governments is by no means a purely Mexican phenomenon. While local governments are supposed to be better informed about local needs and are more likely to maximize productive efficiency due to electoral constraints, it is well documented that around the world local governments are often subject to elite capture, can engender unnecessary expenditure, and may fail to attract the active participation of the poor (Azfar and Livingston 2007, Banerjee et al. 2001, Bardhan and Mookherjee 1999, Dasgupta and Beard 2007, Hoddinott 2002, Johnson, Deshingkar and Start 2005, Mansuri and Rao 2004, Reinikka and Svensson 2004, Besley and Rohini Pande 2008, Duflo and Chattopadhyay 2005, Humphreys and Sandbu 2006, Stokes 2007, Dahlberg
institutional framework in Mexico stacks the deck in favor of political parties. Mu-nicipal authorities are elected to serve 3-year terms, and like all other elected officials, have single-term limits. Thus, the immediate fate of mayors is determined not by vot-ers but by their political party. To reconcile the single-term limit with accountability, scholars have typically assumed that voters punish or reward the incumbent party for mayoral performance. There is, however, little evidence that electoral competi-tion influences municipal government performance (Cleary 2007), and previous work shows a strong entrenchment of incumbents from all political parties (Diaz-Cayeros 2005).
During their term, mayors are in charge of providing basic public services to the municipality, including garbage collection, sewage treatment, electricity, local roads construction and maintenance and public safety. Yet, as in many other countries, voters have insufficient information about service delivery (Keefer 2007). The legacy of six decades of fiscal centralization may have left behind a variety of misconceptions among voters. Among them, two of the most pervasive are that few resources flow to local governments, and that state governors have the discretion to manipulate the amount and timing of the funding that does trickle down. Even if decentralization has changed the amount and allocation criteria of federal transfers, local governments commonly blame a higher level of government for the lack of service delivery. As a result, political responsibility is diluted, making it difficult for voters to hold their mayors accountable for the state of public services in their municipality. Mexico seems to be stuck in what Khemani (2007) describes as a “cycle of low performance and low expectations” in which voters do not expect politicians to be able to improve service delivery.6
et al. 2006, Hines and Thaler 1995, Agrawal and Gupta 2005).
6Our survey shows that a large number of survey respondents are confused about which level of government is responsible for the provision of basic public services. Less than half of respondents identified correctly that mayors are responsible for the sewage systems, the provision of clean water and public lighting. Most respondents think that mayors have insufficient resources to provide basic social services, and, perhaps as expected, perceptions of corruption are very high.
As an institutional response to the misuse of federal resources, a constitutional reform in 1999 established the creation of the Federal Auditor’s Office (ASF). The ASF is an auxiliary entity to the Lower House of Congress but has constitutionally granted management autonomy and is able to issue monetary sanctions and initiate proceedings against public servants responsible for damages to the Treasury or state property. The Lower House of Congress appoints the Auditor for a term of eight years, renewable once. In May 2009, an additional constitutional reform formalized the ASF’s authority to audit the use of federal money in the hands of all public entities, including transfers to local governments. Since municipalities collect few taxes, federally funded programs represent the largest share of municipalities’ income. On a yearly basis, the ASF selects three to six municipalities in each state to be audited according to fixed criteria. In the selected municipalities, the ASF exam-ines public accounts in search of accounting irregularities, deviations from guidelexam-ines outlined by the budget and program objectives, and misuse of resources. The audi-tors inspect public works and physical investment to verify that expenditures are in accordance with the budget, specifications and costs stipulated in contracts.
The audit reports include information about the amount of money the munici-pality received through each federal transfer scheme; its capacity to administer the fund; the kind, quality and number of projects; the money spent by the end of the fiscal year and by the time of the audit; the extent to which the goals and objectives of the fund were met; and any evidence of false accounting and resource diversion that was found. All audit reports are presented simultaneously to the Lower House of Congress and then are made publicly available on the ASF’s website.
Although ASF reports contain reliable information about local government’s per-formance and most of their content is newsworthy, local media do not pick up this information as often as one would expect, and national media typically only covers instances of misappropriation of public resources by federal agencies. By the time local elections occur (approximately three months after the release of the reports for
the elections in this study), the ASF’s massive and detailed reports were no longer on journalists’ radar. Thus, corruption at the local level is not exposed even if the information is available and free.
3
Experimental Design and Implementation
The field experiment took place in twelve municipalities that held elections for munic-ipal governments in 2009. Four municmunic-ipalities belong to the state of Jalisco, three to the state of Morelos and five to the state of Tabasco. In all municipalities, the themes that were most prevalent over the course of the campaigning were related to issues such as the economy, public safety, and the H1NI virus. In addition, campaigns run by the nationally incumbent National Action Party (Partido Acci´on Nacional, PAN) called for political continuity, while those of the opposition Institutional Revolution-ary Party (Partido Revolucionario Institucional, PRI) sought to convey a commit-ment to keeping campaign promises, meeting people’s needs, and recovering the time lost during PAN and Party of the Democratic Revolution (Partido de la Revoluci´on Democr´atica, PRD) administrations. PRI campaign messages were vague. For in-stance, the slogan used throughout the country was “Mexico First, You First”.
Another characteristic of the 2009 local elections was the presence of political movements lead by civil society urging people to go to the polls but annul their ballot in order to send a message that no candidate was an acceptable choice. The other highly visible civil society campaign, particularly in Jalisco, called for Alternancia and urged people to vote for any party different from that of the incumbent’s.
While corruption was part of the campaigns in some instances, accusations of mis-use of public resources were often not supported by evidence from the ASF reports. Rather, accusations often consisted of speculations about incumbent parties covertly lending unauthorized support to their candidate. For instance in Jiutepec municipal-ity, the incumbent PRD was accused of illegally funding and distributing campaign propaganda with the PRD logotype. Tlajomulco municipality, in Jalisco, was the
only municipality where the challenger’s campaign specifically focused on corruption with the slogan Limpiar Tlajomulco (Clean Up Tlajomulco).
The 2009 municipal elections marked the return of the PRI to mayoral offices in Jalisco, Tabasco, and Morelos. Among precincts in our control group, participation rates in these elections reached its lowest point, dropping from fifty-eight percent in 1997 to fifty-one percent. PAN’s vote share, which consistently exceeded thirty percent since 1997, dropped to twenty-three percent in 2009. Conversely, PRI’s vote share, which had fluctuated between thirty-six and forty percent, in 2009 reached forty-five percent. The PRD remained the weakest political force, gaining fourteen percent of the vote in 2009. These trends are consistent with pre-election polls which gave the PRI (in opposition in all but one of the municipalities in this study) a firm lead. The only municipalities where the incumbent party had a firm lead where the PRI-controlled Centro in Tabasco and PRD-controlled Jiutepec in Morelos. Ulti-mately, the results of the elections followed the pre-election polls predictions: party turnover took place in all municipalities in the study, except in Centro and Juitepec. In the selection of our experimental sites, we took into account a couple of factors. First, we worked in municipalities where given the pre-election polls we had reason to believe that while our interventions could have an effect at the polling precinct level, there was little chance that our study would revert the pre-election tendencies at the municipality level. Second, we chose these municipalities to generate regional diversity, and thus to expand the generalizability of our results.
3.1
Interventions
The field experiment was motivated by the notion that voters, especially poor voters, have little information about resources that are assigned to their municipalities for service provision and public works. To test the effect of information on electoral behavior, we collected data on mayors’ use of the Fund for Social Infrastructure (FISM) from the audit reports corresponding to the 2007 auditing process, which
was the most recent year available and corresponded to the term of the municipal government in office up to the 2009 elections. Our survey reveals that very few respondents are familiar with this transfer scheme.7
In collaboration with Innovations for Poverty Action, a nonprofit organization, we coordinated the distribution of the flyers through two local firms with expertise in such flyer distribution campaigns.8 All flyers prompted people to think about the level
of governments that was in charge of the provision of public infrastructure services. For one intervention group, the flyer included information about the percent of the transfer scheme that was found to have irregularities in the accounting process, such as fake or missing receipts, over-invoicing, incomplete public works and diversion of resources. The percentage of the transfer spent in a corrupt manner is included in the reports, so we did not impose any judgement in the measurement of corruption.
To distinguish the effect of information about corruption from the effect of leaflet-ing, we had two additional treatment groups. In one, the flyer had information about the total amount of money granted to the municipality through the transfer scheme, and the amount of funding spent by the end of the fiscal year. In another group, the flyer included information about the percent of the transfer directed to improving services for the poor. All flyers included a subtle advocacy message suggesting that voters raise questions with their mayors about the use of the transfer.
To maximize the possibility that voters read, believed and retained the informa-tion, and actually used it when deciding whether to vote and for which party to cast a ballot, we designed the flyer in consultation with a locally-based graphic designer. To establish credibility and political independence, flyers included a reference to the source of the information and a legend explaining that the informational campaign was non-partisan. The flyer designs also incorporated feedback gathered from two
7In Jalisco, only ten percent of respondents had heard of it. In Morelos and Tabasco, only thirteen percent of respondents had heard of it.
8Flyer distribution is a mass communication strategy widely used in Mexico by the public and private sectors due to its cost-effectiveness.
focus groups. An example of the flyers is included in the appendix.
The distribution of the flyers took place approximately one week before local elections.9 Flyers were distributed to all households within the boundaries of a vot-ing precinct. In order to ensure that the flyers were bevot-ing distributed accordvot-ing to protocol, we closely supervised their distribution.10
Regarding the randomization process, each state was allocated 50 precincts per treatment and randomization was blocked by municipality.11 To our knowledge, there
is no prior study about the effect of information delivered through flyers in Mexico. Outside of Mexico, non-partisan leafleting experiments typically produce effects that are overall statistically indistinguishable from zero (Gerber and Green 2000, Azari and Washington 2006). Partisan leaflets tend to produce small effects. For example, Nickerson, Freidrichs and King (2006) find that partisan door hangers increase turnout by 1.2 percentage points. We calculated our sample size taking into account our budgetary restrictions, as well as the fact that we could increase the size of the control group at no expense, as the states’ electoral institutes report precinct-level voter outcomes. More specifically, we set our sample in order to have sufficient power to detect a minimum effect of 2.5 percentage points.12
9The municipal elections in Jalisco and Morelos were held on Sunday July 5, 2009. Flyer distribu-tion in Jalisco took place from Friday, June 26th through Tuesday, June 30th. Flyer distribudistribu-tion in Morelos took place from Saturday, June 27th through Tuesday, June 30th. The municipal elections in Tabasco were held on Sunday, October 18th. Flyer distribution took place from Friday, October 9th through the 14th.
10Teams of 4 or 5 distributors were assigned to a supervisor who monitored their activity and did no distribution herself. The supervisor’s role was to ensure that the correct flyer was being distributed in a given precinct, that the boundaries of the precincts were respected, and that flyers were properly placed in the households. In Morelos and Tabasco, a GPS monitoring system was in place to ensure that flyer distributors were within precinct limits. In addition, one of the researchers and staff from Innovations for Poverty Action supervised the distribution process in all states. Although at the start there were instances where protocol was not being followed correctly, steps were taken to correct errors.
11STATA was used to generate a random number for each precinct by municipality. Precincts were ranked by the random number. The first N precincts were chosen to be part of treatment 1, the next N precincts were chosen to be in treatment 2, and the next N precincts were part of treatment 3. The rest of the precincts were part of the control group. N was set in proportion to each municipality’s number of registered voters.
12Since the unit of analysis was the voting precinct, allocation concealment to participants was not an issue. Randomization was implemented by the principal investigators. Principal investigators
In total, 150 electoral precincts were randomly assigned to each of the three in-terventions, for a total of 450 treated precincts and 1910 precincts in the control group. Minor problems in the field kept a small fraction of precincts from receiving full.13 Because voting precincts randomly assigned to different treatments have
com-parable potential outcomes, throughout the paper we present analysis based on the assignment to treatment (intent-to-treat estimates).
We collected three types of data for this article. Electoral results at the precinct level come from the electoral institutes from the different states. We also got from these institutes maps, and geo-referenced electoral precincts, which we used to deter-mine the distribution of the flyers. Demographic baseline characteristics come from census data. However, this information is not reported at the precinct level. We computed baseline demographics for precincts by first matching precincts to their villages (or blocks in urban areas) using GIS. Then, we aggregated the demographic characteristics by calculating the averages from the villages (or blocks) inside the precinct. Finally, we conducted a survey approximately two weeks after the interven-tions (ten days after the elecinterven-tions). Since the survey intended to measure the effects of disseminating the information before election time, respondents were not exposed to the information again at the time of the survey.14
were not blinded to group assignment. For logistical reasons, the two firms distributing the flyer were informed about the group assignment one week before the intervention.
13We distributed a total of 44, 000 flyers per treatment. Minor adverse events included one attempt of assault of a flyer distributor, obstacles such as gated neighborhoods, high population density and hard-to-reach areas in a highly rural area where there is lack of infrastructure connecting remote clusters of homes to main roads and village centers. In Jalisco, ninety-seven percent of precincts received full treatment, two percent received partial treatment and only one percent received no treatment (or an unknown level of treatment). In Morelos eighty-nine percent of precincts received full treatment, one percent received partial treatment, and ten percent were not treated. In Tabasco, we faced many more challenges in terms of field logistics. Approximately sixty percent of precincts were fully treated, twenty percent were partially treated, and twenty percent failed to receive any treatment.
14The sample for the survey was selected in three steps. First, we randomly selected fifteen precincts in each of the treatment groups and thirty precincts in the control group to participate in the survey. For logistical reasons, this randomization was stratified by state. Second, within each selected precinct two blocks were randomly selected. Finally, within each block five households were surveyed. The total sample for the survey consisted of 750 voters in 75 precincts.
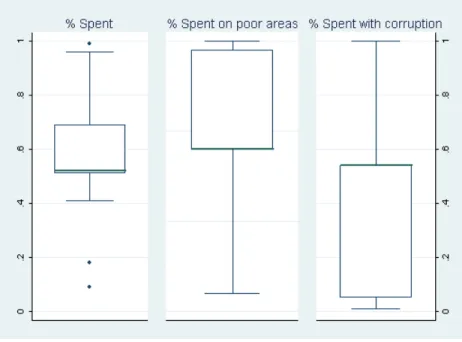
With respect to the information revealed by the audit reports and included in the flyers, we were surprised to learn that mayors do not spend all the money they receive from the federal transfer. Among the experimental municipalities, mayors spend on average 56 percent of the FISM transfer (with a standard deviation of 23). By regulation, mayors are supposed to use the FISM transfer to improve service delivery in poor areas of their municipality. The audit reports show that among the municipalities in this experiment 83 percent of FISM was indeed allocated to poor areas (with a standard deviation of 15). Finally, with respect to corruption, the audits show that on average mayors spent 35 percent of FISM in corrupt manners (with a standard deviation of 25). This information is summarized in Figure 1.
—FIGURE 1 HERE —
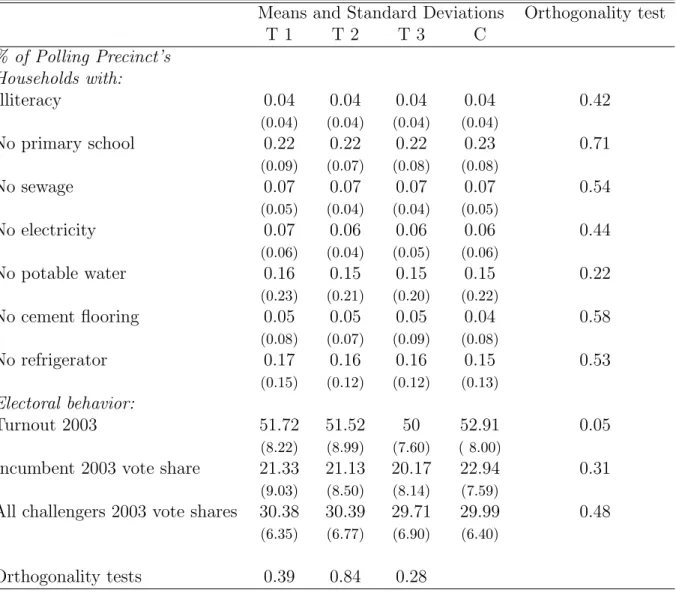
Table 1 describes the baseline characteristics of the 2,360 polling precincts in the experiment. Columns 1-3 show the means (and standard deviations) of those char-acteristics for each of the three treatment groups, while column 4 displays the values for the control group. Column 5 and last row of Table 1 show the orthogonality of various demographic and electoral variables to the randomized treatment assign-ment. Randomization successfully created balance in baseline characteristics across treatment and control groups. The last row of Table 1 presents the p-values of three F-tests from separate regressions where the dependent variables are dummies indicat-ing whether the precinct belong to each of the treatment groups. The independent variables are baseline characteristics and municipality fixed effects. Based on this orthogonality test, baseline characteristics do not explain assignment to treatment. The last column in Table 1 shows an alternative orthogonality test. Here we present the p-values of F-tests of the joint significance of the three treatment dummies on each of the baseline characteristics. This test corroborates that there are no signif-icant differences across treatment and control groups in demographics or electoral behavior. The only exception is baseline turnout (which is slightly higher among the
control group). Thus, in the analysis that follows we present the results with controls for baseline characteristics. However, all results are robust to the exclusion of baseline characteristic as shown by the results presented in the appendix.
Table A1 in the appendix describes the demographic characteristics of the 750 survey respondents. The randomization of the interventions took place at the precinct level; thus, in order to determine that respondents of the survey in the different experimental groups are comparable to each other, we present the means and standard deviations by treatment status, and we report additional orthogonality tests.15
4
The effects of information on electoral behavior
We begin the presentation of our results with a comparison between the mean out-comes in the treatment group which received information about corruption and the mean outcomes in the control group. Previous work has consistently find that the ef-fect of exposing corruption on incumbents depends on the severity of the malfeasance. For example, Chang and Golden (2004) find that minor crimes had different effect compared to major crimes on legislators reelection rates. Ferraz and Finan (2008) find that the effect of the audit is increasing in the number of violations in the audit report. To take this into account, we split our sample into quartiles of corruption ex-posed. Then, we compute the mean turnout, mean incumbent and mean challengers’ vote shares by treatment and control for each quartile.
We compute turnout as the total number of votes cast in the polling precinct
15The last row of Table A1 presents the p-values of three F-tests from separate regressions where the dependent variables are dummies indicating whether the precinct belong to each of the treatment groups. The independent variables are all baseline characteristics and municipality fixed effects. Based on this orthogonality test, the baseline characteristics do not explain assignment to treatment. The last column shows an alternative orthogonality test. Here we present the p-values of F-tests of the joint significance of the three treatment dummies on each of the baseline characteristics. This test confirms that for 13 out of 19 demographic variables there are no significant differences across experimental groups. For the remaining six demographic variables, including age, education, and occupation, Table A1 shows an imbalance significant at the 10 percent level. To correct for these imbalances in the analysis in the main text we present the results with controls. However, all results are robust to the exclusion of demographic variables as shown by the results presented in the appendix.
divided by the number of people registered to vote. Similarly, we define incumbent vote share as the votes cast for the incumbent party divided by the number of people registered to vote, and the challengers vote share as the number of votes cast for any challenger party divided by the number of people registered to vote. The three dependent variables are multiplied by 100. We compute all outcomes with respect to number of people registered to vote because voter registration happened before the experiment, and was in no way affected by it. Therefore, the computation of the three outcomes with the same denominator allows us to focus on experimentally-induced changes in the numerators.
Figure 2 presents the differences in means. The most-left graph shows that the differences in mean turnout are negative for all corruption quartiles, except the third where the difference in means is close to zero. The second graph shows that the differences in mean incumbent vote shares are negative for all corruption quartiles, except again in the third quartile. Finally, the most-right graph shows that for the second and fourth quartiles of corruption the differences in means in challengers’ votes are also negative. The differences are close to zero in the first quartile, and, like for turnout and incumbent vote share, in the third. Overall, figure 2 shows that exposing corruption, if anything, decreases turnout. It also shows that the information decreases both incumbent and challengers’ support, especially when corruption is rampant. We discuss the statistical significance of the effects, and their magnitude in the next section.
—FIGURE 2 HERE —
4.1
Econometric Specification
Before imposing any functional form on the data, we estimate three separate regres-sions following the specification:
where y is the outcome variable; T1 refers to the group that received informa-tion about the overall percent of FISM spent, T2 refers to the group that received information about the percent of FISM allocated to the poor, and T3 refers to the group that received information about the percent of FISM spent in a corrupt man-ner. Mj are municipality fixed effects that take into account that randomization was block by municipality. This specification estimates the overall effect of disseminating information regardless of how copious corruption was in the municipality.
Table 2 reports the coefficients and robust standard errors (clustered by munic-ipality) from the specifications. In column 1, the dependent variable is turnout; in column 2, the outcome is incumbent vote share; and in column 3, the dependent variable is challengers vote share. Rows 1 and 2 show that disseminating information about overall expenditure and allocations to poor areas had no statistically signifi-cant effect on electoral outcomes. However, Row 3 shows that the treatment group that received information about corruption turn out at a lower rate than the control group. The decrease of 1.10 percentage points is statistically significant at the one percent level. Given that turnout in the control group was 51%, the overall decrease in turnout was two percent. The effect of information about corruption on the in-cumbent vote share was negative and statistically insignificant, but the effect on the challengers’ vote share was negative and statistically significant at the five percent level. These results reveal that information about corruption has a unique effect on electoral outcomes. Whereas information about overall spending and distributive al-locations has no discernable effect, information about corruption depresses turnout, and the challengers’ support.
Next, we specify three regressions that allow for the effect of treatments on elec-toral outcomes to vary depending on the information included in the flyer. To do this, we included an interaction between the treatment dummy that indicates that the precincts received information about corruption (T3), and a dummy variable that indicates that mayors spent more than 75% of FISM with corruption. For
complete-ness, we also included an interaction between T1 and a dummy variable indicating that mayors spent more than 75% of FISM, and an interaction between T2 and a dummy variable indicating that mayors allocated more than 75% of FISM to poor areas. All specifications include municipality fixed effects, because randomization was blocked by municipality. The inclusion of municipality fixed effects means that we need to exclude from our specifications the main effect of the dummy variables capturing the information from the flyers because it is given at the municipality level. Finally, we also included in the specifications baseline characteristics to account for the minor imbalance in baseline turnout, and to increase the precision of our esti-mates.16 Table 3 reports the coefficient estimates and robust standard errors clustered by municipality from these specifications.
Rows 1 and 2 in Table 3 display the experimental results for the treatment group which received information about the percentage of FISM spent. The effect of re-leasing information about mayors’ overall spending has a small negative effect that is statistically indistinguishable from zero when the mayor spent less than 75% of FISM. By contrast, when mayors spent more than 75% of FISM, releasing this information leads to an increase in turnout of 1.9 percentage points, statistically significant at the one percent level. The share of votes for the incumbent moves in the same direction as turnout. When mayors spent less than 75% of FISM, incumbent vote share de-crease by .6 percentage points (significant at the five percent level), and when more than 75% is spent incumbent vote share increases by .9 percentage points, although this results is not statistically significant. Finally, releasing information about overall expenditures does not seem affect challengers’ share of votes.
Rows 3 and 4 of Table 3 present estimates of the effect of releasing information about the share of FISM allocated to poor areas. The estimates in Column 1 show that voters who received this treatment turned out at rates higher than those of the control
16Baseline characteristics include: poverty index, turnout in 2003 and vote shares of the incumbent party and challenger parties computed with respect to the number of people registered to vote.
group when mayors spent less than 75% of FISM on poor areas. Turnout increases by 2.4 percentage points (significant at the one percent level). Given that turnout in the control group was 51%, then this effects translates into a 5 percent increase in turnout. Surprisingly, votes for the incumbent and challengers’ parties move in the same direction as turnout. When mayors spend less than 75% of FISM on poor areas, both incumbent and challengers’ vote shares increase by 1.5 and 1 percentage points respectively in an statistically significant way. When mayors allocate more than 75% of resources on poor areas, all effects cancel out when adding the main effect and the interaction term.
Rows 5 and 6 of Table 3 present estimates of the effect of information about the percent of the transfer scheme spent in corrupt manners. Row 5 shows that among precincts where corruption levels were lower than 75%, the exposure of corruption has a negative effect on turnout and incumbent’s vote share, although these results are not statistically significant. However, row 6 shows that among precincts where mayors spent more than 75% of FISM with corruption, the release of information lead to a 4 percentage point decrease in turnout, or an 8 percent decrease off a base of 51%. Row 6 also shows that the exposure of excessive corruption not only has a demobilizing effect, but it decreases the vote share of both the incumbent and challenger parties by approximately 2 percentage points each. These results are statistically significant at the one percent level. Together, rows 5 and 6 suggest that exposure of rampant corruption is demobilizing and affects the incumbent and challengers’ parties negatively.
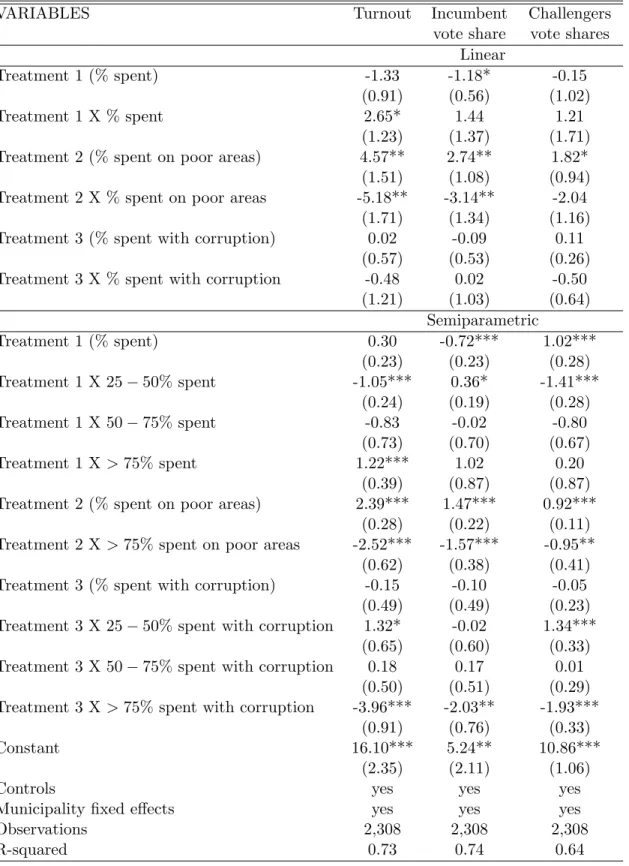
In the appendix, we report two alternative functional forms that we estimated. In one we include an interaction between the treatment dummy and the corrup-tion exposed in the audit reports linearly. This interaccorrup-tion has a negative effect on turnout, and the challengers’ vote share, but the effect is not statistically significant. In another specification, we include the interaction between the treatment dummy and the corruption information entered in quartiles. This specification also shows
that when rampant corruption is exposed, turnout, incumbent and challengers’ vote shares decrease in a statistically significant way.
Why did information about rampant corruption depressed turnout, and chal-lengers’ votes? As explained in more detail before, one possibility is that voters disengage from politics when they learn about corruption. Another possibility is that voters who identify with the party of the corrupt incumbent prefer to abstain than to vote for a party other than their own. The results so far show that abstentions from partisans of the incumbent party cannot explain by themselves the effects because challengers’ votes also decrease when corruption is exposed. To further test whether partisanship prevents voters from punishing the corrupt incumbent, we estimate the effect of exposing rampant corruption on party identification. If partisanship is a central part of the mechanism leading voters not to turn out, then the information should not have an effect on partisan identification. We measure party identification with our post-intervention survey. Table 4 present these results.
Row 6 shows that voters who learn about rampant corruption are 40 percent less likely to identify with the party of the corrupt incumbent compared to voters in the control group (significant at the one percent level). Information about excessive corruption has no effect on the probability that respondents on the treatment group identify with a challenger party, but it increases the probability that respondents on the treatment group do not identify with a party by 30 percent (significant at the one percent level). We conclude from these results that the effect of exposing rampant corruption is primordially working through an effect of voter’s disengagement, rather than the party identification argument.
5
Conclusion
The main contribution of this article it to provide experimental evidence that infor-mation about political corruption influences voters’ electoral decisions beyond their evaluations of the incumbent. We show that exposing rampant corruption leads to
incumbents’ vote loses, but it also leads to a decrease in electoral turnout, and a decrease in challengers’ votes. Furthermore, exposure of corruption weakens partisan identification with the corrupt incumbent’s party, and increases share of voters who do not identify with a political party. Thus, under some circumstances, information about corruption disengages voters from the political process.
Our results speak directly to one of the most pervasive themes in democratic theory. Voters need to know what their governments do in order to use elections as instruments of control. Yet, voters also need a more comprehensive institutional set up that allows them to use the information in ways that promote accountability. John Dunn succinctly explains: “To promote representation, democracy requires a regime of free information”(in Przeworski, Stokes, and Manin 1999 25). Such regime involves the flow of information, and it also involves the construction of effective in-stitutions (i.e. independent courts, and independent accounting offices) that reinforce the legitimacy and effectiveness of the political system.
The interaction of information flows with different institutional set ups is a topic where further research is definitely needed. We conducted this study in a political system with single-term limits for mayors and voluntary voting. These are important underlying institutional facts that may influence the outcome of the study, but are not uncommon around the world. Term limits are prevalent in presidential systems and incumbents in their last term are likely to face the same incentives as one-term incumbents (Johnson and Crain 2004). Furthermore, voluntary voting is a prevalent institution, as even in countries where voting is mandatory, several groups of voters are exempted (for example, the elderly and the poor), and punishment is often not enforced. In such setting, flows of information about corruption are necessary but not sufficient to the improve governance and responsiveness because voters may respond to information by withdrawing from the political process rather than engaging to demand accountability. Clearly, however, much work on how information can enhance democratic participation and make democracy work for ordinary people remains.
References
[1] Adsera, Alicia, Carles Boix and Mark Payne. 2000. “Are You Being Served?: Po-litical Accountability and Quality of Government”. Research Department Work-ing papers series 438. Inter-American Development Bank.
[2] Aldrich, John H. 1993. “Rational Choice and Turnout.” American Journal of Political Science 37 (1) (February 1): 246-278.
[3] Anderson, Christopher J., and Yuliya V. Tverdova. 2003. “Corruption, Political Allegiances, and Attitudes toward Government in Contemporary Democracies.” American Journal of Political Science 47 (1) (January 1): 91-109.
[4] Azari, Julia and Ebonya Washington. 2006. “Results from a 2004 Leafleting Field Experiment in Miami-Dade and Duval Counties, Florida”. Unpublished Manuscript. Institution for Social and Policy Studies, Yale University.
[5] Banerjee, Abhijit, Banerji, Rukmini, Duflo, Esther, Glennerster, Rachel, Khe-mani, Stuti. 2008. “Pitfalls of Participatory Programs: Evidence from a Ran-domized Evaluation in Education in India”. CEPR Discussion Papers 6781. [6] Banerjee, Abhijit, Selvan Kumar, Rohini Pande and Feliz Su. 2010. “Do Informed
Voters Make Better Choices? Experimental Evidence from Urban India”. Un-published manuscript. http://www.povertyactionlab.org/node/2764
[7] Bowler, Shaun, and Jeffrey A. Karp. 2004. “Politicians, Scandals, and Trust in Government.” Political Behavior 26 (3): 271-287.
[8] Bauhr, Monika and Marcia Grimes. 2011. “Seeing the State: The Implications of Transparency for Societal Accountability”. Paper presented at the Midwest Political Science Association Conference.
[9] Besley, Timothy and Robin Burgess. 2002. “The Political Economy of Govern-ment Responsiveness: Theory and Evidence from India”. The Quarterly Journal of Economics, November, 117(4), 1415-1452.
[10] Besley, Timothy, Rohini Pande and Vijayendra. 2005. “Political Selection and the Quality of Government: Evidence from South India”. Economic Growth Center Discussion Paper Series no. 921.
[11] Bjorkman, M. and J. Svensson. 2006. “Power to the People: Evidence from a Randomized Experiment of a Community Based Monitoring Project in Uganda”. Mimeo. IIES: Stockholm University.
[12] Caillier, J. 2010. “Citizen Trust, Political Corruption, and Voting Behavior: Con-necting the Dots.” Politics and Policy 38 (5): 1015-1035.
[13] Chang, Eric C.C. and Miriam A. Golden. 2004. “Does Corruption Pary? The survivial of politicians charged with malfeasance in the postwar Italian cham-ber of deputies” Unpublished manuscript. Presented at a meeting on political accountability, Waseda University, October 29-30.
[14] Cho, W. and Kirwin, M. F., 2007, ’A Vicious Circle of Corruption and Mistrust in Institutions in sub-Saharan Africa: A Micro-Level Analysis’, Working Paper, no. 71, Afrobarometer, Cape Town.
[15] Choi, E., and J. Woo. 2010. “Political corruption, economic performance, and electoral outcomes: A cross-national analysis.” Contemporary Politics 16 (3): 249-262.
[16] Clausen, Bianca, Aart Kraay, and Zsolt Nyiri. 2009. “Corruption and Confi-dence in Public Institutions: EviConfi-dence from a Global Survey.” SSRN eLibrary (December 1).
[17] Cleary, Matthew R. 2007. “Electoral Competition, Participation, and Govern-ment Responsiveness in Mexico”. American Journal of Political Science 51 (2): 283-299.
[18] Davis, C.L., R.A. Camp, and K.M. Coleman. 2004. The influence of party sys-tems on citizens perceptions of corruption and electoral response in Latin Amer-ica. Comparative Political Studies 37 (6): 677-703.
[19] della Porta, Donatella. 2000. “Social Capital, Beliefs in Government, and Polit-ical Corruption.” In Disaffected Democracies: What’s Troubling the Trilateral Countries?, eds. Susan Pharr and Robert Putnam. Princeton: Princeton Univer-sity Press.
[20] Diaz-Cayeros, Alberto. 2005. “Accountability and Municipal Reelection in Mex-ico”. Unpublished manuscript. Stanford University.
[21] Eek Daniel and Bo Rothstein. 2006. “Political Corruption and Social Trust: An Experimental Approach” The Quality of Government Working Paper Series. [22] Feddersen and Pesendirfer. 1999. “Abstention in Elections with
Asymmet-ric Information and Diverse Preferences”. American Political Science Review 93(2):381-98.
[23] Ferraz and Finan. 2008. “Exposing Corrupt Politicians: The Effects of Brazil’s Publicly Released Audits on Electoral Outcomes”, The Quarterly Journal of Economics 123(2): 703-745.
[24] Gerber, Alan S. and Donal P. Green. 2000. “The Effect of a Nonpartisan Get-Out-the-Vote Drive: An Experimental Study of Leafletting” Journal of Politics. Vol. 62, No. 3 (Aug., 2000), pp. 846-857.
[25] Gingerich, D.W. 2009. “Corruption and political decay: Evidence from Bolivia.” Quarterly Journal of Political Science 4 (1): 1-34.
[26] Hiskey, J.T., and S. Bowler. 2005. “Local context and democratization in mex-ico.” American Journal of Political Science49 (1): 57-71.
[27] Humphreys, Macartan and Jeremy Weinstein. 2010. “Policing Politicians: Citi-zen Empowerment and Political Accountability in Uganda”. Paper presented at the annual meeting of the American Political Science Association, Chicago, 2007. [28] Johnson, Joseph M. and Mark Crain. 2004. “Effects of Term Limits on Fiscal
Performance: Evidence From Democratic Nations”.Public Choice119: 73-90. [29] Keefer, Philip. 2007. “Seeing and Believing: Political Obstacles to Better Service
Delivery”. In Devarajan, Shantayanan and Ingrid Widlund (eds),The Politics of Service Delivery in Democracies. Better Access for the Poor, EGDI Secretariat Edita, Stockholm.
[30] Khemani, Stuti. 2007. “Can Information Campaigns Overcome Political Obsta-cles to Serving the Poor?” In Devarajan, Shantayanan and Ingrid Widlund (eds), The Politics of Service Delivery in Democracies. Better Access for the Poor. EGDI Secretariat Edita, Stockholm.
[31] Klesner, J.L. 2009. “Who participates? Determinants of political action in Mex-ico.” Latin American Politics and Society 51 (2): 59-90.
[32] Krishna, Anirudh. 2006. “Poverty and Democratic Participation Reconsidered: Evidence from the Local Level In India”. Comparative Politics 38 (4): 439-458. [33] Kostadinova, Tatiana. 2009. “Abstain or Rebel: Corruption Perceptions and Voting in East European Elections.” Politics & Policy 37 (4) (August 1): 691-714.
[34] McCann, James A, and Jorge I Dom´ınguez. 1998. “Mexicans react to electoral fraud and political corruption: an assessment of public opinion and voting be-havior.” Electoral Studies 17 (4) (December): 483-503.
[35] Morris, S.D., and J.L. Klesner. 2010. “Corruption and trust: Theoretical con-siderations and evidence from Mexico.” Comparative Political Studies 43 (10): 1258-1285.
[36] Nickerson, David W., Ryan D. Friedrichs and David C. King. 2006. “Partisan Mobilization Campaigns in the Field: Results from a Statewide Turnout Exper-iment in Michigan.” Political Research Quarterly, Vol. 59 (1): pp. 85-97
[37] Pharr, Susan. 2000. “Corruption and Public Trust: Perspectives on Japan and East Asia”, East-West Center Working Papers.
[38] Peters, John G and Susan Welch. 1980. “The Effects of Charges of Corruption on Voting Behavior in Congressional Elections”. American Political Science Review 74(3): 697-708.
[39] Powers, Timothy J. and J. Timmons Roberts. 1995. “Compulsory Voting, Invalid Ballots, and Abstention in Brazil”. Political Research Quarterly 48(4): 795-826. [40] Power, T.J., and G.D. Jamison. 2005. Political mistrust in Latin America.
Com-parative Sociology 4 (1-2): 55-80.
[41] Reinikka, Ritva and Jakob Svensson. 2005. “Fighting Corruption to Improve Schooling: Evidence from a Newspaper Campaign in Uganda”. Journal of the European Economic Association 3(2/3)
[42] Richey, S. 2010. “The impact of corruption on social trust.” American Politics Research 38 (4): 676-690.
[43] Rothstein, B. 2009. “Creating political legitimacy: Electoral democracy versus quality of government.” American Behavioral Scientist 53 (3): 311-330.
[44] Schedler, A. 1999. “Civil society and political elections: A culture of distrust?” Annals of the American Academy of Political and Social Science 565 (565): 126-141.
[45] Simpser, Alberto. 2004. “Making Votes Not Count: Expectations and Electoral Corruption”, presented at the American Political Science Association Meeting, Chicago, IL.
[46] Seligson, Mitchell A. 2002. “The Impact of Corruption on Regime Legitimacy: A Comparative Study of Four Latin American Countries.” The Journal of Poli-tics64 (02): 408-433.
[47] Snyder, James M. Jr and David Stromberg. 2010. “Press Coverage and Political Accountability”. The Journal of Political Economy 118(2): 355-408.
[48] World Bank. 2003. “Making Services Work for Poor People”. World Development Report: Washington, D. C.
Figure 1: Information from audit reports
Notes: This figure shows the information collected from the audit reports. The first box shows the distribution of the share of the transfer scheme that was spent. In average, mayors spent 56 percent of the resources available to them (with a standard deviation of 23, and a median of 52). The second box show the distribution of the share of the transfer scheme spent on poor areas. In average, 83 percent of the transfer was allocated to poor areas (with a standard deviation of 15, and a median of 76). Finally, the third box shows the distribution of the share of the transfer scheme spent with corruption. In average, 35 percent of resources where spent with some form of irregularity (with a standard deviation of 25, and a median of 54).
Figure 2: Differences in means: Treatment 3 (% corrupt) - Control
Notes: This figure presents a comparison of means in the treatment group where information about corruption was disseminated and the control group. The differences in means are presented for different levels of corruption revealed in the audit reports, starting with the least corruption on the top, and finishing with the most corruption on the bottom.
Table 1: Baseline Public Data Summary Statistics and Orthogonality Tests
Means and Standard Deviations Orthogonality test
T 1 T 2 T 3 C % of Polling Precinct’s Households with: Illiteracy 0.04 0.04 0.04 0.04 0.42 (0.04) (0.04) (0.04) (0.04) No primary school 0.22 0.22 0.22 0.23 0.71 (0.09) (0.07) (0.08) (0.08) No sewage 0.07 0.07 0.07 0.07 0.54 (0.05) (0.04) (0.04) (0.05) No electricity 0.07 0.06 0.06 0.06 0.44 (0.06) (0.04) (0.05) (0.06) No potable water 0.16 0.15 0.15 0.15 0.22 (0.23) (0.21) (0.20) (0.22) No cement flooring 0.05 0.05 0.05 0.04 0.58 (0.08) (0.07) (0.09) (0.08) No refrigerator 0.17 0.16 0.16 0.15 0.53 (0.15) (0.12) (0.12) (0.13) Electoral behavior: Turnout 2003 51.72 51.52 50 52.91 0.05 (8.22) (8.99) (7.60) ( 8.00)
Incumbent 2003 vote share 21.33 21.13 20.17 22.94 0.31
(9.03) (8.50) (8.14) (7.59)
All challengers 2003 vote shares 30.38 30.39 29.71 29.99 0.48
(6.35) (6.77) (6.90) (6.40)
Orthogonality tests 0.39 0.84 0.28
Notes: This table reports baseline summary statistics from public data. Column (4) presents the means (and standard deviations in parentheses) for the control group, while columns (1)to (3) report the same summary statistics by the three experimental groups: T1 refers to information about the percent of FISM spent, T2 to information about the percent of FISM allocated to the poor, and T3 to information about the percent of FISM spent with corruption. The last column present the p-values of a F-test from a regression of each baseline
characteristic on T1, T2 and T3, with fixed effects for municipality. The last row shows the p-values of a F-test from regressions of each treatment on all baseline covariates and municipality fixed effects.
Table 2: Estimates of the effects of three types of information on electoral outcomes
(1) (2) (3)
VARIABLES Turnout Incumbent Challengers
vote share vote shares
Treatment 1 (% spent) 0.46 -0.12 0.58
(0.50) (0.33) (0.46)
Treatment 2 (% spent on poor areas) 0.21 0.13 0.08
(0.60) (0.40) (0.35)
Treatment 3 (% spent with corruption) -1.10*** -0.47 -0.63**
(0.30) (0.34) (0.23) Constant 51.79*** 17.83*** 33.96*** (0.05) (0.05) (0.03) Observations 2,340 2,340 2,340 R-squared 0.44 0.53 0.44 *** p<0.01, ** p<0.05, * p<0.1
Notes: This table reports three separate regressions. The dependent variables are: in column (1) the total number of votes divided by the number of people registered to vote (times 100), in column (2) the votes for the incumbent party divided by the number of people registered to vote (times 100), and in column (3) the votes for any challenger divided by the number of people registered to vote (times 100). The independent variables are three dummy variables indicating which experimental group the polling precinct belongs to. T1 refers to the group that received information about the percent of FISM spent, T2 to the group that received information about the percent of FISM allocated to the poor, and T3 to the group that received information about the percent of FISM spent with corruption. All specifications include fixed effects for municipality. Robust standard errors, clustered by municipality, in parentheses. *** p<0.01, ** p<0.05, * p<0.1
Table 3: Estimates of the effects of three types of information on electoral outcomes
(1) (2) (3)
VARIABLES Turnout Incumbent Challengers
vote share vote shares
Treatment 1 (% spent) -0.38 -0.64** 0.24
(0.35) (0.28) (0.45)
Treatment 1 X >75% spent 1.89*** 0.93 0.96
(0.49) (0.90) (0.94)
Treatment 2 (% spent on poor areas) 2.40*** 1.47*** 0.93***
(0.26) (0.22) (0.09)
Treatment 2 X >75% spent on poor areas -2.52*** -1.58*** -0.97**
(0.59) (0.39) (0.39)
Treatment 3 (% spent with corruption) -0.01 -0.05 0.02
(0.32) (0.30) (0.16)
Treatment 3 X >75% spent with corruption -4.11*** -2.05*** -1.98***
(0.66) (0.62) (0.24)
Constant 15.82*** 5.12** 10.44***
(1.28) (1.89) (1.15)
Controls yes yes yes
Municipality fixed effects yes yes yes
Observations 2,308 2,308 2,308
R-squared 0.74 0.74 0.64
Notes: This table reports three separate regressions. The dependent variables are: in column (1) the total number of votes divided by the number of people registered to vote (times 100), in column (2) the votes for the incumbent party divided by the number of people registered to vote (times 100), and in column (3) the votes for any challenger divided by the number of people registered to vote (times 100). The independent variables are three dummy variables indicating which experimental group the polling precinct belongs to. T1 refers to the group that received information about the percent of FISM spent, T2 to the group that received information about the percent of FISM allocated to the poor, and T3 to the group that received information about the percent of FISM spent with corruption. All specifications include the interaction of the three treatments with the information contained in the flyers. T1 is interacted with a dummy variable indicating that mayors spent more than 75 % of FISM, T2 is interacted with a dummy variable indicating mayors that spent more than 75% of FISM on poor areas, and T3 is interacted with a dummy indicating that mayors spent more than 75% of FISM with corruption. All specifications include fixed effects for municipality, and baseline poverty index, turnout in 2003, incumbent and challengers’ 2003 vote shares. Because we include municipality fixed effects, all specifications exclude the main effect ofinf ormation. Robust standard errors, clustered by municipality, in parentheses. *** p<0.01, ** p<0.05, * p<0.1
Table 4: Estimating the effects of information on party identification and mayors’ approval
(1) (2) (3) (4)
VARIABLES Party ID Party ID No Mayor
incumbent challenger party ID approval
Treatment 1 (% spent) 0.04 -0.06 0.02 -0.02
(0.06) (0.08) (0.08) (0.09)
Treatment 1 X >75% spent -0.01 -0.15 0.16 0.12
(0.10) (0.11) (0.12) (0.13)
Treatment 2 (% spent on poor areas) 0.04 -0.04 0.00 -0.09
(0.05) (0.06) (0.06) (0.09)
Treatment 2 X >75% spent on poor areas - - -
-- - -
-Treatment 3 (% spent with corruption) 0.01 -0.08 0.07 0.00
(0.05) (0.08) (0.07) (0.06)
Treatment 3 X >75% spent with corruption -0.40*** 0.10 0.30*** -0.37***
(0.06) (0.10) (0.08) (0.09)
Constant 0.41 1.68* -1.10 1.43
(0.68) (0.93) (1.12) (1.03)
Controls yes yes yes yes
Municipality fixed effects yes yes yes yes
Observations 746 746 746 746
R-squared 0.11 0.13 0.15 0.18
Notes: This table reports four separate regressions. The dependent variables are: in column (1) a dummy variable indicating that the respondent identifies with the incumbent party, in column (2) a dummy variable indicating that the respondent identifies with any challenger party, in column (3) a dummy variable indicating that the respondent does not identify with any party, and in column (4) a dummy variable indicating the respondent approves the performance of the mayor. See table 3 for details on independent variables. The four columns include all interactions and main effects that are not specified at the municipal level. Robust standard errors, clustered by polling precinct, in parentheses. *** p<0.01, ** p<0.05, * p<0.1
A
Appendix
Figure 1: Example of Flyer
Notes: The flyer was folded in half. The upper image is the front and back of the flyer, the lower image is the inside of the flyer.
Table A.1: Estimates of information on electoral outcomes without controls
(1) (2) (3)
VARIABLES Turnout Incumbent Challengers
vote share vote shares
Treatment 1 (% spent) -0.27 -0.51* 0.24
(0.39) (0.24) (0.49)
Treatment 1 X >75% spent 2.34** 1.22 1.12
(0.92) (0.69) (1.05)
Treatment 2 (% spent on poor areas) 3.36*** 3.00*** 0.37***
(0.02) (0.02) (0.02)
Treatment 2 X >75% spent on poor areas -3.32*** -3.03*** -0.29
(0.59) (0.35) (0.38)
Treatment 3 (% spent with corruption) -0.99*** -0.46 -0.52**
(0.29) (0.35) (0.19)
Treatment 3 X >75% spent with corruption -7.79*** -0.92** -6.87***
(0.31) (0.34) (0.20)
Constant 51.78*** 17.83*** 33.96***
(0.04) (0.04) (0.03)
Controls no no no
Municipality fixed effects yes yes yes
Observations 2,340 2,340 2,340
R-squared 0.44 0.53 0.44
Notes: See Table 3 for details. All specifications include fixed effects for municipality. Robust standard errors,
Table A.2: Alternative specifications of the effect of information on electoral outcomes
VARIABLES Turnout Incumbent Challengers
vote share vote shares
Linear
Treatment 1 (% spent) -1.33 -1.18* -0.15
(0.91) (0.56) (1.02)
Treatment 1 X % spent 2.65* 1.44 1.21
(1.23) (1.37) (1.71)
Treatment 2 (% spent on poor areas) 4.57** 2.74** 1.82*
(1.51) (1.08) (0.94)
Treatment 2 X % spent on poor areas -5.18** -3.14** -2.04
(1.71) (1.34) (1.16)
Treatment 3 (% spent with corruption) 0.02 -0.09 0.11
(0.57) (0.53) (0.26)
Treatment 3 X % spent with corruption -0.48 0.02 -0.50
(1.21) (1.03) (0.64) Semiparametric Treatment 1 (% spent) 0.30 -0.72*** 1.02*** (0.23) (0.23) (0.28) Treatment 1 X 25−50% spent -1.05*** 0.36* -1.41*** (0.24) (0.19) (0.28) Treatment 1 X 50−75% spent -0.83 -0.02 -0.80 (0.73) (0.70) (0.67) Treatment 1 X >75% spent 1.22*** 1.02 0.20 (0.39) (0.87) (0.87)
Treatment 2 (% spent on poor areas) 2.39*** 1.47*** 0.92***
(0.28) (0.22) (0.11)
Treatment 2 X >75% spent on poor areas -2.52*** -1.57*** -0.95**
(0.62) (0.38) (0.41)
Treatment 3 (% spent with corruption) -0.15 -0.10 -0.05
(0.49) (0.49) (0.23)
Treatment 3 X 25−50% spent with corruption 1.32* -0.02 1.34***
(0.65) (0.60) (0.33)
Treatment 3 X 50−75% spent with corruption 0.18 0.17 0.01
(0.50) (0.51) (0.29)
Treatment 3 X >75% spent with corruption -3.96*** -2.03** -1.93***
(0.91) (0.76) (0.33)
Constant 16.10*** 5.24** 10.86***
(2.35) (2.11) (1.06)
Controls yes yes yes
Municipality fixed effects yes yes yes
Observations 2,308 2,308 2,308
R-squared 0.73 0.74 0.64
Notes: See Table 3 for details. All specifications include fixed effects for municipality and baseline poverty index, turnout in 2003 and incumbent and challengers 2003 votes divided by registered voters. Robust standard errors,