An analysis of visualization processes used by selected Grade 11 and 12
learners when solving algebraic problems: A Namibian case study.
A thesis submitted in fulfillment of the requirements for the degree
of
Master of Education
(Mathematics Education)
of
Rhodes University
by
Joseane Josef
November 2016
ABSTRACT
Visualisation is gaining visibility in mathematics education research. It is a powerful tool for solving different types o f problems in many areas o f mathematics, including Algebra - the mathematical domain o f this study. The aim o f this case study was to analyse the visualisation processes that selected senior secondary school learners used to solve a set o f ten algebraic problems.
The research was conducted at a secondary school in the Erongo region o f Namibia. This is the school where the researcher is teaching. The sample consisted o f six selected learners, three from Grade 11 and three from Grade 12. The learners were purposefully selected to participate in this study based on their mathematics performance in class and their willingness to participate. The participants were video recorded as they worked through the ten items o f an Algebraic Visualisation Tasks (AVT) worksheet. They were also interviewed about the visualisation processes they employed when solving each o f the tasks. The AVT, the videos and the interviews were analysed with the aid o f an adapted visualisation template.
The findings o f the study show that learners used visualisations in all their problem-solving processes. These visualisations were used for different purposes such as starting points, for illustrative purposes, as organizational tools and as simplification tools. Visualisations as starting points were used when the problem was wordy and had lengthy descriptions and explanations. Illustrative visualisations enabled learners to articulate in their own way mathematical notations, mathematical equations and expressions that they then used to solve the problem. Organizational pictures provided a useful structural framework for solving the problems.
This research suggests that the selected participants indeed used visualisation processes to solve algebraic problems. It is thus important for teachers to harness this aid and make the most use o f these visualisation processes when teaching Algebra.
ACKNOWLEDGEMENT
I would first like to thank my thesis advisor P rof Mark Schafer. The door to Prof Schafer’s office was always open whenever I had a question about my research or writing. He consistently allowed this thesis to be my own work, but directed me in the right direction every time he thought I needed it. His guidance helped me in during the time o f research and writing o f this thesis. I could not have imagined having a better advisor and mentor for my research.
I would also like to acknowledge Mr. Robert Kraft and Beata Lididimikeni Dongwi for willingly assisting me when I needed their input the most and for being so helpful.
I would also like to acknowledge Ms Christine Stewart as the second reader o f this thesis, and I am gratefully thankful to her for her very valuable comments on this thesis.
I would also like to thank my learners who were involved in this research project. W ithout their passionate participation and input, the research could not have been successfully concluded.
Finally, I must express my very profound gratitude to my husband Pele Haufiku, my mom Hendrina Nuukelo Ashipala, my son Hafoletu, my parents, my brothers and sisters for providing me with unfailing support and continuous encouragement throughout my years o f study and through the process o f researching and writing this thesis. This accomplishment would not have been possible without them. Thank you.
DECLARATION OF ORIGINALITY
I Joseane Josef (Student Number: 13j6825) declare that this thesis is my own work written in my own words. It has not been submitted in any form for another qualification or any assessment to another University or institution. Where I have drawn on the words or ideas o f others, these have been acknowledged using the reference practices according to the Rhodes University Education Department Guide to Referencing.
Joseane Josef
(Signature)
25 November 2016 (Date)
TABLE OF CONTENTS
ABSTRACT... i
ACKNOWLEDGEMENT... ii
DECLARATION OF ORIGINALITY... iii
TABLE OF CONTENTS... iv
LIST OF TABLES... viii
LIST OF FIGURES... ixx
CHAPTER 1 ... 1
INTRODUCTION OF THE STUDY...1
1.1 INTRODUCTION... 1
1.2 BACKGROUND TO THE STUDY... 1
1.2.1 Context... 1
1.2.2 Rationale... 4
1.3 RESEARCH GOALS AND QUESTIONS... 4
1.4 RESEARCH METHODOLOGY...4
1.4.1 Orientation... 4
1.4.2 Research design... 5
1.4.3 Research processes... 5
1.5 SIGNIFICANCE OF THE STUDY...5
1.6 LIMITATIONS...6 1.7 STRUCTURE OF THESIS... 6 1.7.1 Chapter two...6 1.7.2 Chapter three...6 1.7.3 Chapter four...6 1.7.4 Chapter five...7 CHAPTER 2 ... 8 LITERATURE REVIEW...8 2.1 INTRODUCTION...8 2.2 VISUALISATION...8
9 2.2.2 Types of mathematical visualisations...
2.2.3 Interaction between external and internal representations...12
2.2.4 Importance of visualisation... 13
2.3 PROBLEM SOLVING... 20
2.3.1 What is problem solving? / What are problems?...21
2.3.2 What kind of tasks are not problem solving?... 23
2.3.3 Why a problem-solving approach is used in School Mathematics... 25
2.3.4 Process Models of Mathematics Problem Solving...27
2.4 ALGEBRA... 31
2.4.1 Visual representations in algebra... 32
2.5 THE NAMIBIAN CONTEXT...34
2.5.1 Visualisation in the Namibian curriculum... 34
2.5.2 Algebra in the Namibian curriculum...35
2.6 THEORETICAL FRAMEWORK...36
2.6.1 Constructivism... 36
2.6.2 Constructivism and visualisation... 38
2.7 CONCLUSION...41 CHAPTER 3 ... 42 RESEARCH METHODOLOGY... 42 3.1 INTRODUCTION...42 3.2. ORIENTATION...42 3.3 RESEARCH METHOD... 43 3.4 RESEARCH DESIGN... 43 3.5 PARTICIPANTS...44
3.6 DATA COLLECTION TOOLS...44
3.6.1 Algebraic visualisation tasks (AVT)... 44
3.6.2 Interviews... 46
3.6.3 Observations...47
3.7 DATA ANALYSIS...47
3.7.1 Algebraic visualisation tasks (responses)...47
3.7.2 Interviews and video recordings... 49
3.9 ETHICS... 51
3.9.1 Respect and dignity... 51
3.9.2 Transparency and honesty...51
3.9.3 Accountability and responsibility... 51
3.9.4 Integrity, academic professionalism and researcher positionality...51
3.10 CONCLUSION...52
CHAPTER 4 ... 53
DATA PRESENTATION AND RESULT ANALYSIS...53
4.1 INTRODUCTION...53
4.2 THE ALGERAIC VISUALISATION TASKS...53
4.2.1 Task 1 ... 55 4.2.2 Task 2 ... 68 4.2.3 Task 3 ... 81 4.2.4 Task 4 ... 94 4.2.5 Task 5 ...106 4.2.6 Task 6 ...118 4.2.7 Task 7 ...131 4.2.8 Task 8 ...144 4.2.9 Task 9 ...156 4.2.10 Task 10...169
4.3 THE COMBINED RESULTS FOR ALL TASKS... 181
4.4 CONCLUSION... 183
CHAPTER 5 ... 184
FINDINGS AND CONCLUSION...184
5.1 INTRODUCTION ... 184
5.2 SUMMARY OF FINDINGS...184
5.2.1 External visualisation ... 184
5.2.2 Internal visualisations...185
5.2.3 Use of illustrative visualisations ... 185
5.2.4 The use of organizational visualisations... 185
5.2.5 The use of visualisations as starting points... 186
5.3 SIGNIFICANCE OF THE STUDY 186
5.4RECOMMENDATIONS...186
5.5 LIMITATIONS...187
5.6 SUGGESTIONS FOR FURTHER RESEARCH...188
5.7 PERSONAL REFLECTION...188
5.7.1 My own experience of visualisations in algebra at school...188
5.7.2My research experience...189
5.8CONCLUSION...189
REFERENCES'...190
APPENDICES ... 203
APPENDIX A - LETTER TO THE PRINCIPAL...203
APPENDIX B - LETTER TO INSPECTOR...205
APPENDIX C: LETTER TO THE PARENTS...207
APPENDIX D: CONSENT FORM...208
APPENDEX E: THE ALGEBRAIC VISUALISATION TASKS...209
APPENDEX F: ANALYTIC TEMPLATE A - CATEGORIES OF VISUALISATION PROCESSES...210
LIST OF TABLES
Table 2.1: Role o f visual representations
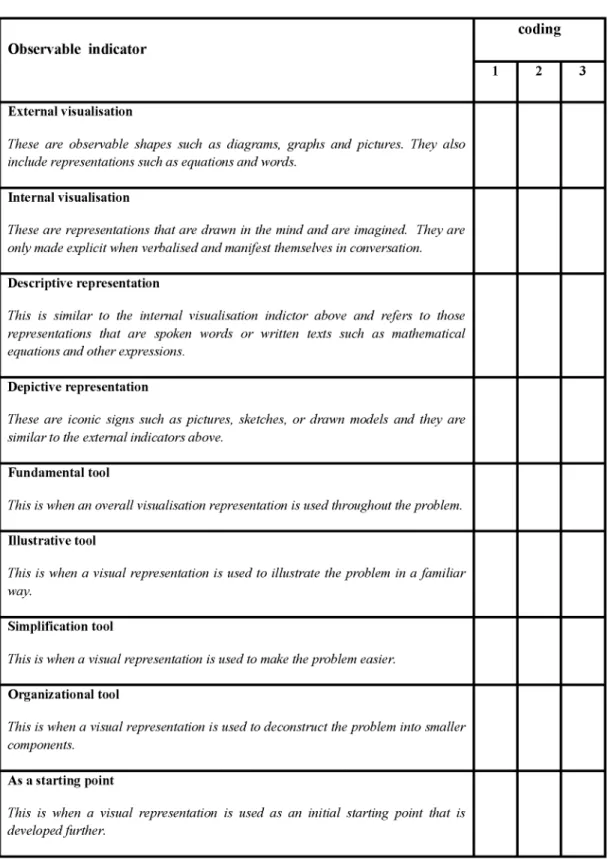
Table 3.1: Analytic Template A - Categories o f visualisation processes
Table 3.2: Analytic Template B - Coding visualisation processes used in each AVT task
LIST OF FIGURES
Figure 2.1: Four basic principles o f problem solving
Figure 2.2: Three types o f graphic organisers
Figure 4.1: Picture o f L 2’s response to task 1
Figure 4.2: Picture o f L 3’s response to task 1
Figure 4.3: Picture o f L 4’s response to task 1
Figure 4.4: Picture o f L 5’s response to task 1
Figure 4.5: The types o f visualizations used in task one.
Figure 4.6: Picture o f L 1’s response to task 2
Figure 4.7: Picture o f L 2’s response to task 2
Figure 4.8: Picture o f L 3’s response to task 2
Figure 4.9: Picture o f L 4’s response to task 2
Figure 4.10: Picture o f L 5’s response to task 2
Figure 4.11: Picture o f L 6’s response to task 2
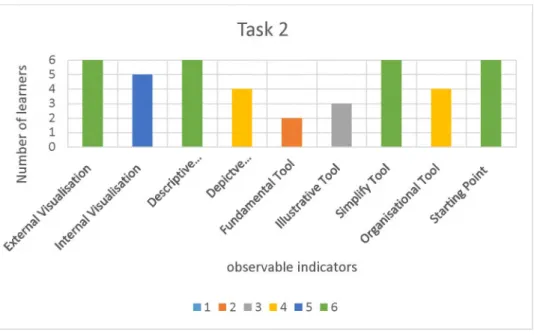
Figure 4.12: The types o f visualizations used in task two
Figure 4.13: Picture o f L 1’s response to task 3
Figure 4.14: Picture o f L 2’s response to task 3
Figure 4.15: Picture o f L 3’s response to task 3
Figure 4.16: Picture o f L 4’s response to task 3
Figure 4.17: Picture o f L 5’s response to task 3
Figure 4.18: Picture of L 6’s response to task 3
Figure 4.19 The types o f visualizations used in task three
Figure 4.21: Figure 4.22: Figure 4.23: Figure 4.24: Figure 4.25: Figure 4.26: Figure 4.27: Figure 4.28: Figure 4.29: Figure 4.30: Figure 4.31: Figure 4.32: Figure 4.33: Figure 4.34: Figure 4.35: Figure 4.36: Figure 4.37: Figure 4.38: Figure 4.39: Figure 4.40: Figure 4.41: Figure 4.42: Figure 4.43: Figure 4.44: Figure 4.45:
Picture o f L 2’s response to task 4 Picture o f L 2’s response to task 4 Picture o f L 3 ’s response to task 4 Picture o f L3’s response to task 4 Picture o f L 4’s response to task 4 Picture o f L 6 ’s response to task 4
The types o f visualizations used in task four Picture o f L 1’s response to task 5
Picture o f L 3’s response to task 5 Picture o f L 4’s response to task 5 Picture o f L 5’s response to task 5 Picture o f L 6’s response to task 5
The types o f visualizations used in task five Picture o f L1 ’s response to task 6
Picture o f L2’s response to task 6 Picture o f L 3’s response to task 6 Picture o f L 4’s response to task 6 Picture o f L 5’s response to task 6 Picture o f L 6’s response to task 6
The types o f visualizations used in task six Picture o f L1 ’s response to task 7
Picture o f L2’s response to task 7 Picture o f L 3’s response to task 7 Picture o f L 4’s response to task 7 Picture o f L 5’s response to task 7
Figure 4.46 Figure 4.47 Figure 4.48 Figure 4.49 Figure 4.50 Figure 4.51 Figure 4.52: Figure 4.53: Figure 4.54: Figure 4.55: Figure 4.56: Figure 4.57: Figure 4.58: Figure 4:59 Figure 4.60: Figure 4.61: Figure 4.62: Figure 4.63: Figure 4.64: Figure 4.65: Figure 4.66: Figure 4.67: Figure 4.68: Figure 4.69:
Picture o f L 6’s response to task 7
The types o f visualizations used in task seven Picture o f L2’s response to task 8
Picture o f L 3’s response to task 8 Picture o f L 4’s response to task 8 Picture o f L 6’s response to task 8
The types o f visualizations used in task eight Picture o f L1 ’s response to task 9
Picture o f L1 ’s response to task 9 Picture o f L2’s response to task 9 Picture o f L 3’s response to task 9 Picture o f L 4’s response to task 9 Picture o f L 5’s response to task 9 Picture o f L 6’s response to task 9
The types o f visualizations used in task nine Picture o f L 3’s response to task 10
Picture o f L 3’s response to task 10 Picture o f L 4’s response to task 10 Picture o f L 4’s response to task 10 Picture o f L 5’s response to task 10 Picture o f L 5’s response to task 10 Picture o f L 6’s response to task 10
The types o f visualizations used in task ten The use o f all visualizations for all tasks.
CHAPTER 1
INTRODUCTION OF THE STUDY
“People remember visual aspects o f a concept better than its analytical aspects” Vinner (1992, p. 212)
1.1 INTRODUCTION
This chapter introduces my study, which is an analysis o f visualisation processes used by selected Grade 11 and 12 learners when solving algebraic problems. The chapter begins by providing the background o f the study and its context. It then explains the rationale for the study. It also presents the research question and the significance o f the study as well as highlighting some limitations to the study. The chapter then concludes with a brief overview o f the study.
1.2 BACKGROUND TO THE STUDY
1.2.1 Context
In my experience, many students often struggle to use visualisation as a strategy especially when solving mathematical problems. This, I argue, could negatively affect their performance. Healy and Hoyles (1996) articulate, “Unlike mathematicians, students o f mathematics rarely exploit the considerable potential o f visual approaches to support meaningful learning. ...they are reluctant to engage with visual modes o f reasoning” (p. 67). Healy and Hoyles continue by stressing the advantages o f being able to use particular images or diagrams in the service o f mathematical generalization, and o f making connections between modes o f thinking. Van Garderen, Potch & Scheuermann, (2012) noted the importance o f employing visualisation strategies. They argue that the use o f visual aids such as sketches and diagrams are very powerful strategies in solving different types o f problems for many topic areas.
The literature suggests that mathematical knowledge or computation skills are not the only key to mathematical understanding, but that there are other contributing factors, including the ability to
visualise the problems that may affect achievement (Cummins et al., 1988; Hegarty et al., 1995; Kyttala & Bjorn, 2014).
My research project aimed to not only analyse the visualisation strategies employed by learners in solving algebraic problems, but also how the learners used these strategies and identified the visualisation processes that they employed. My study was inspired by Thornton (2000) who proposes, “Though much has been said about visualisation in general, there are still many issues concerning visualisation in mathematics education, which require careful attention.” (p. 251). There is a need for teachers to understand how learners think visually during problem solving to be able to teach mathematical concepts such as algebraic concepts and problem solving (Makina & Wassels, 2009). It is important to listen to learners since there is a difference between what we (as teachers) want children to learn and what they actually take from our lessons (Makina & Wassels, 2009). Makina and Wassels further state that understanding the student’s mind during problem solving improves the teaching of mathematics. SteenpaB, et al., (2014) resonate with Makina & Wassels that “understanding how learners come to understand and conceptualize the world around them can help teachers facilitate learning” (p. 2).
Furthermore, visualisation processes stimulate learners to ‘‘discover the unexpected, and describe and explain the expected’’ (Thomas & Cook, as cited in Rivera et al., 2014, p. 1). A visualisation process is one that involves visual imagery with or without a diagram, as an essential part o f the method of solution (Presmeg, 1985, p. 298). The interaction o f context, visual representational forms and using technological tools, is seen as a key strategy that supports functional understanding (Confrey & Smith, 1994). Using visualisation processes can thus assist learners to make new discoveries and solve mathematical problems. It is therefore important for teachers and learners to be aware o f the type of visualisation processes and strategies used by learners that help them in solving algebraic problems. Ho (2010) articulates that “if visualisation is at the heart o f mathematical problem solving, then it is vital that both teachers and students see the role o f visualisation clearly and use it to help them in their problem-solving process” (p. 3).
Threlfall (2009) defines problem solving strategies in a mathematical context, as the “different ways” that mathematical problems are solved (p. 154).When learners are given a mathematical problem the
overall approach to the problem is what Threlfall (2009) and Ashcraft (1990, as cited in Threlfall, 2009) refer to as strategies. For example, we can examine the possible responses o f learners to a
problem such as “a number is trebled and then 7 is added to it. I f the total is 28, fin d the numbed’.
W hen learners are asked how they solved the problem, their responses will be manifold. They may
say, “I used the method that I was taught by my teacher” or “I came up with an equation that I solved
to get the answer ” or “I did the calculation mentally ’ or “I used the try and error m ethod’ or “I used a sketch to visualise the problem1’. All these are legitimate strategies that learners can use to solve problems; the conclusion is that there are many different approaches that lead to the same solution.
Good and appropriate strategies and representations enable learners to solve problems efficiently and accurately (Heinze, Star & Verschaffel, 2009). Rivera (2003, p.59) postulates, “visual strategies play a mediating role in the emergence o f children’s sophisticated, structured and necessary understandings o f mathematical objects” . Children use visual strategies to help them conduct explorations, organize
relevant data and anticipate an intended analysis (ibid.).
Draper (2010) argues that “visualisation strategies help learners recall facts, get the main idea, make an inference, draw a conclusion, predict/extend and evaluate” (p.11). Leaners use visualisation strategies to “analyse and make conjectures about information, to analyse situations to make connections and plan solutions” (Draper, 2012, p. 2). However, individual learners should acquire the ability to solve mathematical tasks flexibly by a diversity o f meaningful acquired strategies and representation (Heinze et al., 2009). Learners with strategic competence can not only come up with several approaches to a non-routine problem but can also choose flexibly the method to suit the demands presented by the problem and the situation in which it was posed (Kilpatrick.et al., 2001, p. 129).
Learners can only use visualisation processes flexibly and adaptively when they know when to use them, why to use them and where to use them. In short, the choice o f strategy is an important consideration. My research therefore aimed to explore the visual processes that selected learners use to solve algebraic problems. I believe that this study will also benefit other teachers and learners in recognising the importance o f using visualisation processes in their practices.
1.2.2 Rationale
Watson (2007) asserts that the use o f diagrams, visual representations and mental images are important elements in solving mathematical problems. There are many ways to solve algebraic problems and learners need the skill to choose an appropriate visualisation strategy for a specific problem (Polya 1957; Ho, 2010). Despite the abundant evidence provided by literature about the importance of visualisations, the use o f visualisations in the teaching and learning in Namibia is, in my view, not sufficiently recognized.
The purpose o f my study is therefore to inform the curriculum developers about the importance of visualisations and the impact that it has on the teaching and learning o f Mathematics. This could contribute to the revision processes o f the current Namibian curriculum. The research also aims to encourage teachers to make use o f visual representations in their lessons, and to motivate learners to make use o f visual representations when solving mathematical problems.
1.3 RESEARCH GOALS AND QUESTIONS
The aim o f the study is to analyse selected learners’ visualisation processes in solving algebraic problems and find out how they are used. The two research questions that frame the study are:
- W hat problem solving strategies using visualisation processes are employed by selected Grade
11 and 12 learners when solving algebraic problems?
- How do these Grade 11 and 12 learners use the identified problem solving processes to solve
algebraic problems?
1.4 RESEARCH METHODOLOGY
1.4.1 Orientation
My research project was oriented within an interpretive paradigm as I wished to gain a deeper understanding o f how learners solve algebraic problems with respect to the visualisation processes
that they use. According to Bertram & Christiansen (2014), interpretivist researchers “aim to
1.4.2 Research design
The study was conducted in one school only and a small sample o f three Grade 11 and three Grade 12 learners was used. These learners were purposely selected based on their participation in their class, their performance in their tests and in examinations. Thus, this study was framed as a case study. According to Rule & John, as cited in Bertram, & Christiansen (2014), “a case study is a systematic and in-depth study o f one particular case in its context” (p. 42).
To collect data for this research I used different research tools such as interviews (that were conducted when learners were working on the algebraic tasks), learners’ work (responses to the Algebraic Visualisation Tasks-AVT) and observation. The interviews were conducted in order to find out and interpret the visualisation processes that the learners employed. Observations were collected to further identify the visualisation processes used and the manner in which they were used. A template was designed to assist in identifying and categorising the visualisation processes that were observed.
1.4.3 Research processes
The data generation took place in three phases. In the first phase, I selected the site and the participants. I also refined the algebraic visualisation tasks (AVT) and piloted them. In the second phase, I implemented the AVT. The interviews and the observations took place in this phase. The interactions were video recoded to capture what participants said and drew. In the third phase, video recordings were analysed.
1.5 SIGNIFICANCE OF THE STUDY
Students use visualisation processes as tools to support their mathematical understandings. For teachers, the strategic use o f visualisation processes in their lessons could influence students’ acquisition o f knowledge and have a bearing on their mathematical achievement.
The research could provide insightful information on algebraic problem solving strategies that could be useful to teachers, learners and curriculum developers. It is hoped that as I disseminate the findings o f this research, teachers will appreciate the significance o f recognizing the visualisation processes that learners use when they engage in algebraic problems. For curriculum developers this study could
be informative in foregrounding the need to use appropriate visualisations in class in general and for algebraic problem solving in particular. This understanding can lead to the enhancement o f the curriculum.
1.6 LIMITATIONS
Only six learners participated in this research case study. This is a very small sample and consequently the findings o f this study cannot be generalized. The analysis o f a higher number o f learners’ work would have possibly revealed more visualisation processes and provided a more comprehensive picture.
1.7 STRUCTURE OF THESIS
1.7.1 Chapter two
This chapter provides an in-depth contextual background to the study. It starts with the definition of visualisation in a detailed way where visualisations in mathematics are discussed. It also deals with
the role and processes o f visualisation in mathematics. The chapter discusses the terms problem
solving and algebra. Thereafter a brief discussion o f visualisations and Algebra in the Namibian context is provided. The chapter is concluded by providing a theoretical backdrop to the study.
1.7.2 Chapter three
This chapter presents and discusses the research methodology used in this study. The chapter discusses the research goals, research orientation, sampling, data generation and data analysis, as well as issues relating to ethics and validity. The final drafts o f the algebraic visualisation tasks and the analytical tool are also presented in this chapter.
1.7.3 Chapter four
This chapter consists o f the data analysis and findings o f this study. The chapter provides an analysis o f the participants’ AVT work and the interviews. It starts with a description o f the video clips and the analysis o f the AVT. In conclusion, it gives details o f the visualisations used by the learners and the manner in which they were used.
Chapter five concludes the study by providing a summary o f the findings o f the study, making certain recommendations arising from it, describing the limitations o f the study and making suggestions for future research. Moreover, the chapter also includes some personal reflections on my journey as a novice researcher.
CHAPTER 2
LITERATURE REVIEW
“Mathematics requires representations. In fact, because o f the abstract nature o f mathematics, people have access to mathematical ideas only through the representation o f those ideas”
(Kilpatrick, Swafford, & Findell, 2001, p. 94).
2.1 INTRODUCTION
This chapter reviews the literature about visualisations. It defines visualisation and discusses how visualisation influences the teaching and learning o f mathematics. Problem solving is also described and the difference between problem solving tasks and exercise tasks is presented. Additionally reasons as to why problem solving is part o f the curriculum are discussed. Thereafter, I elaborate on the role that visualisation plays in algebra, and particularly in the Namibian context. The chapter will conclude by reviewing my theoretical framework, which is constructivism and visualisation.
2.2 VISUALISATION
2.2.1 Visual representations in Mathematics
Within the domain o f mathematics, the terms visualisation(s) and representation(s) are used
interchangeably. However, for the purpose o f this thesis I will make no distinction between the two. W hen quoting or referencing other authors’ works, I will use their terminology.
Previous research defined and explained visualisation(s)/representation(s) as follows: Duval (2014, pp.159-160) define visual representations as “all kinds o f representations that are used in mathematics and in the teaching o f mathematics to fulfil quite different functions such as mathematical treatment, heuristic exploration in problem solving, and as educational tool for helping the acquisition of mathematical concepts“ . Palmer (1977 as cited in Goldin & Kaput, 1996) defines a visual representation as a thing which is produced that symbolises, stands for, is associated with, or otherwise
represents something else. Furthermore, Stylianou (2013) echoes, “representation includes the choices
we make for expressing and depicting mathematical ideas and the ways in which we put them to use. Representations can be drawings, diagrams, physical models, and also mathematical symbols - in
short, the range o f symbolic tools that can be used for representing aspects o f the world” . (p. 23). Visual representations are types o f external representations that are used extensively in mathematics textbooks and are considered to enhance problem solving in all the phases o f a particular process (Larkin & Simon, 1987).
Moreover, Shulman (1986) acknowledged visual representations as being part o f teachers’ pedagogical knowledge. He defined these representations as “including analogies, illustrations, examples, explanations, and demonstrations in a word, the ways o f representing and formulating the subject that make it comprehensible to others” (p.9). However, representing is not a matter o f simply copying what we see. Instead, it involves discovering or adapting conventions o f a representational system for the purpose at hand. Thus, Stylianou (2013) argues, “the development o f students’ ability to represent ideas in different ways is fundamental to mathematical work” (p.23).
2.2.2 Types of mathematical visualisations
Zimmermann and Cunningham (2010) see mathematical visualisation as a broad field that comprises non-computer based visualisation as well as visualisation based on computers or other technologies. They further state that mathematical visualisation includes “the ability to draw a simple figure to represent a mathematical problem, to interpret such figures with understanding, and to use such figures as an aid in problem solving” (p.5). Zimmermann and Cunningham specify that the ability to draw mathematical representations and interpret them with understanding is a fundamental visualisation skill. “Without such fundamental skills, it is unlikely that computer-based visualisation can be used efficiently, or even meaningfully. Vision is not visualisation; to see is not necessarily to understand”
(p 5).
W hen solving mathematical problems, learners go through different processes. They generate diagrams and other representations that aid them in finding the solution. For example, to solve a mathematics problem, the problem solver (learner) must first construct an internal representation of the problem and build a mental model o f the problem situation (Casey, 1978, cited in Clements, 1980; Kintsch & Greeno, 1985; Mayer, 1992). These mental and internal constructions is what Goldin and Steingold (2001) refer to as internal and external visualisations or ‘mental structures’ and ‘notation systems’ respectively as referred to by Kaput (1991).
In an attempt to distinguish between the two visualisations, Goldin and Steingold (2001) suggest that
external systems o f representation include conventional representations that are usually symbolic in nature, such as our numeration system, mathematical equations, algebraic expressions, graphs, geometric figures, and number lines. Goldin and Kaput (1996, p. 400) define external representations as “physically embodied, observable configurations such as words, graphs, pictures, equations, or computer micro worlds” . Janvier, Girardon, & Morand (1993) echo that “representations such as numerals, algebraic equations, a graph, tables, diagrams, and charts are external manifestations of mathematical concepts.” (p. 81). According to Chiappini and Bottino (2010) external representations “are two- or three-dimensional representations o f some aspects o f a mathematical structure” (p.1).
In addition, Goldin & Shteingold (2001) provide other examples o f external representation. They state that some external systems o f representation are mainly notational and formal and these include our system o f numeration; our ways o f writing and manipulating algebraic expressions and equations; our conventions for denoting functions, derivatives, and integrals in calculus; and computer languages such as Logo. They further state that other external systems are designed to exhibit relationships visually or spatially, such as number lines, graphs based on Cartesian, polar, or other coordinate systems, box plots o f data, geometric diagrams, and computer-generated images o f fractals. Finally, they indicate that words and sentences, written or spoken, are also external representations. They can denote and describe material objects, physical properties, actions and relations, or things that are far more abstract.
On the other hand, internal systems o f representation are created within a person’s mind and used to
assign mathematical meaning (Goldin and Steingold, 2001). Kosslyn (1995) suggests that internal representations are visual imagery, which he defines as mental representations o f the appearance of objects and manipulation o f these representations in the mind. Similarly, internal visualisation is defined by Goldin (2002) as “the internal systems o f representation that are created within a person’s mind and used to assign mathematical meaning” . (p. 178). Goldin and Kaput (1996) agree that “internal configurations are those characteristics o f the reasoning individual that are encoded in the human brain and nervous system and are to be inferred from observation” . (p.402).
In the past, the area o f mental representations was widely ignored during the period where the dominant school o f thought was linked to behaviourist theories (Gardner, 1985), but with the increase o f cognitive science, mental representations are increasingly being recognised and seen as an important part o f learning (Gardner, 1985). Goldin (1998, p. 194) identifies the following internal representations:
• Verbal or syntactic: capacities related to the use o f natural language by individuals,
mathematical and non-mathematical vocabulary, including the use o f grammar and syntax.
• Figural (imagistic) and gestural systems, including spatial and visual cognitive configurations,
or mental images, gestural and body schema.
• Mental manipulation o f formal notations (numerals, arithmetic operations, visualisation of
symbolic steps to solve an equation)
• Strategic and heuristic processes: trial and error, breakdown into stages, etc.
• Affective systems o f representation: emotions, attitudes, beliefs and values with respect to
mathematics, or about themselves in relation to mathematics.
According to Schnotz & Bannert (2003), text and visual displays belong to classes o f representations called descriptive and depictive representations respectively. Descriptions are regarded as more powerful in representing different kinds o f subject matter while depictions are better suited to draw inferences (Johnson-Laird, 1983; Johnson-Laird & Byrne, 1991).
Schnotz & Bannert (2003) define descriptive representations as representations that are spoken words or written texts such as mathematical equations and logical expressions. According to Elia, Gagatsis, Monoyiou & Spagnolo (2014), descriptive representations consist o f symbols that have a subjective structure and are associated with the content they represent simply by means o f a convention. A depictive representation consists o f iconic signs such as pictures, sketches, or drawn models (p. 143). Depictive representations include iconic signs that are associated with the content they represent through common structural features on either a concrete or more abstract level (Elia et al., 2014). Schnotz et al. (2003) provide a simple example, “if the descriptive representation o f a function is made by the term 2x + y = 0 then a corresponding depictive can be a straight line graph in a Cartesian plane that passes through the origin” (p. 32). In other words 2x + y = 0 is a descriptive representation and the straight line diagram is the depictive representation.
However, this study will not go into details o f what internal and external visualisations are, but rather advocate the significance o f both internal and external visualisations in understanding mathematical concepts. English and Halford (1995) suggest, “The essence o f understanding a concept is to have an internal representation or internal model that faithfully reflects the structure o f that concept” . (p. 57). However, learners have to use external representation to explain and show their understanding. The New Zealand Ministry o f Education (2008) states, “a student’s ability to illustrate their mental strategy with materials is evidence o f strong understanding o f the number properties involved” . This implies that none o f these types o f visualisation (external and internal) can be used in isolation.
2.2.3 Interaction between external and internal representations
Understanding o f a mathematical concept is based on the internal representations o f a concept, which are influenced by the external representations o f the concept that are presented to learners (Hiebert & Wearne, 1992). This implies that there is a relationship between internal and external representations in developing students’ understanding o f mathematical concepts. One example illustrates the interplay between internal and external visualisations as that o f a six years old child playing with several toys
(Pape & Tchoshanov, 2001). As the child plays, she names the first toy as one, the second as two, and
so on. Pape & Tchoshanov (2001) say that “these number words may simply be words the child has learned to utter as she touches each object in a series o f objects” and this child has no idea that “these words are symbols for the position o f the toys in the series the child is enumerating” (p.119). As the child gets older she begins to understand that the last number named in this game is the number of toys that are in the set and finally that there is a numeral that represents the number o f elements in the
set e.g. three and 3.
The interplay between internal and external representations is important as “it supports the development o f an effective model” (Piggott & Woodham, 2010. p, 2). It is considered to be fundamental for teaching and learning (Godino & Font, 2010). If teachers want learners to utilise and improve their capacity to visualise, they need to understand why visualisation is important (the purposes o f visualising) (Piggott & Woodham, 2010).
2.2.4 Importance of visualisation
Visualisation has long been thought to play an important role in mathematics problem solving (e.g., Hadamard, 1945). Some literature indicates that, when mathematical problems are particularly difficult, or when solutions must be shared with others, problem solvers may externalize these visualisations by making inscriptions on paper or other media (e.g., Clement, Lochhead, & Monk, 1981; Corter & Zahner,2007; Latour & Woolgar, 1986; Roth & McGinn, 1998; Russell, 2000; Schreiber, 2004). Thus, “visualisation processes help the individual to solve a problem or provide an explanation, prediction, or justification” (Perkins & Unger, 1994, pp. 6-7). In the context o f word problems, Harvey and Goudvis (2000, p. 7) describe the benefits o f visualising as follow:
• allows the reader to create mental images from the words in the problem
• enhances meaning with mental imagery
• links past experience to the words and ideas in the text
• enables readers to place themselves in the story
• strengthens a reader’s relationship to the text
• stimulates imaginative thinking
• heightens engagement with text
• brings joy to reading
It is now well accepted that the use o f particular modes o f representations (e.g. visual or concrete) leads to improvement o f students' mathematical abilities and development o f their advanced problem solving and reasoning skills (Krutetskii, 1976; Yakimanskaya, 1991; Presmeg, 1999). That is, the use o f multiple representations facilitates students' development o f mathematical concepts (e.g. Brenner et al., 1997) and their efforts to carry out tasks such as problem solving (Greeno & Hall, 1997).
Visual representations are important in mathematics education because they enhance an intuitive view and an understanding in many areas o f mathematics (Krutetskii, 1976; Usiskin, 1987). Parnafes & Disessa (2004) expresses, “when the students use several representations, they develop a more flexible understanding o f the concept” (p. 251). Corter & Zahner (2007) echo that external sketches or diagrams may sometimes be created by a problem solver to aid in understanding the problem text.
Understanding o f a mathematical concept is often based on the internal representations o f a concept, which are influenced by the external representations o f the concept that are presented to learners (Hiebert & Wearne, 1992). W ood (1999) also stated that conceptual understanding rests on a multiple system o f ‘signs’ or representations. The argument has been further justified by Lesh, Landau, & Hamilton (1983) that a student understands a mathematical concept if he or she could ‘translate’ or move between multiple representations.
Mathematics is composed o f a large set o f highly related abstractions (Fennema & Franke, 1992, p.153). Visualisation is an important way to concretize mathematical concepts, and may be used to represent mathematical objects that do not have a real existence. Zimmerman and Cunningham (1991) insist that visualisation supplies depth and meaning to understanding, serving as a reliable guide to problem solving, and inspiring creative discoveries. However, in order to achieve this understanding, they propose that visualisation cannot be isolated from the rest o f mathematics, implying that symbolical, numerical and visual representations o f ideas must be formulated and connected.
Rosken & Rolka (2006) also acknowledge the role that visualisation plays in mathematics learning. They state that visualisation can be a powerful tool to explore mathematical problems and to give meaning to mathematical concepts and the relationship between them. They further articulate, “visualisation allows for reducing complexity when dealing with a multitude o f information” (Rosken & Rolka, 2006, p. 458).
Some researchers have outlined the role that visualisations play in linking abstract mathematics to the concrete experiences o f learners (Bruner & Kenney, 1965; Post & Cramer, 1989; Fennema & Franke, 1992; Duval, 1999). Fennema & Franke (1992) are o f the view that:
Mathematics is composed o f a large set o f highly related abstractions, and if teachers do not know how to translate those abstractions into a form that enables learners to relate the mathematics to what they already know, they will not learn with understanding. (Fennema & Franke, 1992, p.153)
Furthermore, Van Garderen, Scheuermann, & Jackson (2012) observe that when a visual diagram is used in strategic ways (e.g. not only to understand and solve the problem but also to monitor problem solving), it has been positively correlated to higher performance in solving word problems. More broadly, “Visualisations can be considered as useful tools for constructing understanding and for communicating information and understanding” (Greeno & Hall, 1997, p.362). Diagrams are powerful ways to facilitate communication about critical ideas in mathematics as well as provide a platform for sharing problem-solving strategies with others (Stylianou, 2010). Duval (1999) summarises by saying that representations play an epistemological and pedagogical role in teaching and learning.
Regarding specifically the domain o f algebra, Rivera (2011) asserts that visually drawn constructions o f some mathematical objects, concepts or processes can effectively assist in developing what Mason et al. (2009) name as a structural awareness o f the corresponding abstract knowledge, despite being in an incomplete form. More researchers have outlined the role that representations play in linking abstract mathematics to the concrete experiences o f learners (Bruner & Kenney, 1965; Post & Cramer, 1989; Fennema & Franke, 1992; Duval, 1999).
In addition, the National Council o f Teachers o f Mathematics (2003) articulate that in some areas of mathematics, such as geometry, understanding and using pictures and diagrams is considered to be an integral part o f the domain knowledge. In other areas o f mathematics, such as algebra, external visualisations may not be an inherent part o f the domain knowledge, but may still be frequently used as a means o f solving problems or pursuing mathematical discovery (e.g., English, 1997; Presmeg, 2006). Polya (1957) echoes that the use o f visual representations is not always considered as an inherent part o f the target domain knowledge; rather it may be considered more as a general technique in the mathematician’s toolbox. This is relevant to this study, which focuses on visualisations in algebra. Even though algebra is often only perceived as a set o f numbers and letters (D ’Emiljo, 2006), there is a possibility that learners use visualisation as a strategy to solve algebraic problems. Thus this study seeks to identify the visual processes that learners use when solving algebra and explain how they are used.
A representation is a tool that can be used in multiple ways during the problem solving process. Stylianou (2011, p. 329) suggests some o f the uses and functions o f visualisations in students’ problem solving work. He proposes that a visual representation can be used:
• As a tool to process information - one might use a representation as a means o f putting together the various aspects o f the problem and o f examining how they contribute to the problem solving process.
• As a tool fo r recording information - one might use a representation as a tool that combines all the information instead o f keeping it “all in the mind” .
• As tools that allow exploration o f tasks or concepts - one might use the representation as an adaptable tool device that allows for experimentation with concepts and provides more information.
• As monitoring and assessing tools that evaluate progress in problem solving - representations may be used to monitor problem-solving progress and to make informed decisions when selecting subsequent goals and maintaining or revising current plans.
• As conscription tools - devices to negotiate and co-create meaning and strategy with fellow problem solvers. The representations form a shared interactive space that facilitates communication, as they may be used as a common language tool.
• As presentation tools - students use these representations to share information both formally and informally, regarding both the process and the end result.
Piggott and Woodham (2010) identify three purposes for visualising where the first one is to step into
the problem, the second is to model and the third is to plan ahead. Visualising to step into the problem is when learners use visualisations to help with understanding what the problem is about. The visualisation used by learners gives them the space to go deep into the situation. It helps them to clarify and support their understanding before any generalisation can happen.
Visualising to model a situation, Piggott and Woodham (2010) indicate that this purpose of visualisation is particularly useful when the situation is physically unattainable, in other words to try to see the 'unseen-able', for example the inside o f a 3D object.
Visualising to plan ahead involves “using visualising during the problem-solving process to anticipate. In other words asking yourself: 'what will be the consequence if I do this?’ This is related to problem posing ' what would happen if ...?’ It is not possible to ask the question 'What if?', if you have not thought ahead and any thinking ahead necessarily includes visualisation” (Piggott and Woodham, 2010, p.5).
Recent research by Kashefi, Alias, Kahar, Buhari & Zakaria (2015) identified the multi- functions of pictures (external visualisation) in problem solving as decorational, representational, organizational, and informational.
According to Carney & Levin (2002), decorative pictures simply decorate the page, bearing little or
no relationship to the text content. Decorative pictures do not give any actual information concerning
the solution o f the problem (Elia & Philippou, 2004). Representational pictures represent the whole
or part o f the content o f the problem, they illustrate what is described in the problem and so far are the
most commonly used type o f illustration. Organizational pictures provide a useful structural
framework for the text content. Elia & Philippou (2004) echo that organizational pictures provide directions for drawing or written work that support the solution procedure.
Zahner and Corter (2007) articulate that reorganization o f the given information is used across all problem topics because it is a very general strategy that helps problem solvers extract the necessary mathematical information from the given word problem. Florida Department o f Education (2010) indicates that graphic organizers and tables are some o f the strategies that are commonly used in organising ideas. Graphic organizers are diagrammatic illustrations designed to assist students in representing patterns, interpreting data, and analysing information relevant to problem-solving (Lovitt, 1994, Ellis, & Sabornie, 1990). Moreover, interpretational pictures help to clarify difficult text (e.g.
representing blood pressure in terms o f a pump system). Finally, informational pictures provide
information that is essential for the solution o f the problem; in other words, the problem is based on the picture.
Similarly, Spiliotopoulou & Triantafillou (2014) conducted a study to explore the co-deployment of visual representations (VRs) and reasoning in Mathematics and Physics texts in specific topics related
to the notion o f periodicity. Seven categories were identified concerning the role o f visual representations: Illustrative, Exemplifying, Starting point, Fundamental, Product o f reasoning, Organizing tool and Complementary - See table 2.1 below.
Table 2.1: Role o f visual representations
Categories Mathematics % Physical Science % Illustrative 9.01 26.73 Exemplifying 6.08 24.75
Starting point o f reasoning 43.20 15.84
Fundamental tool in reasoning 43.20 20.79
Product o f reasoning 22.73 9.90
Organizing tool 9.09 0.99
Complementary 0.00 7.92
Table 2 above presents the frequencies o f the categories o f the function o f visual representations in reasoning as they are encountered in Mathematics and Physics texts in secondary Education. One notes the more frequent occurrence o f the illustrative, exemplifying and reasoning functions o f visual representations in the Physics texts. On the other hand, visual representations seem to play a more significant role only in aspects o f reasoning in the Mathematics texts. For my study, this table was adapted and used as a data analytical tool (in chapter 4) which was used to analyse the data collected.
Ho (2010) conducted research aimed to find out the importance o f visualisation in mathematics, the factors that influence students’ choices o f problem solving methods and how visualisation helps
students in mathematical problem solving. She then identified different roles or functions that visualisation play as students use it to solve mathematical problems:
• to u n d erstan d the problem - Here visualisation helps learners to understand the problem by
representing the problem visually, by so doing, learners can understand how the elements in the problem relate to each other.
• to simplify the problem - Visualisation allows students to identify a simpler version o f the
problem, solving the problem and then formalizing the understanding o f the given problem and identifying a method that works for all such problems.
• to see connections to a related problem - This involves relating the given problem to previous
problem-solving experiences.
• to cater to individual learn in g styles - Each student has his or her own preference when it
comes to the use o f visual representations when solving problems.
• as a substitute for computation - The answer to the problem can be obtained directly from the
visual representation itself, without the need for computation.
• as a tool to check the solution - The visual representation may be used to check for the
reasonableness o f the answer obtained.
• to tran sfo rm the problem into a mathematical form - Mathematical forms may be obtained
from the visual representation to solve the problem.
(Ho, 2010, p.4)
On the teachers’ side, researchers have highlighted the role that representations play in the explanations o f mathematical concepts by teachers (Leinhardt, Putnam, Stein, & Baxter, 1991; Brophy, 1991; Fennema & Franke, 1992). Brophy (1991) articulates:
Skilled teachers have a repertoire o f such representations available for use when needed to elaborate on their instruction in response to student comments or questions or to provide alternative explanations for students who were unable to follow the initial instruction. (p. 352)
In the same line, Shulman (1986, p. 9) relates, “Teachers need to be able to draw on a variety of representations as there is “no single most powerful form o f representation” .
Unfortunately, dispute the current views o f researchers about the importance o f visualisation, there is still a tendency for visualisation to be unrecognised in mathematics classrooms. Because o f that some students, though able to visualise mathematically, often opt for non-visual processes (Presmeg, 1995). Moreover, Presmeg's findings (1986) indicate that an ability to apply and interchange both visual and non-visual methods in problem solving is particularly advantageous for students. However, the teaching o f school mathematics is predominately non-visual and 'visualisers are seriously under represented amongst high mathematical achievers' (ibid.). The undervaluing o f Mathematics visualisations in Namibia is one o f the reasons this study was conducted. The findings o f my study will hopefully contribute to teachers’, policy m akers’ and curriculum designers’ understanding o f how to harness visualisation processes in the effective teaching o f algebra.
2.3 PR O B L E M SO LV IN G
Solving a problem means finding a way out o f a difficulty, a way around an obstacle, attaining an aim that was not immediately attainable. Solving problems is the specific achievement o f intelligence, and intelligence is the specific gift o f mankind; solving problems can be regarded as the most characteristically human activity. (Doorman et al. 2007, p. 406)
Carpenter, et al. (1989) reported that when emphasis is placed on problem solving then (1) students’ attention on ideas and sense-making increases (2) there is space to construct own strategies, (3) other skills are enhanced, and (4) there is a difference in how the teacher knew their students’ thinking and the students growth in problem solving (p. 213). Van de W alle (2000) argues that problem solving:
• places the focus o f the students’ attention on ideas and sense-making
• develops ‘mathematical power’
provides on-going assessment data that can be used to make and change instructional decisions, help students succeed, and inform parents (p. 41).
The National Council o f Teachers o f Mathematics (1980) have called for the adoption o f a problem solving approach to the teaching o f mathematics. Halmos (1980) views that “the mathematician's main reason for existence is to solve problems, therefore, what mathematics really consists of, is problems and solutions” (p. 519). Yeap, Ferrucci & Carter (2006) confirm the centrality o f problem solving in Mathematics - that mathematical problem solving should be a focus o f school mathematics internationally.
2.3.1 W h at is problem solving? / W h at are problem s?
Even though problem solving has been prominent in mathematics education for several decades, it seems that its definition and classroom implementation are far from being consensual (Arcavi & Friedlander, 2007). Arcavi & Friedlander articulate that even people within the same culture or within the same educational system (e.g. curriculum developers, teachers), researchers in mathematics learning/teaching, and mathematicians do not necessarily share the same views on what constitutes a problem and what to teach under problem solving.
As stated above, there are different definitions o f ‘problems’ used in literature. A problem is a situation in which a goal is to be attained, but there is no readily accessible solution for problem solvers to obtain the answer to the problem (Charles & Lester, 1984; Lester, 1980; Po'lya, 1980). Cash (1979, p. 1434) gives two definitions o f a problem; he states, "in mathematics a problem is anything required to be done, or requiring the doing o f something." He further gives a second definition that a problem is “a question... that is perplexing or difficult." In Stanic & Kilpatrick’s (1989) historical review of problem solving, they identified three main themes regarding problem-solving usage. They state that problem solving is a context, it is a skill and thirdly, it is “ a r t” . In the same line, Doorman et al (2007) consider problem solving as the ‘art’ o f dealing with non-trivial problems which do not yet have a known, routine solution strategy to the student, but which provide opportunities for the student to develop new solution strategies.
Brownell (1942) says:
... problem solving refers (a) only to perceptual and conceptual tasks, (b) the nature of which the subject by reason o f original nature, o f previous learning, or o f organization of the task, is able to understand, but (c) for which at the time he knows no direct means of satisfaction. (d) The subject experiences perplexity in the problem situation, but he does not experience utter confusion. ... problem solving becomes the process by which the subject extricates him self from his problem. (p. 416)
Moreover, according to Polya (1957), problem solving is learning to deal with new and unfamiliar tasks, when the relevant solution methods are not known, or only partly mastered. Heller and Hungate (1985) take their definition o f "problem solving" to mean, "...being able to solve the exercises at the end o f a standard textbook chapter". Schoenfeld (1992, p. 334) reviews in detail how the meanings o f problem solving range from ‘‘working rote exercises’’ to ‘‘doing mathematics as a professional’’, including goals for problem solving as diverse as ‘‘to train students to think creatively ... to prepare students for problem co m p etitio n s. to learn standard techniques in particular domains, most
frequently in mathematical modelling . to provide a new approach to remedial mathematics (basic
skills).’’
Wheatley and Cobb state:
Mathematical problem solving is often a matter o f reasoning analytically, constructing an image, using the image to support additional conceptual re a s o n in g . a process o f building from images to analysis and analysis to images [that] may continue through many cycles. (1990, p. 161)
Ponte (2007, pp. 419-420), presented the notion o f a problem as a ‘‘question in which the students do not have a ready-made routine process to solve it, but that stimulates their curiosity and their will to work on it’’. At the same time, this author suggested that, in solving a problem, the student ‘‘is called to have an active participation. He/she must be a mathematician. He/she must face each new situation, think for him/herself, take his/her decisions and evaluate the work done’’ (p. 420).It is for these and other reasons that in my study learners (participants) will be actively involved; they are going to think
for themselves as to what visual problem solving process they will use to solve specific tasks. Learners will also be given tasks that are not familiar to them, which I believe will rouse their curiosity.
Arcavi & Friedlander (2007) recently conducted a study in Israel, the main aim o f which was to find out the explicit and implicit views on problems and problem solving and their study focused on the team leaders o f elementary mathematics curriculum developers. They compiled the different responses and below are some o f the quotes:
• ‘‘A problem consists o f data, a goal and a way to achieve this goal. While you solve a problem,
you do not know in advance the way to achieve the goal.’’
• ‘‘A problem is a situation which the student did not encounter previously. It is possible to
approach it in several ways and to ‘wet your hands’ while coping with it. At this stage, children don’t have an algorithmic way to deal with it.’’
• ‘‘The characteristics o f a problem are: there is no ‘paved w ay’ to a solution, it makes sense to
the solver who has at least partial tools to cope with it, the solver can understand the constraints, the solver is aware that she has some tools to solve it, and she can know whether she solved it correctly or not.’’ (p.358)
Erickson & Flowers (1999) agree that problem-solving tasks often present situations where no readily known or accessible procedures or algorithm determines the method o f solution. They argue further that students make sense o f mathematical situations where no well-defined routines or procedures exist. Thus, to help children reflect on their actions and create relationships, a problem-solving environment should be used and children be encouraged to use self-validation o f ideas (Kamii, 1990; Yackel, Cobb, Wood, Wheatly & Merkel, 1990).
2.3.2 W h at k ind of tasks are not problem solving?
Schoenfeld (1992) articulates that when students are tested on solving quadratic equations, for example, students know that they will be using the quadratic formula. However, when students are
doing real problem solving, working on unfamiliar problems out o f context, such behaviour is not always observed. Trying to differentiate a problem from an exercise, Schoenfeld (2013) proposes that complexity or difficulty alone does not make a task a problem; solving a system o f 100 linear equations in 100 unknowns without the use o f technology might be a real challenge, but it is not a problem in the sense that one knows how to go about getting an answer, even if it might take a very long time and one struggles over the calculations.
The research conducted by Arcavi & Friedlander (2007) indicates that an exercise where rules have to be applied is not a problem. The participants in their research were asked to explain the kind of tasks that are not problems. Their responses were recorded and some o f their replies are presented below:
• ‘‘W hat is not a problem is an exercise, and an exercise is the application o f a rule.’’
• ‘‘Exercises and straightforward word problems.’ ’
• ‘‘It all depends on who is the solver.’’
• ‘‘There are plenty o f activities that are not problem solving for example, defining and
enhancing the meaning o f concepts (for example, identifying and classifying different meanings o f subtraction), formulating and explaining i d e a s . ”
(Arcavi & Friedlander, 2007, p.358)
From the definitions and views o f previous researchers above, there seems to be a general agreement
that exercises are not problems. It is also clear that the phrase problem solving is ambiguous. Hence,
for the purpose o f this study I was guided by the definitions above in the setting o f the algebraic tasks that will be solved by the participants. I considered the “wide-scope tasks” as referred to by Arcavi & Friedlander (2007, p. 361) instead o f the “small-sized riddles” . Stanic and Kilpatrick (1989, p. 20) view that ‘‘problem solving is for everyone’’ but since the participants in this study are the learners that usually do well in Mathematics, “problems for the advanced students” (as referred to by Stanic and Kilpatrick, 1989, p. 20) were considered. An example o f such problems is shown below:
Out o f 721 airport maintenance workers, 257 go to work by car, 210 by bike, and 176 by either car or bike. Thirty senior workers should have reserved parking places. The parking
lot has 360 parking places. One parking place can accommodate a car or 8 bikes. Plan the workers’ parking lot: Decide how many places should be allotted to cars, and how many to bikes. Describe your thinking.
(Arcavi & Friedlander, 2007, p. 361)
2.3.3 W hy a problem -solving ap p ro ach is used in School M athem atics
It is argued that inquiry-oriented mathematics instruction, which includes problem-solving and problem-posing tasks and activities, can assist students to develop approaches that are more creative.
Namibia is a knowledge-based society. According to the Namibian Curriculum for Basic Education, “a knowledge-based society is one where knowledge is created, transformed, and used for innovation to improve the quality o f life” (p.2). Thus, through The Namibian Basic Education curriculum, learners should develop the competencies, attitudes and values needed for full participation in society by learning to use, acquire, construct, evaluate and transform knowledge. Teahen (2015) echoes that competence in mathematics is important for students to enable them to be successful participants in society. It is important for students to relate what they are learning in class to what they may do in their lives in the real world so that the learning is real and has meaning (Teahen, 2015). This is an important factor for learning to be transferred to long-term memory, a crucial step if knowledge and concepts are to be retained (Sousa, 2008).
As Cobb et al. (1991) suggested, the purpose o f engaging in problem solving is not just to solve specific problems, but to “encourage the internalization and reorganization o f the involved schemes as a result o f the activity” (p.187). Moreover, not only does the problem solving approach develop students' confidence in their own ability to think mathematically (Schifter & Fosnot, 1993), it is also a vehicle for students to construct, evaluate and refine their own theories about mathematics and the theories o f others (NCTM, 1989).
Resnick (1989) expresses the belief that “school should focus its efforts on preparing people to be good adaptive learners, so that they can perform effectively when situations are unpredictable and tasks demand change” (p.18). Cockcroft (1982) also advocated problem solving as a means of developing mathematical thinking as a tool for daily living. He states that problem solving ability lies
“at the heart o f mathematics” (p.73) because it is the means by which mathematics can be applied to a variety o f unfamiliar situations. The National Council o f Teachers o f Mathematics (NCTM, 1980) recommended also that problem solving be the focus o f mathematics teaching because it involves skills and functions that are an important part o f everyday life. They furthermore stated that it could help people to adapt to changes and unexpected problems in their careers and other aspects o f their lives. These recommendations were endorsed by the Council (NCTM, 1989) with the statement that problem solving should underlie all aspects o f mathematics teaching in order to give students experience o f the power o f mathematics in the world around them.
In addition, one o f the aims o f teaching through problem solving is to encourage students to refine and build on their own processes over a period o f time as their experiences allow them to remove some ideas and become aware o f further possibilities (Carpenter, 1989). Carpenter (1989) further indicates that through problem solving, students are developing knowledge and an understanding o f when it is appropriate to use particular strategies. Thus, through using a problem solving approach in schools, the emphasis is on making the students more responsible for their own learning rather than letting them feel that the algorithms they use are the inventions o f some external and unknown 'expert'. There