University of Arkansas, Fayetteville
ScholarWorks@UARK
School Choice Demonstration Project Education Reform
8-1-2016
Squeezing the Public School Districts: The Fiscal
Effect of Eliminating the Louisiana Scholarship
Program on State Education Expenditures
Corey A. DeAngelis
University of Arkansas, Fayetteville
Julie R. Trivitt
University of Arkansas, Fayetteville
Follow this and additional works at:https://scholarworks.uark.edu/scdp
Part of theEducation Policy Commons,Public Policy Commons, and theSocial Policy Commons
This Article is brought to you for free and open access by the Education Reform at ScholarWorks@UARK. It has been accepted for inclusion in School Choice Demonstration Project by an authorized administrator of ScholarWorks@UARK. For more information, please [email protected], [email protected].
Recommended Citation
DeAngelis, Corey A. and Trivitt, Julie R., "Squeezing the Public School Districts: The Fiscal Effect of Eliminating the Louisiana Scholarship Program on State Education Expenditures" (2016).School Choice Demonstration Project. 20.
WORKING PAPER SERIES
Squeezing the Public School Districts: The Fiscal Effects of Eliminating the
Louisiana Scholarship Program
Corey A. DeAngelis, and Julie R. Trivitt, Ph.D.
August 11, 2016
EDRE Working Paper 2016-10
The University of Arkansas, Department of Education Reform (EDRE) working paper series is intended to widely disseminate and make easily accessible the results of EDRE faculty and students’ latest findings. The Working Papers in this series have not undergone peer review or been edited by the
University of Arkansas. The working papers are widely available, to encourage discussion and input from the research community before publication in a formal, peer reviewed journal. Unless otherwise indicated, working papers can be cited without permission of the author so long as the source is clearly referred to as an EDRE working paper.
1
SQUEEZING THE PUBLIC SCHOOL DISTRICTS: THE FISCAL EFFECTS OF ELIMINATING THE LOUISIANA SCHOLARSHIP PROGRAM
Corey A. DeAngelis Department of Education Reform,
University of Arkansas [email protected] Julie R. Trivitt, Ph.D. Walton College of Business,
University of Arkansas [email protected]
Louisiana Scholarship Program Evaluation Report #6 August 11, 2016
School Choice Demonstration Project, University of Arkansas, Fayetteville, AR
Acknowledgements
The content of the report is solely the responsibility of the authors and does not necessarily represent the views of the University of Arkansas. We gratefully acknowledge Patrick J. Wolf and Robert M. Costrell for helpful comments on previous drafts.
2
Executive Summary
Eliminating the Louisiana Scholarship Program (LSP) was proposed as a way to improve the financial situation of the Louisiana Department of Education budget in the current fiscal
environment. A study released by the School Choice Demonstration Project (SCDP) found that the net fiscal impact on the Louisiana Department of Education budget would likely be an overall cost increase. In this study, we consider the effects that the removal or reduction of the program would have on individual districts. Districts would receive additional revenue from the state for affected students, but districts would also incur additional costs to educate these
students. For each district, we compare the additional costs incurred to the additional funding received from the state. We conclude that the overall fiscal impact on districts will be negative; in other words, the overall additional variable costs incurred by the districts will be greater than the overall additional funding provided to the districts. In fact, we find that only 2 to 7 of the 69 school districts would benefit from the elimination of the program. For the affected districts, the average outcome would be a financial loss of about $1,500 per returning voucher student in 2016. In each scenario, we find that over 80% of student transfers would result in a financial loss for the local district. While we have framed this discussion in terms of the elimination of the LSP, the same analysis would be applicable to any situation that causes students to move from private schools to public schools in Louisiana, including the current funding cap which may force some current LSP students out of the program and has already generated a waitlist of over 400 students for next year.
3 Introduction
As is expected with any program involving appropriations and ardent supporters on both sides of the issue, there has been much debate over the merits of the Louisiana Scholarship Program (LSP) since its inception. Prior research by the School Choice Demonstration Project indicates that the LSP had a negative effect on student math achievement in the first two years (Mills & Wolf, 2016) and a positive effect on racial integration in schools (Egalite, Mills, & Wolf, 2016). There is also evidence of positive effects of the program on the performance of public schools in Louisiana attributed to the additional competition (Egalite, 2016). In the current fiscal
environment, policy makers considered ending the program as a way to improve the financial situation of the Louisiana Department of Education budget. Ultimately, they decided to reduce funding for the program below the level necessary to support all continuing students and new students awarded scholarship placements through the 2016 LSP lottery. At least some students who expected to attend private schools for the 2016-17 school year will likely be educated in public schools instead. This study determines if this policy change saves money for individual public school districts in Louisiana or strains their finances even more.
The LSP, originally named the Student Scholarships for Education Excellence Program, started in 2008 as a pilot program and expanded statewide in 2012. The LSP is a K-12 voucher program that gives low-income students the choice to opt out of their low-performing traditional public school. Students that qualify for the program can take a portion of their public per pupil funding to a participating private school of their choice. In order to qualify for the voucher, students must have attended a public school rated C, D, F or T in the previous year or be
4
assigned to such a school and entering kindergarten.1 Additionally, their family income must be no more than 250% of the federal poverty line2 ($60,625 for a family of four in 2015-16). In this
sense, the program is more accessible than the federal lunch program which requires family income to be no more than 185% of the federal poverty line ($44,863 for a family of four in 2015-16).
In 2015-16, there were 7,110 students enrolled in the program and the average voucher was $5,852 (56% of the average public per pupil expenditure).3 The voucher amount is set at
100% of the per-pupil funding level in the student’s home parish or the tuition level at the chosen private school, whichever is less.4 The participating private schools must accept the voucher amount as full payment to educate the child.
Since private school tuition levels are often set below the Minimum Foundation Program (MFP) per pupil allocation amount, the program has the potential to generate an overall cost savings to the public. Jeff Spalding (2014) found that the forerunner to the LSP, which was limited to New Orleans, saved the state $12.7 million by the 2010-11 school year. SCDP just released their analysis on the fiscal impact of the proposed removal of the LSP. They find that unless one in five current voucher students stay in private schools without aid, the state will face additional expenditures of up to $10.1 million per year without the program (Trivitt &
DeAngelis, 2016). 1https://www.louisianabelieves.com/schools/louisiana-scholarship-program 2https://aspe.hhs.gov/2015-poverty-guidelines 3http://www.edchoice.org/school-choice/programs/louisiana-scholarship-program/ 4http://www.edchoice.org/school-choice/programs/louisiana-scholarship-program/
5
Though the state may experience a financial loss overall, the impact on the individual districts5 is not necessarily negative. After all, the negative impact on the state results from the
state providing more funding to public districts via the funding formula than to private schools via the voucher program. If the program is removed, some of the current voucher students will return to various districts throughout Louisiana. If the additional costs incurred by the district to educate the returning voucher students is less than the additional funding provided by the state, the district will experience a financial benefit. Alternatively, if the district incurs additional costs greater than the additional funding, the districts will face a financial loss. Over time, we would expect local districts to adjust their spending to optimally educate all students with the resources available.
Cost Specification Strategy
Economists and accountants frequently classify production costs based on how they fluctuate with small changes in the number of units of production. For small changes in the size of the organization, also referred to as the short run, costs can be divided into two categories: variable and fixed. Variable costs (VC) differ from fixed costs (FC) in that they fluctuate proportionally with the number of units produced.
𝑇𝑜𝑡𝑎𝑙 𝐶𝑜𝑠𝑡𝑠 = 𝐹𝐶 + 𝑉𝐶
If we think about schools using production terminology, the unit of production is the student and the output is the increase in human capital, i.e. the knowledge and skills that come from an additional year of schooling. As the number of students in a school district increases, the district incurs additional costs. In the short run, only some of the costs will vary with a small change in
6
the number of students, and are thus classified as variable costs. Some examples of variable education costs would be instructional materials, student support, and food service. Other costs will remain fixed for small changes in the number of students and are classified as fixed costs. Some examples of fixed education costs are buildings, busses, administration, and maintenance. In other words, if there is an influx of a limited number of students into a school district,
expenses such as instruction and food service would increase, but we would not expect the acquisition of additional buildings or busses.
In the long run (or for substantial changes in the number of students), all costs are
variable; expenditures on all categories of resources may change. For example, if a large number of students are introduced into a school system, costs directly tied to the education of the
additional students would rise (e.g. instruction and food service). If the number of students entering a given school system is large enough, capital expenditures and transportation expenses would rise, so additional classrooms, buildings, and busses would be needed to accommodate the new students.
While districts will incur additional costs when enrollment increases, they will also receive additional funding from the state in most cases. If the additional funding equals the additional costs incurred, there is no fiscal effect on the district. If the costs exceed the additional funding, the district is worse off and has to adjust their spending patterns or spend money from a reserve account to accommodate the additional student. If the costs are less than the additional funding, the district is better off financially and can continue current operations and add to their financial reserves.
7
We analyze the fiscal effects on districts likely to receive additional students if the program is eliminated or scaled back due to the recent funding reduction. We use data from the 2013-14 Current Expenditures by Group report6 from the LDE website and classify each
expenditure category as variable or fixed. We use the classification approach employed by Benjamin Scafidi (2012) in his fiscal analysis of school choice programs. Scafidi studied the actual cuts made by public school districts when faced with sudden, unexpected funding reductions. This should accurately reflect costs that schools can adjust in the short run because the exemplar districts actually did so. Any costs not observed to change are classified as fixed. This makes our estimate of the total variable costs conservative for all districts, and therefore increases the likelihood we will find districts that benefit financially from the costs incurred and funding associated with one or more additional students due to funding constraints on the LSP.
The following are the types of expenditures we classify as fixed for our analysis: Debt Service, Facility Acquisition and Construction, Community Service Operations, Central Services, Student Transportation Services, Operations and Maintenance, Business Services, General Administration, and School Administration. The following are the types of expenditures we classify as variable: Regular Education, Special Education, Vocational Education, Adult Education, Other Instructional Programs, Special Programs, Pupil Support Programs, Instructional Staff Services, Food Service Operations, and Enterprise Operations.
The cost structure of districts varies considerably across the state. Fixed expenses vary from 26.1% to 62.6% of total expenses with a mean of 34.8%. Likewise, variable expenses range from 37.4% to 73.9% with a mean of 65.2%. The way costs are allocated between fixed
6 We use data from the most recent year (2014) that information is available for expenditures, revenues and voucher enrollment: http://www.louisianabelieves.com/resources/library/fiscal-data
8
and variable categories reflects, to some degree, strategic resource allocation choices the district has made. In general, the larger the percentage of variable costs, the more flexibility the district will have in adjusting to changes in enrollment or funding, but the more likely it is that small changes in enrollment will require adjustments to its resource use patterns because incremental funding for one student will be less than the incremental costs.
Additional Variable Costs to Districts
Throughout our analysis, we assume that districts are operating efficiently, so that current expenditures represent the costs necessary to adequately educate students.7 We begin our analysis by classifying each district’s current expenditures as either fixed or variable. We find the total variable costs for each school district and divide by the student enrollment. This gives us a unique cost equation for each district of the form:
𝑻𝒐𝒕𝒂𝒍 𝑪𝒐𝒔𝒕𝒔 = 𝑭𝑪 + (𝑨𝑽𝑪 ∗ 𝑵𝒖𝒎𝒃𝒆𝒓 𝒐𝒇 𝑺𝒕𝒖𝒅𝒆𝒏𝒕𝒔)
We assume a linear cost curve near the current enrollment level so that the marginal cost, or additional cost incurred if the district has one additional student, is the average variable cost (AVC) based on the district’s current expenditures. If the district revenue increases by more than the AVC, the district has more than enough additional funding to cover the costs of educating an additional student. If the additional funding provided for the extra student is less than AVC, the district has to adjust its expenditure patterns to educate the additional student. Table 1 below
7This assumption is made for simplicity. Expenditures may be above actual costs, but the results will still be
9
shows a summary of the average variable costs for all districts, districts without any voucher users, and districts with voucher users.
Table 1: Average Variable Costs by Group
Group AVC AVC % Maximum Minimum
All Districts $7,844 65.1% 73.9% 37.4%
Districts without Voucher Users $7,652 65.9% 73.9% 38.1%
Districts with Voucher Users $7,928 64.8% 72.5% 37.4%
Cost structures are unique for each district and average variable costs differ considerably. When we examine all districts, the average variable cost is $7,844. The average variable cost is $7,652 for districts without any voucher students and $7,928 for districts with current voucher students. In other words, districts with voucher users tend to have higher variable costs than districts without voucher users and are therefore likely to experience larger fiscal effects from the transfer of students from the LSP back to district public schools. For individual districts’ variable costs range from 37% to 74% of total costs. But costs are only one side of the potential fiscal effect of the program. In order to determine how each district is likely to be affected, we need to compare the average variable cost to the funding a district would receive with one additional student.
Additional Revenue from the State Funding Formula
In order to determine the fiscal effect on the district we need to compare the additional costs incurred to the additional funding received due to various possible changes in the LSP. To calculate the additional funding for each district, we use data from the Fiscal Year 2013-14
10
Minimum Foundation Program budget letter which includes four different levels8 of funding calculations.
Level 1 funding uses a weighted student count for each school district and establishes a base minimum amount of funding per student. Students likely to require additional resources to educate are weighted to reflect the additional resources needed, and funding is based on the weighted student count which is greater than the actual number of students enrolled. Additional weight is assigned to students that are classified as: Low-Income / English Language Learner, Career and Technical Education, Special Education, and Gifted and Talented. Districts with less than 7,500 students receive additional weighting of up to 20% since they may not be large enough to fully benefit from economies of scale. The Level 1 funding provided by the state varies across districts based on the local district’s ability to generate revenue via taxes, but the state contributes at least 25% of the total amount of Level 1 funding.
Level 2 funding rewards local tax effort since the state matches a portion of the local tax revenue above the minimum amount. The calculation for the Level 2 funding amount is a function of the Level 1 funding requirement and the amount of local revenue provided to schools. Level 2 funding is included in our analysis since returning students would alter the Level 1 funding amount, but would not alter the local tax revenue generated.
Level 3 funding is related to continuation pay raises, hold harmless enhancements, mandated health insurance, retirement and fuel. Level 4 funding is related to foreign language associate salaries, career development, high costs services assistance and supplemental courses.
8 Here are the exact funding level formulas used for calculation: https://www.louisianabelieves.com/docs/default-source/minimum-foundation-program/2015-16-circular-no-1158---senate-concurrent-resolution-55.pdf?sfvrsn=2
11
We exclude Level 3 and Level 4 funding from our analysis since they are not likely to vary in the short-run with small changes in student enrollment.
Funding Estimate Methods
We examine Level 1 and Level 2 funding and simulate the additional amount of funding each district would receive from the state for an additional student. In our calculations we assume that the returning voucher student(s) have the same characteristics as the average student in the district to which they return. We compare each district’s average variable cost to its additional funding per pupil in order to determine whether the fiscal position of the district is harmed or helped in the absence, or reduction, of the LSP.
Analysis for Assumption Parish
In order to understand the marginal cost and marginal revenue calculations, it is helpful to examine the analysis of an example district. The Assumption Parish reported total education expenditures of $45,182,646 in 2014. Of these, $15,702,398 are classified as fixed costs and $29,480,248 are classified as variable costs. We divide the variable costs by the number of students in order to find the average variable cost for the district. In the Assumption Parish, the average variable cost was $7,649 in 2014 which leads to the following cost equation:
𝑻𝒐𝒕𝒂𝒍 𝑪𝒐𝒔𝒕𝒔 = 𝑭𝑪 + (𝑨𝑽𝑪 ∗ 𝑵𝒖𝒎𝒃𝒆𝒓 𝒐𝒇 𝑺𝒕𝒖𝒅𝒆𝒏𝒕𝒔) $𝟒𝟓, 𝟏𝟖𝟐, 𝟔𝟒𝟔 = $𝟏𝟓, 𝟕𝟎𝟐, 𝟑𝟗𝟖 + ($𝟕, 𝟔𝟒𝟗 ∗ 𝟑, 𝟖𝟓𝟒9)
9 This student count comes from October 2013 and is the basis for the Expenditure Report for the 2013-2014 school year.
12
This suggests the Assumption school district has $15.7M in fixed costs and spends $7,649 for each additional student with its current expenditure patterns. This should hold for small changes in the number of students. This expenditure pattern was estimated from expenditures from the 2013-2014 fiscal year and we assume it also holds for 2014-2015.
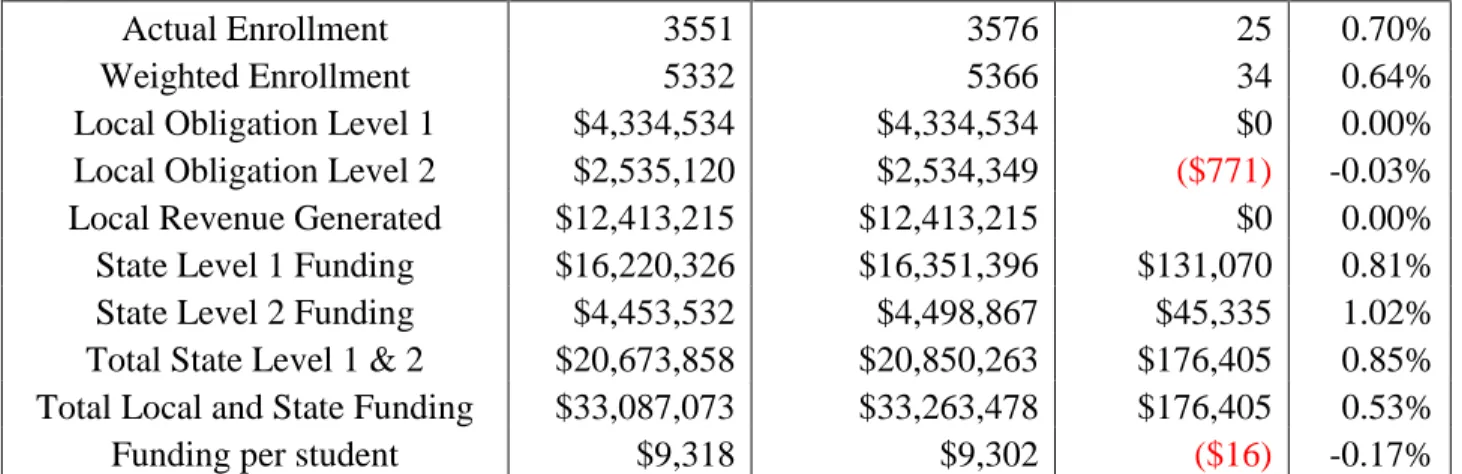
Marginal revenue can be calculated as the change in total additional state funding divided by the change in the number of students. To make this calculation we assume that all voucher students enrolled in 2014 return to their residentially assigned public schools. Assumption had 3,551 students in 2014 and can expect up to 25 additional students to return based on 2014 voucher enrollment. Assumption had 2,382 Low-Income/English Language Learner students, 1,685 Career and Technical Education students, 485 Special Education students and 90 Gifted and Talented students in 2014. Before the economy of scale adjustment, the weighted pupil count is calculated as follows:
𝟒, 𝟗𝟓𝟖 = 355110+ 2382(22%) + 1685(6%) + 485(150%) + 90(60%)
The average student in this district has a student weight of 1.4 (4,958/3,551), so we will use this weight for each of the 25 returning voucher students. The economy of scale add-on students are calculated as:
𝟑𝟕𝟒 = 3551 ∗ (7500 − 3551 37,500 )
Therefore, the total weighted students when the LSP is fully funded is 5,332. The Level 1 funding is 5,332 times the per pupil amount of $3,855, or $20,554,860. The state share of this funding is the total amount minus the local share. The local share is determined by local
13
property and sales tax revenue which does not change when students move from private to public schools. In Assumption Parish, this amount is $4,334,534. Therefore, the state share with the LSP in place is $16,220,326.
In the absence of the program, the total weighted student count increases by the 25 additional students weighted at 1.4 each. The total weighted students would be the number of actual students (3,576) times the average weight of each student in the district (1.4) plus the economy of scale add-on, or 5,366 total weighted students. Therefore, Level 1 funding would be $20,685,930 and the state share of this would be $16,351,396. The additional state funding for Level 1 absent the program would be $131,070 for 25 students; or $5,243 per pupil.
Level 2 funding is calculated based on the eligible local revenue, which is the total local revenue beyond the Level 1 local cost allocation or 34% of the total Level 1 revenues, whichever is less. In the Assumption Parish it is 34% of total Level 1 funding. With the LSP, total Level 1 funding is $20,554,860 and the local eligible revenue (34% of total) is $6,988,652. The local share of Level 2 funding is calculated as the local eligible revenue multiplied by local share of Level 1 times an established multiplier of 1.72, or:
$𝟐, 𝟓𝟑𝟓, 𝟏𝟐𝟎 = $6,988,652 ∗ 21.09% ∗ 1.72
The state share of Level 2 funding would be the difference between the eligible local revenue and the local share, or $4,453,532. In the absence of the program, total Level 1 funding is $20,685,930 and the local eligible revenue (34% of total) is $7,033,216. The local share would be calculated as:
14
The state share of Level 2 funding would then be $4,498,867, or $45,335 higher than it is with the LSP. That is an additional $1,813 per pupil. Therefore, the total additional revenue per pupil from Level 1 and Level 2 combined would be $7,056. This is $593 less than the average
variable cost per pupil in Assumption of $7,649, so the district would face a financial loss of $593 per returning voucher student for each of the 25 student returning for a total of about $14,820. In other words, the Assumption Parish would need to fund the additional $593 per student by allocating supplementary local revenue or be forced to operate on lower per pupil expenditures.
Table 2: Assumption Parish as an example
LSP Baseline LSP Eliminated Difference
% change
Actual Enrollment 3551 3576 25 0.70%
Weighted Enrollment 5332 5366 34 0.64%
Local Obligation Level 1 $4,334,534 $4,334,534 $0 0.00% Local Obligation Level 2 $2,535,120 $2,534,349 ($771) -0.03% Local Revenue Generated $12,413,215 $12,413,215 $0 0.00% State Level 1 Funding $16,220,326 $16,351,396 $131,070 0.81% State Level 2 Funding $4,453,532 $4,498,867 $45,335 1.02% Total State Level 1 & 2 $20,673,858 $20,850,263 $176,405 0.85% Total Local and State Funding $33,087,073 $33,263,478 $176,405 0.53%
Funding per student $9,318 $9,302 ($16) -0.17%
Projected Increase in Funding
Total Eliminated - Total Baseline $176,405
Projected increase in costs
25 new students * $7649 variable costs per student $191,225
Difference ($14,820)
This district currently has funding of $9318 per student with the LSP program in place. If the LSP is eliminated the district has to educate 25 additional students and only receives $176,405 of
15
additional funding, which is $7056 per added student. Since the funding attributable to the new students ($7056) is lower than the current per pupil spending ($9318) it effectively reduces the per-pupil funding for the entire district.
Multiple Funding Scenarios
For the LSP elimination scenario, we use three different methods in order to calculate the additional funding per pupil. Our first method is based on the additional revenue each district would receive if all of the currently enrolled voucher students returned to local districts.11 In our
second method, we calculate the additional revenue a district would receive based on the funding amount if 91% of the students returned to their local districts. Our third method calculates the additional revenue a district would receive based on the funding amount if only one voucher student returned. The additional state funding per student may not be the same under each method due to the nonlinear nature of the funding formula.
In addition, we assume that the funding reduction for the program enacted this summer will force between 120 and 560 LSP students to return to or remain in their district public schools. We expect the distribution of these “forced attriters” to reflect the previous distribution of program users by district, so that districts with more LSP participants in 2015-16 would experience proportionately more forced attriters and districts with fewer LSP participants would experience proportionately fewer of them.
Projected Effects of Program Elimination
Most districts are unaffected since they do not have any current voucher users. Of the districts likely to see additional students if the LSP were eliminated, many are harmed and a few would
11 2014 enrollment found here: https://www.louisianabelieves.com/docs/default-source/school-choice/2012-2013-la-scholarship-enrollment-counts.pdf?sfvrsn=8
16
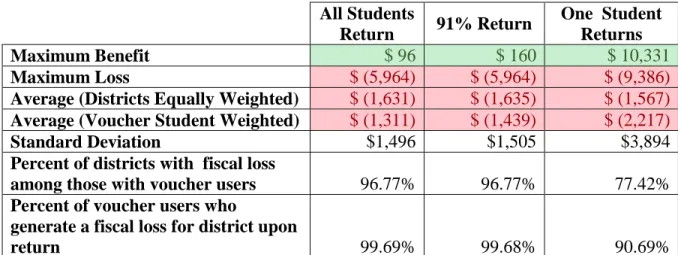
benefit financially. We provide overall summary statistics of the distribution of benefits and losses across the 31 districts that have voucher students in the tables below. Table 3 provides per-pupil summary statistics for the district with the largest benefit, the largest loss, and the average district. We report the average of all of the affected districts weighted equally and by the number of currently enrolled voucher students. Summary statistics with additional funding calculated by all voucher students returning are presented in column 1 of Table 3. This model may be fairly accurate for predicting funding changes since the majority of voucher students would likely return to their residentially assigned public school. It is unlikely that all students would return. Mills and Wolf (2016) found that 9 percent of the students who did not win the scholarship through a lottery still attended private school. Since our analysis examines students that are currently enrolled in a voucher-accepting school, we expect that at least 9 percent of current LSP students will also remain in private schools without the program.
Table 3: District Per-Pupil Summary Statistics by Method
All Students Return 91% Return One Student Returns Maximum Benefit $ 96 $ 160 $ 10,331 Maximum Loss $ (5,964) $ (5,964) $ (9,386)
Average (Districts Equally Weighted) $ (1,631) $ (1,635) $ (1,567)
Average (Voucher Student Weighted) $ (1,311) $ (1,439) $ (2,217)
Standard Deviation $1,496 $1,505 $3,894
Percent of districts with fiscal loss
among those with voucher users 96.77% 96.77% 77.42%
Percent of voucher users who
generate a fiscal loss for district upon
17
Column 1 shows summary statistics for the distribution of net effect per student among districts with current voucher users. The maximum benefit is negligible, at $96 per student. On average, the net loss is over $1,300 per pupil. These are per-pupil amounts, but districts vary widely in their number of expected returning voucher users; in 2014, districts with students qualified for vouchers had between 10 and 2,893 students using vouchers.
Column 2 presents results with funding based on 91% of the voucher students returning to their public districts and column 3 presents results with funding based on a single voucher student returning to the district. The most consistent results are found in the second column, for the model based on 91% of the voucher students returning to their public school. Overall, this model produces results that are similar to those found by the first model. The maximum benefit for a district is $160 and the maximum loss is over $5,900 per pupil.
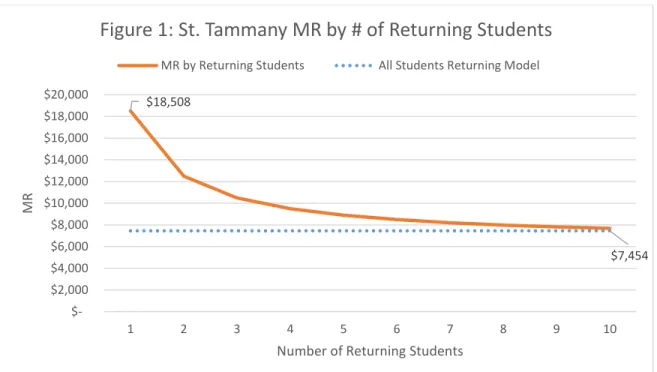
With a standard deviation of about $3,900, the results in the third column are the least precise. The funding amount for the first student is sensitive to the non-linear nature of some segments of the state funding formula. The maximum benefit for a district is much larger in magnitude here, about $10,300 in funding above additional variable costs. This is an extreme outlier. This particular district is St. Tammany, which would receive around $18,500 additional revenue for the next student. However, the average additional revenue per student if all 87 voucher students return to this district is only around $7,500. Due to the nonlinearity of the additional funding in districts such as these, and the assumption that most voucher students will return to their public school district, we should feel more comfortable with the results based on the first two methods. Figure 1 below shows the marginal revenue trend for St. Tammany Parish based on the number of expected returning students. As illustrated below, the marginal revenue
18
per student approaches the base model amount ($7,454) as the number of expected returning students increases.
In Table 3, with only one additional student in each district, the maximum loss is slightly larger in magnitude than the base model, with average variable costs about $9,400 larger than the additional revenue per student. The average affected district would face a similar financial loss of around $1,600 - $2,200 per returning student, depending on the method used for weighting districts.
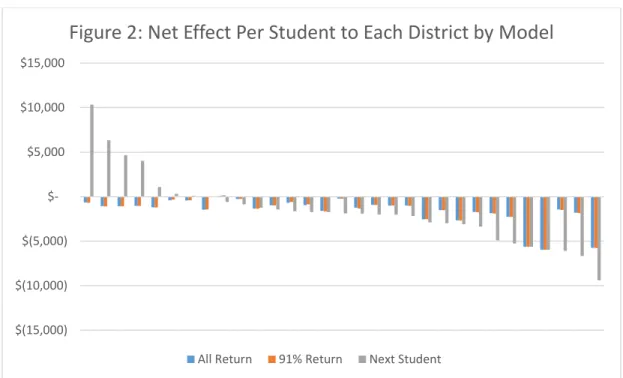
Next, we examine the distribution of per-pupil impacts for the affected districts. Figure 2 below shows the net effect to each district based on the four simulation methods used.
$18,508 $7,454 $2,000 $4,000 $6,000 $8,000 $10,000 $12,000 $14,000 $16,000 $18,000 $20,000 1 2 3 4 5 6 7 8 9 10 MR
Number of Returning Students
Figure 1: St. Tammany MR by # of Returning Students
19
Figure 2 shows that most of the 31 affected districts will experience cost increases that exceed additional funding in all models due to the return of former LSP students to the public schools. The model that calculates revenues based on the next student has a much larger variance in results than the other two and tends to generate more extreme values. The model based on the average of all students returning has much smaller variance since it estimates the average additional revenue based on all students returning. Table 3 above shows the number of districts that would be financially better or worse off with the elimination of the program.
The majority (38) of the districts will be unaffected by the elimination of the program. Out of the affected districts, a vast majority will experience additional variable costs that exceed the additional funding from the state. Depending on the statistical method employed, between 1 and 7 of the affected districts will benefit financially, while between 21 and 30 of the affected districts will face additional costs greater than additional funding per student. Even in the best-case scenario, which relies on only one student returning to every district, less than a quarter of
$(15,000) $(10,000) $(5,000) $5,000 $10,000 $15,000
Figure 2: Net Effect Per Student to Each District by Model
20
the affected districts will benefit financially. In the scenario based on the reduction of the LSP, less than a third of the affected districts benefit financially.
Though we have examined the overall effect for each district, it is also beneficial to observe the benefit or loss created by each individual student. Table 3 shows that a considerable majority of returning voucher students would create a financial loss to their district. In every model simulating an elimination of the LSP, over 90% of voucher students would generate additional costs that exceed additional funding received. In the model based on a 200 student reduction in the LSP, about 4 of every 5 returning students would create financial losses for their public school districts.
Waitlist Students
At the beginning of the 2016-2017 school year, 442 students from 34 different parishes who have already accepted voucher awards for the program have been put on a waitlist due to budget cuts. If we assume the average voucher amount has increased to $5,900 this year, the state avoids paying $2.61 million by avoiding the cost of these vouchers. Assuming the students cannot attend the private school without the LSP, this keeps 442 students enrolled in district schools rather than private schools and increases the state’s share of Level 1 and Level 2 funding by about $3.22 million based on the district-specific funding obligations. Louisiana is paying $3.22 million in additional Level 1 and 2 funding to avoid paying $2.61 million in voucher expenses, which is a net increase in state overall education expenditures of more than $600,000. Based on historical program attrition rates, if all the students on the waitlist remain on the waitlist, the number of voucher users this year will be about 560 lower than last year. If LSP funding is increased so that all waitlist students receive vouchers, the number of voucher users would still
21
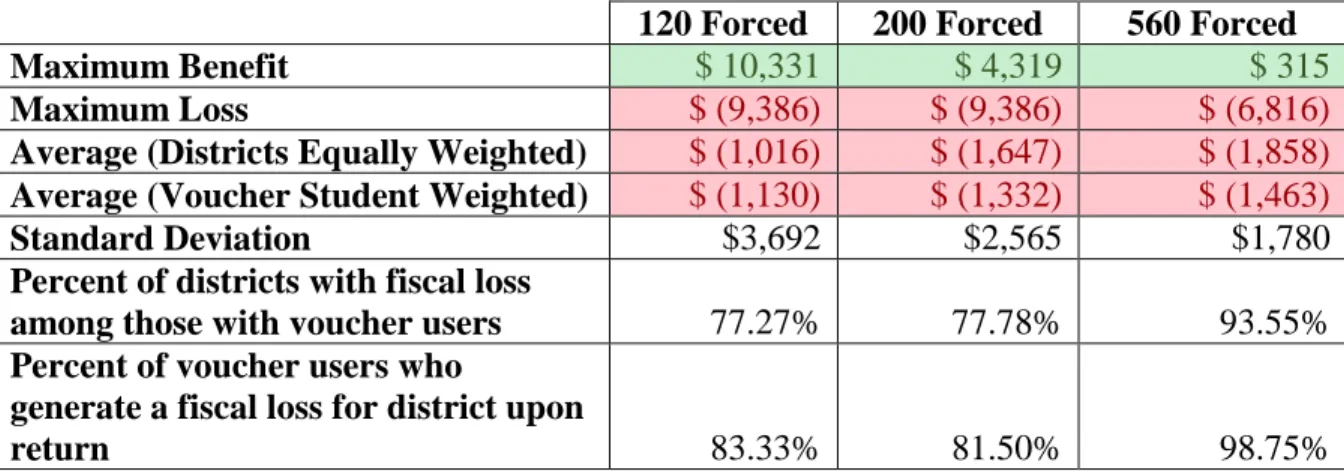
be about 120 smaller than last year. Table 4 provides some descriptive statistics for the district effects assuming the number of voucher users is 120, 200, and 560 students smaller than last year.
The results based on the forced reduction of the LSP due to funding cuts, found in table 4, are similar to those of the models based on the elimination of the program. If all students on the wait list return to their local district, the average outcome for affected districts would be a financial loss of about $1,450 - $1,850 per student. If none of the students on the wait list need to return to their local districts and the number of students in the program only decreases by 120, the average outcome for the affected districts would be a loss of about $1,000 per student. In all scenarios, over 80% of student transfers would result in a financial loss for the local district.
Table 4: District Per-Pupil Summary Statistics by Magnitude of Reduction
120 Forced 200 Forced 560 Forced
Maximum Benefit $ 10,331 $ 4,319 $ 315
Maximum Loss $ (9,386) $ (9,386) $ (6,816)
Average (Districts Equally Weighted) $ (1,016) $ (1,647) $ (1,858)
Average (Voucher Student Weighted) $ (1,130) $ (1,332) $ (1,463)
Standard Deviation $3,692 $2,565 $1,780
Percent of districts with fiscal loss
among those with voucher users 77.27% 77.78% 93.55%
Percent of voucher users who
generate a fiscal loss for district upon
return 83.33% 81.50% 98.75%
Timing of Student Counts
It should be noted that all of the analysis done so far assumes state funding for districts is adjusted instantaneously as the number of students enrolled in a school changes. In most states, school funding formulas are based on student enrollment counts from the previous year, which
22
allows districts to budget with some level of certainty as to funding available. This also creates a delay between when the student enrollment count changes and when the school funding amount adjusts. For a mature voucher program where the number of students transferring into and out of the program are roughly equivalent each year, this simultaneity assumption is a harmless simplification since it calculates the annual effect once the funding formula has adjusted. When the number of students in the program is changing, this simplifying assumption causes the short run fiscal effects to be less accurate. In Louisiana, the funding for the first half of the academic year is based on student counts from February of the previous school year, and October student counts are used to calculate funding for the second half of the academic year. When the number of LSP users is expanding, the state effectively provides funding for new voucher users to the public schools for half a year after the student has stopped attending. When the program is expanding local districts are unlikely to feel the financial pinch. Conversely, if students transfer from private to public schools when the LSP funding is reduced, and it takes a few months for the additional students to generate additional funding for the public schools, the local districts are likely to suffer financially since they bear the cost of educating the students without additional funding for a few months. When we consider the timing of funding adjustments, the state is reducing expenditures in the short run by restricting the number of voucher students via budget cuts. The voucher cost is avoided immediately, but the additional public school student does not trigger additional state funding until the second half of the fiscal year. In this regard, the state is reducing expenditures by about $1,000,000 for this academic year by increasing the number of students in public schools where funding does not change until the second half of the fiscal year.
23
Tables 5 shows the effect on state education expenditures for the waitlisted students and the difference between the delayed and immediate changes in funding obligations. This table shows that savings to the state as a result of funding cuts are due to the timing of when students are counted rather than any actual cost efficiencies.
Table 5: Effect of Waitlist on State Expenditures per Voucher Student Immediate Funding Update Delayed Funding Update Maximum Benefit $ 941 $ 3,421
Maximum Loss or Minimum Benefit $ (3,800) $ 1,050
Average (District Weighted) $ (1,050) $ 2,425
Average (Student Weighted) $ (1,380) $ 2,260
The cost savings to the state results from districts educating students for half of the year before the additional funding generated by that student arrives. For the fiscal year that districts have returning voucher students, all districts are financially worse off. Table 6 shows the projected effect on the 34 districts with students currently on the waitlist.
Discussion
Using publicly provided data and the state funding formula, our results indicate that, for most districts, the costs associated with educating additional students returning from the LSP will
Table 6: Effect of Waitlist on Districts
Immediate Funding Update
Delayed Funding Update Maximum Benefit (Minimum Loss) $1,506 ($3,183)
Maximum Loss ($5,454) ($8,253)
Average (district weighted) ($1,203) ($4,678)
24
exceed the additional funding provided to the districts by the state. We only consider additional state funding on the assumption that local funding is unchanged as the local economy is
unaffected when a student transfers from a private to a public school. Thirty-eight of the districts are not likely to be affected and between 1 and 7 are expected to benefit from the policy change.
However, 21-30 of the 31 affected districts will encounter a financial loss, and significant losses incurred by particular districts may cause concern. In particular, a few districts will face costs exceeding additional funding by more than $5,000 for each returning voucher student. These districts may have to adjust the combination of resources used in their schools. These same districts may also be most able to adjust their spending accordingly since they currently have higher variable costs and lower fixed costs. There are four districts where the number of voucher students exceeds 3% of total enrollment. Particularly, the 2014 voucher enrollment for the Orleans Parish accounts for over a fifth of its total public school enrollment. Using our current methods, we find a financial loss for each of these large voucher enrollment districts from the return of former LSP students. Since LSP students represent a substantial share of total enrollment, the assumption that fixed costs are unchanged may not be appropriate for these districts.
The motivation of this study comes from the recent legislative session where eliminating the LSP was considered as a potential cost saving option and the final resolution involved a program spending cut likely to result in around 120 to 560 LSP students forced to return to or remain in their district schools. While we have framed the discussion in these terms, the analysis would be applicable to any scenario where students leave private schools to attend public schools while the local tax base is unaffected. It is also worth noting that these are district-level
25
averages. It is possible that individual schools within a district are not identical, so we cannot conclude that every school within a particular district will experience the same result. The school-level outcomes will vary within each district based on the cost structure and excess capacity of each school.
For this analysis we have assumed the parameters in the state funding formula are unchanged in the absence of the LSP. Given that previous research (Trivitt and DeAngelis, 2016) showed that eliminating the program is likely to require additional state funding under the current formula, it is possible that the state would change the formula. In the Level 1
calculations, the current required mills of 17.76% can be increased in order to keep the education expenses shared with the state providing 65% and local districts providing 35% of funding. In Level 2 calculations, the local district is currently expected to provide 1.72 times the local percent of Level 1 funding. The Louisiana Department of Education can increase this factor annually to keep the total Level 2 funding equal from year to year. If either of these parameters is altered as a result of increased student enrollment stemming from former voucher students returning to local districts, then every district in the state would be affected, even those with no
voucher eligible students. Adjustments to these parameters could result in a funding formula
that provides less state funding per student to districts that have no current voucher users.
Districts with exclusively high performing schools would be well advised to recognize they should not ignore the program, even if none of their students qualify for the vouchers.
26 References
Egalite, A. J. (2016). The Competitive Effects of the Louisiana Scholarship Program on Public School Performance. Available at SSRN 2739783.
Egalite, A. J., Mills, J. N., & Wolf, P. J. (2016). The Impact of the Louisiana Scholarship Program on Racial Segregation in Louisiana Schools. SSRN Electronic Journal SSRN Journal.
Mills, J. N., & Wolf, P. J. (2016). The Effects of the Louisiana Scholarship Program on Student Achievement after Two Years. Available at SSRN 2738805.
Spalding, J. (2014). The school voucher audit: Do publicly funded private school choice programs save money. Friedman Foundation for Educational Choice, September, 30.
Scafidi, B. (2012). The Fiscal Effects of School Choice Programs on Public School Districts. National Research. Friedman Foundation for Educational Choice.
Trivitt, J. R., & DeAngelis, C. (2016). The Fiscal Effect of Eliminating the Louisiana Scholarship Program on State Education Expenditures.
27
About the Authors
Corey A. DeAngelis is a Distinguished Doctoral Fellow and Ph.D. student in Education Policy at the University of Arkansas in Fayetteville. His research focuses on the effects of school choice programs on student achievement and non-academic outcomes. He additionally holds a Bachelor of Business Administration and a Master of Arts in Economics from the University of Texas at San Antonio.
Julie R. Trivitt is a Clinical Assistant Professor in the Department of Economics at the University of Arkansas in Fayetteville. Her research focuses on teacher effectiveness, non-cognitive measures of abilities in academic achievements, and the evaluation of school choice programs. She received her Ph.D. in Economics from the University of Arkansas in 2006.
About the SCDP
Housed within the Department of Education Reform at the University of Arkansas, the School Choice Demonstration Project (SCDP) is an education research center dedicated to the
nonpartisan study of the effects of school choice policy. Led by Dr. Patrick J. Wolf, the SCDP’s national team of researchers, institutional research partners and staff are devoted to the rigorous evaluation of school choice programs and other school improvement efforts across the country. The SCDP is committed to raising and advancing the public’s understanding of the strengths and limitations of school choice policies and programs by conducting comprehensive research on what happens to students, families, schools and communities when more parents are allowed to choose their child’s school. Reports from past SCDP studies are available at