DigitalCommons@University of Nebraska - Lincoln
DigitalCommons@University of Nebraska - Lincoln
Journal of the National Collegiate HonorsCouncil --Online Archive National Collegiate Honors Council
Spring 2017
Moving Beyond GPA: Alternative Measures of Success and
Moving Beyond GPA: Alternative Measures of Success and
Predictive Factors in Honors Programs
Predictive Factors in Honors Programs
Tom MouldElon University, [email protected] Stephen B. DeLoach
Elon University, [email protected]
Follow this and additional works at: https://digitalcommons.unl.edu/nchcjournal
Part of the Curriculum and Instruction Commons, Educational Methods Commons, Higher Education Commons, Higher Education Administration Commons, and the Liberal Studies Commons
Mould, Tom and DeLoach, Stephen B., "Moving Beyond GPA: Alternative Measures of Success and
Predictive Factors in Honors Programs" (2017). Journal of the National Collegiate Honors Council --Online Archive. 552.
https://digitalcommons.unl.edu/nchcjournal/552
This Article is brought to you for free and open access by the National Collegiate Honors Council at
DigitalCommons@University of Nebraska - Lincoln. It has been accepted for inclusion in Journal of the National Collegiate Honors Council --Online Archive by an authorized administrator of DigitalCommons@University of Nebraska - Lincoln.
Alternative Measures of Success and
Predictive Factors in Honors Programs
Tom Mould and Stephen B . DeLoach
Elon University
introduction
W
hile studies of predictive factors for success in honors have been increas-ingly creative and expansive on what these factors might include, they have rarely challenged the dominant, virtually monolithic definitions of suc-cess . The majority of studies measure sucsuc-cess either by collegiate grade point averages (GPAs) or retention rates in honors, which are often contingent on collegiate GPA . For years scholars have been calling for a more nuanced and robust definition of success, yet few have taken up the charge, presumably because such data are not readily available . GPAs and retention rates are easy to access and quantify . Tracking and quantifying other successes are more difficult but potentially invaluable in helping to better match students and programs .In the present study, we consider success according to a range of factors: national, local, and campus-wide academic awards; membership in honor societies; presentations at regional, national, or international academic con-ferences; peer-reviewed academic publications; graduate school attendance; job placements at the time of graduation; leadership roles in extracurricu-lar activities; and faculty mentor assessment . This work suggests that while standardized tests may be marginally useful for making initial invitations to honors programs, high school GPA (HSGPA) is more useful for distin-guishing success among high-achieving students . Further, HSGPA is at least somewhat predictive not just of collegiate GPA but also of program retention, success in the major, high-quality research, positive mentor evaluation, likeli-hood of invitation and admittance to national honors societies, and receiving awards . However, caution must be taken in using HSGPA to predict success in honors programs . The data indicate that the vast majority of the determi-nants of collegiate success result from factors that have yet to be measured by honors directors .
predictivefactors ofsuccess Among College Applicants
One of the most vexing questions for admissions offices at colleges and universities around the country is determining the most effective predictive factors of collegiate success . The relevance of standardized tests has come under particular scrutiny in the past few decades, most notably because of concerns that such tests are biased against underserved populations (see for example Banerji; Linn, Greenwood, and Beatty) . Such concerns have prompted some Ivy League schools to become test-optional, no longer requiring standardized test scores to be considered for admission . The ques-tion of the effectiveness of standardized tests is complicated by variables such as student demographics that include gender, ethnicity, and academic ability; selectivity of the university; and criteria for measuring success, e .g ., first-year collegiate GPA, overall GPA, and graduation rates .
Despite the general skepticism about standardized tests, some of the most extensive studies suggest that standardized tests remain at least margin-ally effective as predictors of collegiate success . In a study of over one million students, Hezlett et al . found in 2001 that the SAT was a valid predictor of first-year GPA (cited by Green and Kimbrough 56) . These results mirror previous studies that suggest that HSGPA and standardized tests provide moderate
prediction of college GPA (CGPA) and retention (Anastasi; Daugherty and Lane; DeBerard, Spielmans, and Julak; Galicki and McEwen; Wolfe and Johnson) . In a study of approximately 34,000 students from thirty col-leges across the country, “The SAT was found to be as good as or better than HSGPA in predicting high levels of college success” (Kobrin and Michel 6) . However, the authors note important caveats when interpreting the results of their study . For example, HSGPA was more predictive of success in the least selective schools and more predictive of unsuccessful students than the SAT . Most significant for the current study was the finding that “at the highest FGPA (first year CGPA) level (3 .75 or higher), neither the SAT nor HSGPA was able to predict successful students” (Kobrin and Michel 6) .
Correlations for general collegiate populations may not, as Kobrin and Michel have shown, be relevant to the kinds of high-achieving students whom honors programs typically seek to attract . Roufagalas revealed similar dis-crepancies between the general incoming student class and honors students, finding that while SAT scores were useful for the former, HSGPA was a more accurate predictor for the latter . Smith and Zagursky came to the same conclu-sion: “Our findings demonstrated that most variables used in typical higher education admissions protocols did not accurately predict retention in the Schedler Honors College at UCA” (55) . One explanation for the discrepancy between predictors for the general population and for honors lies in the fact that many honors programs and colleges draw their students from a popula-tion already screened and selected by their university-wide admissions office; if that office is using standardized tests to whittle the initial pool of candidates, then by default so is the honors program . Attending to studies specific to honors student populations promises to be more useful than those address-ing the entire college-bound population, but they may still be hampered by initial university-wide procedures that complicate but do not render moot the central question for honors directors: how do we ensure high quality and success in our programs without missing those initially underachieving but high-potential students whose creativity and curiosity are so valuable? Among Honors Students
One of the early studies of predictors of success in honors programs was Roufagalas’s analysis of admissions data for the 1990 incoming class at Radford University class . His study aimed to predict college performance in students’ first two years (1993) . Roufagalas considered a range of admissions data, finding that HSGPA was effective in predicting CGPA and that class
rank was effective in predicting enrollment in honors courses, but he found no appreciable correlation with standardized tests (31) . Khe as well as Green and Kimbrough also found no significant correlation between standardized test scores and collegiate CGPA, but while Khe also found no significant correlation between HSGPA and CGPA, Marriner did . Like Roufagalas, in Marriner’s case study of 235 honors students at a large public university, he found that the SAT was a “weak, sometimes nonsignificant predictor of first-year GPA” (102) but found a positive correlation between HSGPA and first-year collegiate GPA (FGPA) . Smith and Zagurski found a similar correlation between HSGPA and FGPA as well as between HSGPA and pro-gram retention . Khe came up entirely empty-handed in his study, finding no significant correlations at all, while Green and Kimbrough found a positive correlation between high school class rank and CGPA .
While HSGPA and class rank show some promise in predicting success in honors programs, the bulk of these case studies appear to suggest that standardized tests are uniformly unhelpful in predicting success in honors programs, at least in terms of CGPA and program enrollment and retention . However, as early as 1979, McDonald and Gawkowski found a moderate correlation between SAT verbal and math scores with success in the Mar-quette University Honors Program in addition to a correlation with HSGPA although the authors note that only the math portion of the SAT was found to be practically predictive . In 1987 at Kent State University, Craig found a cor-relation between ACT English scores and graded essay scores in the first-year honors colloquium (cited in Andrews 24) .
Despite the wide variability of findings, the popular perception seems to remain that HSGPA is a fairly effective predictor of collegiate GPA and hon-ors retention rates while standardized tests like the SAT and ACT are far less reliable . Andrews is hardly alone when he notes that “High school GPA may seem the most reliable predictor of academic success based on some research studies, and even on anecdotal evidence” (24) . Two of the largest studies of predictive factors of honors program success make some progress in navigat-ing these results, suggestnavigat-ing that the assumptions so often made about the effectiveness of HSGPA and the ineffectiveness of standardized tests may be somewhat accurate, along with other factors less frequently examined . In a study of a large public university, McKay confirms the utility of the HSGPA and the unreliability of standardized tests for predicting honors success in his large-scale study of 1,017 students at the University of North Florida . In terms of retention rates, Campbell and Fuqua’s study of a large public university
found that HSGPA, class rank, and gender were the most effective predictors of honors success in addition to collegiate factors such as first-semester GPA and honors housing status . Standardized tests scores and AP or CLEP credit hours were not effective predictors, nor were race, socioeconomic status, or high school size . Accordingly, a broad-brush approach to decoding these stud-ies would suggest that HSGPA is useful and standardized test scores less so .
In 2013, however, Jerry Herron sounded a warning that studies and pre-dictors at one university may not hold for others . For Herron, adding ACT scores to HSGPA proved a reliable formula for predicting success in his hon-ors program at Wayne State University . He does not explain what “success” entails, but he is clear that the formula is specific to his honors program and should not be expected to predict success in other honors programs with different missions, goals, and expectations . He also notes that “the same admissions standards will not be sufficient for all constituents” even at his own university (21) . Allen also found variation within his university, where gender and major affected the predictive qualities of standardized test scores, with predictive significance for men more than women, and some majors but not others (cited in McKay 78) .
Optimists might continue to hold out hope for the HSGPA as useful for any honors program while pessimists might consider the only effective formula to be one created for their own program with demonstrable results specific to their school . Either way, Herron’s warning calls into question a one-size-fits-all approach to predictors of success . The rationale seems solid . No one assumes that all honors programs are the same, so we should not assume that the factors at one school can predict success at another .
While such logic makes sense if we are measuring success differently in our programs, the truth is that we are not . Despite the great variety in the structures, intended outcomes, expectations, criteria, and characteristics of honors programs and colleges around the country, we have an oddly anemic means for measuring success .
redefiningsuccess
The problem, then, is that while honors directors have been eager to iden-tify strategies to help recruit the best students for our honors programs, we have rarely stepped back to consider the criteria by which we determine stu-dent success . The industry standard has been collegiate GPA and program participation and retention, outcomes that are easily available and easily
quantifiable for comparative analysis . Of these two criteria, collegiate GPA (CGPA), in particular first-year GPA (FGPA), is used most often (Stoller; see also Khe) . Roufagalas, Khe, McKay, and Green and Kimbrough use both CGPA and enrollment and retention rates to define success . Accordingly, success in honor programs is reduced to grades and participation, hardly a nuanced or rigorous system of assessment .
When scholars have paused to note that such criteria for measuring suc-cess are woefully anemic, it is most often as a coda to encourage future study or as an ideal impossible to quantify . Stoller notes that, in terms of mission, many honors programs have far more complex views of success than GPA, including tangible and quantifiable criteria such as publications in refereed journals, participation in research, study abroad, and service to the campus and wider community as well as less tangible criteria that include dedication to active learning, creativity, intellectual curiosity, talent for self-expression, leadership, engagement with others, and integrative learning (82) . Employ-ing systematic criteria to assess these qualities durEmploy-ing the admission process or conducting research to search for correlations between evidence of past accomplishments and future success, however, remains elusive . Stoller admits that the solution at Penn State University is to “do everything possible to ‘read the tea leaves’ in our applications for evidence of research or creative poten-tial” (84), an admission that likely rings true for many of us who have been in the position of trying to build our class of incoming honor students . Others have suggested similarly robust lists even if they have nonetheless relied on more traditional measures . Green and Kimbrough offer a list of measurable outcomes of a program’s success that includes “retention rates, graduation rates, cum laude status at graduation, quality of theses, involvement in honors activities, and subjective ratings by its participants” (56), but ultimately they chose to focus solely on first-year GPA, explaining that “we needed to insure that students could get through the first year before those other outcome vari-ables became relevant” (56) .
The same caveats many have made about the importance of attending to the distinctive qualities of honors programs in terms of admission standards are relevant when discussing what success looks like in those programs . When Larry Andrews implores us to consider the specific culture of the honors pro-gram in terms of how we select students, he implies that the same is true for how programs define success . Jerry Herron is even more explicit: “Each pro-gram has its own types of excellence” (19), concluding that one-size-fits-all admissions policies are not viable (21) .
If programs are distinct, with goals and outcomes specific to the program, then developing relevant definitions of success and effective admissions processes and policies might logically begin with a program’s mission state-ment, a record of what anthropologists would define as “ideal culture,” distinguishable from the “real” or embodied and enacted culture of behavior and practice . One might also take a more inductive approach and assess the “real culture” of the honors program, as Smith and Zagursky did when they conducted focus groups with current students to determine a list of charac-teristics that indicated a good “fit” with the program, a process that helped improve their admissions process but, again, only in terms of the two most traditional measures of success: collegiate GPA and program retention (56, 59) . In assessment lingo, we must “close the loop” by applying these goals and expectations to our assessment of student success .
Heeding the call to arms that many honors directors have made for admissions processes that consider the distinct characteristics of honors pro-grams, this study provides yet one more example of conflicting results that may do as much to problematize as resolve the enduring question of general-izable predictability of honors success . However, it also takes up a challenge, laid implicitly if rarely explicitly, to consider more robust, program-specific definitions of success to create admissions strategies . Specifically, this study considers data from high school transcripts typically available from admis-sions offices and compares it to a wide range of measures of student success by the time of graduation .
Accordingly, this study makes three distinct contributions to the honors literature on admissions . First, it provides an example for how honors pro-grams can move beyond GPA and enrollment and retention as the dominant measures of honors success . Second, it provides a robust analysis of predic-tive factors for success in honors programs that moves beyond the current literature . Third, it provides a strategy for how to create admission processes catered to specific programs, responding to the long-issued warning that no single formula for admission to honors colleges and programs can ensure stu-dent success .
methods
Methods of Data Collection
In order to develop measures of success specific to the goals of the Elon University Honors Program, we began with our mission statement . While
many of these ideals were difficult to assess, the last two bulleted items pro-vided some guidance .
The Honors Program seeks to:
• Help Honors Fellows expand their minds by encountering new ideas
in small, discussion-based and innovative liberal arts and sciences courses
• Improve students’ critical thinking, research and communication
skills
• Provide an intellectual community in and extending beyond the
class-room walls
• Challenge and support Honors Fellows in the highest possible
aca-demic achievements, culminating in an independent thesis
• Prepare students to excel in graduate or professional pursuits as
inde-pendent, hard-working, open-minded, lifelong learners and honorable community members .
Further, in an effort to make this study meaningful to a larger audience and to consider as many measures of success for which we could feasibly gather data, we have expanded our categories of success to include many of those mentioned in previous studies as well as those our program has tra-ditionally considered markers of a successful student scholar . Accordingly, while we consider collegiate GPA as other studies have done, we are more interested in alternative measures of success that include the following:
• National, local, and campus-wide academic awards • Membership in honor societies
• Presentations at national or regional academic conferences • Peer-reviewed academic publications
• Graduate school attendance
• Job placements at the time of graduation • Leadership roles in extracurricular activities • Faculty mentor assessment
Ideally we would have complete and extensive data on post-collegiate performance, including job attainment, career development, and job satisfac-tion . However, such alumni data are notoriously difficult to attain although social media sites such as LinkedIn provide opportunities to gather at least some additional data for those programs with the staff and time to go search-ing . Quantifysearch-ing and qualifysearch-ing such data also pose problems . What does a successful career look like? Some may measure success according to salary, others to position title, others to subjective assessments of happiness and sat-isfaction . Such measures can serve as future ideals, but for our study, we are considering post-college plans as self-reported by students at the time of grad-uation . Although a few students heeded our call to update this information as job offers and graduate school acceptances rolled in, these data are admittedly incomplete . Finally, we have considered the subjective ratings from students’ research mentors . These faculty mentors work closely with their honors men-tees over the course of one and a half to three years and are in a position to get to know their abilities and accomplishments extremely well . While the ratings are inherently biased, they translate to real-world applications in terms of nominations for awards, for example, and letters of recommendation .
Our process for gathering these data required coordination from mul-tiple offices around campus as well as direct data gathering from faculty and students . For the comparative high school data, including GPA and standard-ized test scores, we received spreadsheets from our admissions office from the incoming classes 2003–2012 (graduating classes 2007–2016) . We received overall GPAs for all graduating honors students from the office of the reg-istrar . For achievements while at Elon, e .g ., awards, membership in honor societies, presentations, and publications, we drew on lists of achievements compiled by previous honors directors for 2007–2013 and a more detailed, comprehensive spreadsheet of student-reported achievements from 2014– 2016 . Finally, for subjective assessments of student success, we asked each student’s research mentor to evaluate the student in the context of all gradu-ating seniors in their departments over the past seven years . Faculty mentors who had worked with honors students for one and a half to two years were asked to score their mentees in one of the following categories: Top 1%, Top 5%, Top 10%, Top 25%, Top 50%, or Bottom 50% .
Methods for Data Analysis
The central question of our analysis concerns the extent to which admis-sions data, e .g ., high school transcripts, standardized test scores, admisadmis-sions
essays, and interview scores, are capable of predicting success throughout the honors program . That is,
(1) Successi = f(HSi, Scoresi, Personali) + ei
where HSi is a vector of the individual’s performance in high school . These measures include high school GPA, weighted GPA, number of honors, IB and AP courses taken, high school advisor’s subjective assessment of the stu-dent’s difficulty of curriculum, and competitiveness of the high school, i .e ., percentage of students who go to college . The weighted GPA is a calcula-tion done by the Elon Admissions office based on the student’s GPA in core academic courses, weighted for honors, AP, IB, and dual enrollment . The core subject areas included in the WGPA include English, Math, Language, History, and Science . Weights are assigned as follows: honors=1 additional point; pre-IB=1 additional point; AP courses=2 additional points; IB=2 addi-tional points; and dual enrollment=2 addiaddi-tional points . The weighting system applies to students who receive a grade of C or higher in academic courses . Scoresi is a vector of standardized test scores including SAT/ACT math, SAT/ ACT verbal, and SAT/ACT composite . Personali denotes a vector of individ-ual characteristics, including ethnicity, gender, and major .
As noted above, we analyze a number of different measures of success . These include CGPA; the thesis mentor’s subjective rating of the student relative to other graduates in the same major; completion of the program (attrition); admission to graduate school; accepting a job upon graduation; receiving local or national awards, fellowships, or scholarships; and present-ing at conferences or publishpresent-ing research in peer-reviewed journals .
The common statistical method used in forecasting is multiple regression analysis . When the dependent variable (measure of success) is quantitative, the method of Ordinary Least Squares (OLS) provides unbiased, consis-tent, and efficient estimates of the effects of the covariates (right-hand-side variables) in equation 1 . However, most of our measures of success are not quantitative, but qualitative . Because they are ‘yes/no’ observations, OLS is no longer the most efficient method of obtaining regression coefficients . Instead, we use Probit regression . In the results that follow, we will report so-called marginal effects of Probit regression models so that the coefficients may be interpreted as changes in the probability, or likelihood, of success .
results
Measuring Success
Data were collected on cohorts graduating between 2007 and 2016 . A total of 405 students have been in the program during this sample period, and 292 of those have graduated . In addition to attrition, in some years a handful of lateral entrants were allowed into the program after the first year . Summary statistics of all success measures are provided in Table 1 .
As shown in Table 1, the attrition rate during this sample was 28% . Of all incoming students, only 21% were male, and only 9% were not non-Hispanic white U .S . citizens . The group included 26% who attended high school where over 85% of students went to college . They had a weighted high school core GPA of 4 .84 and a combined SAT (or ACT equivalent) math and verbal score of 1402 . Less than 10% were science majors . (Other majors were examined, but only science majors were found to differ significantly from other students in any of the empirical specifications .)
Summary outcome metrics of those completing the entire 4-year pro-gram are reported in Table 2 . As noted above, the commonly used metric for success in honors programs is the undergraduate GPA (UGGPA) or comple-tion of the program . The average UGGPA of those completing the program is high, as expected, at 3 .75 . However, as Stoller and Andrews have argued, honors programs need to go beyond UGGPA and retention in evaluating stu-dent achievement .
t
able1. a
dmissionsd
ataonm
atriculatings
tudents(f
all2003–f
all2012)
Variable Obs Mean Std Dev Min Max
Attrition 405 000 .28 00 .45 000 .00 001 .00 WGPA 405 004 .84 00 .34 003 .32 005 .46 SAT Math 405 691 .51 53 .15 570 .00 800 .00 SAT Verbal 405 710 .91 53 .03 550 .00 800 .00 Male 405 000 .21 00 .41 000 .00 001 .00 HS > 85% College 405 000 .26 00 .44 000 .00 001 .00 Diverse 405 000 .09 00 .28 000 .00 001 .00 Science Major 405 000 .09 00 .29 000 .00 001 .00
When asked to subjectively rate their honors mentees compared with all their students, thesis mentors rated 85% in the top ten percent . The num-bers also indicate a high level of achievement in other ways: 24% received at least one national award, grant, or fellowship; 47% received at least one local award, such as a department’s major of the year; and two-thirds were inducted into at least one national honors society . Only 1% had published in a peer-reviewed journal . For job and graduate school data, we have reliable information only from 2011 onwards; for these, 27% on average went straight to graduate school while 47% reported accepting a job .
Predicting Success
Next, we considered admissions data to attempt to predict which stu-dents will find success in the program . Table 3 summarizes the determinants of common measures of success found in the literature, including UGGPA and attrition . The first column summarizes the coefficients from the OLS regression of UGGPA on various high school transcript information . In the second column, we have reported the marginal effects (dy/dx), based on the Probit regression of the probability of attrition, of those same high school transcript data . These marginal effects are interpreted as how different char-acteristics change the probability of attrition for the average student in our program .
In general, very few of the high school transcript data predict success in college as commonly measured . UGGPA is significantly related to high school WGPA whereas SAT scores, gender, and attendance at a competitive high school are not . Science majors and non-white students graduate with
t
able2. o
utcomed
atafort
hosec
ompletinge
ntire4-y
earp
rogram(2007–2016)
Variable Obs Mean Std Dev Min Max
UGGPA 281 3 .748 0 .170 .003 .24 4 Top Ten Rating 280 0 .854 0 .354 0 1 National Award 299 0 .244 0 .430 0 1 Local Award 299 0 .468 0 .500 0 1 Journal Publication 299 0 .013 0 .115 0 1 Honors Society 299 0 .669 0 .471 0 1 Graduate School 199 0 .271 0 .446 0 1 Job 199 0 .472 0 .500 0 1
significantly lower UGGPAs, but the r-squared measure shows that at most about 10% of the variation in UGGPAs is accounted for by these attributes . In other words, 90% of the difference in collegiate performance is due to factors not captured in our model .
Predicting the likelihood of attrition is even more difficult . In column 3 we see that students with higher WGPAs are less likely to fail or transfer, as are science majors . For example, a student with a WGPA one standard deviation higher than the average in the program (0 .34 point higher WGPA) would have a 0 .07 (=0 .34* .222) lower probability of attrition than the average stu-dent . So while the average attrition is 28%, a stustu-dent with a WGPA of 0 .34 points higher coming out of high school has only a 21% chance of attrition . While this piece of data is helpful from a selection standpoint, again we must stress caution because only about 7% of the variation is accounted for by these factors . In other words, if we are using only WGPA and major to predict which students complete the program, we will be wrong nearly all of the time .
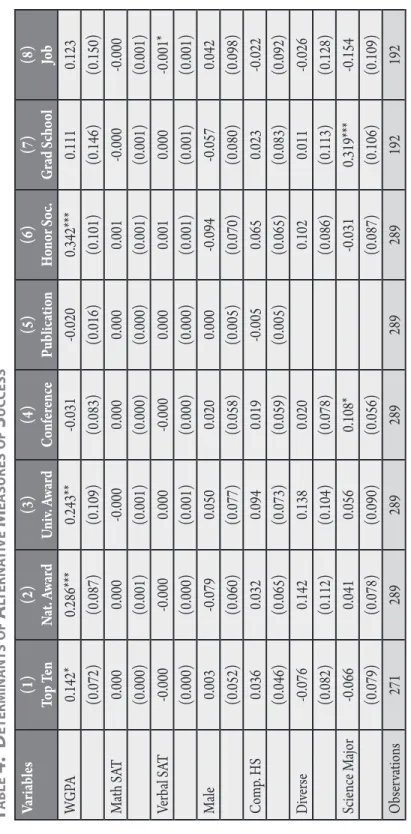
Because these common measures fail to capture all the goals of the program, we also estimate the potential determinants of alternative but
t
able3. d
eterminantsofc
ommons
uccessm
easuresVariables UGGPA P(failed) Marginal Effects
WGPA 0 .114*** (0 .035) -0 .222***(0 .069) Math SAT 0 .000 (0 .000) (0 .000)0 .000 Verbal SAT -0 .000 (0 .000) (0 .000)-0 .000 Male -0 .017 (0 .025) (0 .057)0 .055 Comp . HS 0 .017 (0 .024) (0 .051)-0 .032 Diverse -0 .083** (0 .036) (0 .078)-0 .041 Science Major -0 .115*** (0 .030) -0 .279***(0 .036) Constant 3 .241*** (0 .234) Observations 280 405 R-squared 0 .105 0 .067
important outcomes that are summarized in Table 4 . The only variable from high school transcripts that significantly predicts college success is weighted GPA (WGPA) although a science major has a 0 .319 higher probability of going straight to graduate school than non-science majors . Given that 27% of all students go to graduate school, there is nearly a 60% chance that a sci-ence major will go straight to graduate school . The probability of being rated in the top ten percent of majors is 0 .142 higher if the student has a WGPA 1 .00 higher on average; with 86% of all students being rated in the top 10% percent, a student with a one-standard deviation higher WGPA (0 .34) would have a 90% chance of being rated in the top ten percent of majors . The prob-abilities of winning awards or getting into a national honors society are also significantly higher if the student has a higher WGPA: 24% of all graduates earned national awards, and a student with a 0 .34 point higher WGPA had a 34% chance; the average graduate had a 47% chance of earning a university-level award, and a student with a 0 .34 point higher WGPA had a 55% chance . Finally, while the average student had a 67% chance of getting into national honors societies, a student with a 0 .34 point higher WGPA had a 79% chance .
Caution should again be taken when interpreting these results, however, since these models do a relatively poor job of predicting success . In each model, less than 10% of the variation in college success can be attributable to the characteristics that we can observe in the high school transcript . In other words, using these data from high school transcripts only successfully pre-dicts these outcomes between 2% and 7% of the time . The vast majority of the determinants of collegiate success appear to be factors unrelated to high school grades or standardized test scores, and this, in and of itself, is the most revealing result .
discussion
Overall, these results strongly suggest that the way we assess the quality of high school applicants to our honors program is limited in its ability to pre-dict many of the subsequent successes the program targets . Caution needs to be taken in overgeneralizing these data because we have data from only those students who matriculated into the program . We cannot say whether simi-lar students who were not in the honors program fared any better or worse than those in the program . What we can say is that, based on these data, stu-dents with similar weighted GPAs are equally likely to succeed, regardless of other factors such as ethnic diversity, major, or quality of high school . The only exception is the verbal SAT although this only appears to affect graduate
t
able4.
d
eterminant s ofa
lterna tivem
easures ofs
uc cess Var iab les (1) To p Te n (2) Na t. A wa rd (3) Univ . A wa rd (4) Co nf er en ce (5) Public atio n (6) Ho no r Soc. (7) Gr ad Sc hool (8) Job WGP A 0 .142* 0 .286*** 0 .243** -0 .031 -0 .020 0 .342*** 0 .111 0 .123 (0 .072) (0 .087) (0 .109) (0 .083) (0 .016) (0 .101) (0 .146) (0 .150) M ath SA T 0 .000 0 .000 -0 .000 0 .000 0 .000 0 .001 -0 .000 -0 .000 (0 .000) (0 .001) (0 .001) (0 .000) (0 .000) (0 .001) (0 .001) (0 .001) Ve rb al SA T -0 .000 -0 .000 0 .000 -0 .000 0 .000 0 .001 0 .000 -0 .001* (0 .000) (0 .000) (0 .001) (0 .000) (0 .000) (0 .001) (0 .001) (0 .001) M ale 0 .003 -0 .079 0 .050 0 .020 0 .000 -0 .094 -0 .057 0 .042 (0 .052) (0 .060) (0 .077) (0 .058) (0 .005) (0 .070) (0 .080) (0 .098) Comp . HS 0 .036 0 .032 0 .094 0 .019 -0 .005 0 .065 0 .023 -0 .022 (0 .046) (0 .065) (0 .073) (0 .059) (0 .005) (0 .065) (0 .083) (0 .092) Div er se -0 .076 0 .142 0 .138 0 .020 0 .102 0 .011 -0 .026 (0 .082) (0 .112) (0 .104) (0 .078) (0 .086) (0 .113) (0 .128) Sc ienc e M ajor -0 .066 0 .041 0 .056 0 .108* -0 .031 0 .319*** -0 .154 (0 .079) (0 .078) (0 .090) (0 .056) (0 .087) (0 .106) (0 .109) Obs er va tion s 271 289 289 289 289 289 192 192 tes: N um ber s a re m ar gin al eff ects, n ot P robit co efficien ts. *, **, a nd *** den ote si gn ific an ce a t th e 0.10, 0.05 a nd 0.01 lev el, r esp ect ive ly.school admissions and quite possibly results from the heavy reliance of gradu-ate schools on similar tests such as the GRE .
The results do have implications for how admissions to honors programs should work . First, given a pool of finalists among honors applicants, factors such as SATs or competitiveness of high school programs are invalid criteria in any kind of final ranking . The only factor that predicts any success is the weighted HSGPA, but it accounts for only a small portion of the variation in eventual college success . Heavy reliance on simple metrics like GPA is not supported by the data .
More interesting, however, is the question of what is missing . While simple metrics clearly do a poor job of predicting success, it is not clear what additional data might replace them . Possible candidates might include measures of such attributes as learning orientation or even personality charac-teristics such as “grit” although emerging scholarship in these areas suggests that tests of such traits may be equally unhelpful (e .g ., Credé, Tynan, and Harms; Duckworth, Peterson, Matthews, and Kelly), and such measures have the added problem of posing thorny ethical issues about how they could be implemented; collecting these data in ethical, scientifically valid, consistent, and reliable ways would be a major challenge .
conclusion Predictive Factors
At first glance, this study does not appear to have added any dramatic new insight into predictive factors for success in honors programs . The general consensus has been that HSGPA is the most reliable factor for predicting suc-cess even if the bar for “most reliable” is low . This study finds similar results . However, the results do suggest that slightly more effective than HSGPA is a weighted HSGPA that focuses on core subjects and gives credit for AP, hon-ors, and IB coursework .
More importantly, this study suggests that HSGPA is more useful than we have thought . More than just helping to predict CGPA, HSGPA also helped predict the likelihood of success in the major, success in undergradu-ate research, a positive rating by the research mentor, an invitation to join national honor societies, and attainment of national and international awards .
Because these factors explain only about ten percent of the variation we see among students accepted into honors programs, honors directors should feel somewhat freer in crafting their student cohorts . After narrowing the field
of applicants with an initial cut using both standardized tests and HSGPA, variation among students becomes razor thin . Liberating oneself from con-sidering differences of a tenth of a point between one candidate and another allows directors to consider other factors that might contribute to a healthy program . For example, many of the honors students at Elon University note in their assessment of the program that they wish there were more diversity of all types within their class, in particular gender (a majority of students are female), ethnicity (a majority are white), socioeconomic status (a major-ity are upper middle class) . The smallness of numeric differences argues for choosing the most invigorating mix of students possible .
Benefits of the Process
Other benefits of identifying program-specific measures of success and looking for predicting measures are the byproducts of the process . Clearly articulating the outcomes that an honors program hopes to achieve requires careful analysis of the explicit mission and goals of the program as well as implicit outcomes that may be embedded in the program’s curriculum, poli-cies, or structure . Engaging in such self-analysis can be eye-opening . For us, the process led to the clarification of unspoken goals of our program such as preparing students for continuing their research agendas in graduate school, through scholarship programs such as Fulbright, and in both government and private sectors . We also realized the premium we placed on building relation-ships between students and faculty research mentors .
Another byproduct of the process was the identification of data that we wanted in order to assess our students but that we were not currently gather-ing . On the front end of the process in terms of admissions, we realized that we were not analyzing the on-campus interview and essay scores as possible predictors of success . This realization came fairly recently so these factors were not part of the current study, but we will include them in future analy-ses . On the back end of the process in terms of graduation, we realized that faculty often talked about those students who really stood out, who were stars in their programs, but we had no way to capture these glowing evaluations . Further, as honors directors we found that when we talked about our most successful students, we often named the same students that faculty had iden-tified based on relationships to which we were not privy .
Finally, these new efforts to gather additional data for research resulted in our being able to articulate more clearly and specifically the outcomes for honors students at our university . As a result, we are now able to answer
questions from prospective students and their parents about the kinds of out-comes they might achieve .
In the end, we may still resort to doing everything possible to read the tea leaves, but we will be reading them with a clearer idea of the goals and outcomes to which we aspire .
references
Allen, Nelson E . 2002 . “Factors that predict HBCU honors students’ persis-tence and cumulative grade point average .” PhD, Morgan State University . Anastasi, Anne . 1963 . Psychological testing: New York, NY: Macmillan . Andrews, Larry . 2007 . “Grades, Scores, and Honors: A Numbers Game?”
Journal of the National Collegiate Honors Council—Online Archive: 41 . Banerji, Shilpa . 2006 . “George Mason’s SAT-Optional Admissions Policy
Could Boost Diversity .” Diverse Issues in Higher Education 23 (9): 12 . Campbell, K . Celeste, and Dale R . Fuqua . 2008 . “Factors Predictive of
Stu-dent Completion in a Collegiate Honors Program .” Journal of College Student Retention: Research, Theory & Practice 10 (2): 129–53 .
Craig, Deborah Sell . 1987 . “Predicting Success in an Honors Program: A Comparison of Multiple and Ridge Regression .” PhD, Kent State University .
Credé, Marcus, Michael C . Tynan, and Peter D . Harms . 2016 . Much Ado about Grit: A Meta-Analytic Synthesis of the Grit Literature . Journal of Personality and Social Psychology . Advanced online publication: <http:// dx .doi .org/10 .1037/pspp0000102>
Daugherty, Timothy K ., and Eric J . Lane . 1999 . “A Longitudinal Study of Academic and Social Predictors of College Attrition .” Social Behavior and Personality: An International Journal 27 (4): 355–61 .
DeBerard, M . Scott, Glen I . Spielmans, and Deana L . Julak . 2004 . “Predictors of Academic Achievement and Retention among College Freshmen: A Longitudinal Study .” College Student Journal 38 (1): 66–80 .
Duckworth, Angela L ., Christopher Peterson, Michael D . Matthews, and Dennis R . Kelly . 2007 . “Grit: Perseverance and Passion for Long-Term Goals .” Journal of Personality and Social Psychology 92 (6): 1087 .
Galicki, Sandra J ., and Marylu K . McEwen . 1989 . “The Relationship of Resi-dence to Retention of Black and White Undergraduate Students at a Predominantly White University .” Journal of College Student Development 30 (5): 389–94 .
Green, Raymond J ., and Sandy Kimbrough . 2008 . “Honors Admissions Cri-teria: How Important Are Standardized Tests?” Journal of the National Collegiate Honors Council—Online Archive: 69 .
Herron, Jerry . 2013 . “Notes toward an Excellent Marxist-Elitist Honors Admissions Policy .” Journal of the National Collegiate Honors Council 14 (2): 17–24 .
Hezlett, Sarah A ., Nathan R . Kuncel, M . A . Vey, A . M . Ahart, D . S . Ones, J . P . Campbell, and W . J . Camara . 2001 . “The Effectiveness of the SAT in Predicting Success Early and Late in College: A Comprehensive Meta-Analysis .” Annual Meeting of the National Council of Measurement in Education, Seattle, WA .
Khe, Sriram . 2007 . “The Irrelevance of SAT in Honors?” Journal of the National Collegiate Honors Council—Online Archive: 48 .
Kobrin, Jennifer L ., and Rochelle S . Michel . 2006 . “The SAT® as a Predic-tor of Different Levels of College Performance .” College Board Research Report No . 2006-3 .
Linn, Robert L ., M .R .C . Greenwood, and Alexandra Beatty . 1999 . Myths and Tradeoffs: The Role of Tests in Undergraduate Admissions . Washington, D .C .: National Academy Press .
Marriner, Nigel R . 2006 . “Above Average Ability, Creativity and Self-Efficacy as Predictors of Success for Honors Students .” PhD, Educational Leader-ship and Policy, State University of New York, Buffalo .
McDonald, Rita T ., and Roman S . Gawkoski . 1979 . “Predictive Value of SAT Scores and High School Achievement for Success in a College Honors Program .” Educational and Psychological Measurement 39 (2): 411–14 . McKay, Kyle . 2009 . “Predicting Retention in Honors Programs .” Journal of the
National Collegiate Honors Council 10 (1): 77–88 .
Roufagalas, John . 1993 . “Tracking Potential Honors Students .” National Hon-ors Report 14 (1): 25–31 .
Smith, Patricia Joanne, and John Thomas Vitus Zagurski . 2013 . “Improving Retention and Fit by Honing an Honors Admissions Model .” Journal of the National Collegiate Honors Council 14 (2): 55–71 .
Stoller, Richard . 2004 . “Honors Selection Processes: A Typology and Some Reflections .” Journal of the National Collegiate Honors Council 5 (1): 79–85 .
Wolfe, Raymond N ., and Scott D . Johnson . 1995 . “Personality as a Predictor of College Performance .” Educational and Psychological Measurement 55 (2): 177–85 .
________________________________________________________
The authors may be contacted at [email protected].