NBER WORKING PAPER SERIES EXECUTIVE PENSIONS Lucian A. Bebchuk Robert J. Jackson, Jr. Working Paper 11907 http://www.nber.org/papers/w11907
NATIONAL BUREAU OF ECONOMIC RESEARCH 1050 Massachusetts Avenue
Cambridge, MA 02138 December 2005
The views expressed herein are those of the author(s) and do not necessarily reflect the views of the National Bureau of Economic Research.
©2005 by Lucian Bebchuk and Robert J. Jackson. All rights reserved. Short sections of text, not to exceed two paragraphs, may be quoted without explicit permission provided that full credit, including © notice, is given to the source.
Executive Pensions
Lucian A. Bebchuk and Robert J. Jackson, Jr. NBER Working Paper No. 11907
December 2005
JEL No. D23, G32, G34, G38, J33, J44, K22, M14 ABSTRACT
Because public firms are not required to disclose the monetary value of pension plans in their executive pay disclosures, financial economists have generally analyzed executive pay using figures that do not include the value of such pension plans. This paper presents evidence that omitting the value of pension benefits significantly undermines the accuracy of existing estimates of executive pay, its variability, and its sensitivity to performance companies. Studying the pension arrangements of CEOs of S&P 500, we find that the CEOs' plans had a median actuarial value of $15 million; that the ratio of the executives' pension value to the executives' total compensation (including both equity and non-equity pay) during their service as CEO had a median value of 34%; and that including pension values increased the median percentage of the executives' total compensation composed of salary-like payments during and after their service as CEO from 15% to 39%.
Lucian A. Bebchuk Harvard Law School
1557 Massachusetts Avenue Cambridge, MA 02138 and NBER
[email protected] Robert J. Jackson, Jr.
Program on Corporate Governance 1545 Massachusetts Avenue Cambridge, MA 02138
Executive Pensions
Lucian A. Bebchuk and Robert J. Jackson, Jr. TABLE OF CONTENTS
I. INTRODUCTION... 1
II. THE NON-TRANSPARENCY OF PENSION PAY... 4
III. THE PUZZLE OF EEXECUTIVE PENSIONS...7
A. Tax Benefits...7
B. Reduction in Risk-Bearing Costs... 9
C. Aligning the Interests of Executives and Debt-holder... 9
D. Camouflage... 11
IV. Motivating Examples... 12
A. Pfizer’s $80 Million Pension Benefit... 12
B. UnitedHealth Group: Making CEO Retention More Difficult... 14
C. Black & Decker: The Significance of Pensions to Shareholder Value... 15
D. Leaving So Soon? High Pensions, Brief Tenure... 17
V. THE SIGNIFICANCE OF PENSIONS... 18
A. Sample... 18
B. Annual Pension Values... 20
C. Costs of Retirement Benefits: Actuarial Values of Pension Plans... 21
D. Relative Significance of Pension Values... 24
VI. PENSIONS AND THE LINK BETWEEN PAY AND PERFORMANCE... 29
A. Effect of Pensions on the Proportion of CEOs’ Salary-Like Payments... 29
B. Effect of Pensions on the Proportion of CEOs’ Non-Equity Compensation... 30
VII. POLICY IMPLICATIONS... 31
A. Investors’ Current Misperceptions... 31
B. Can Executive Pensions Become Transparent?... 33
I. INTRODUCTION
When Fannie Mae CEO Franklin Raines was pushed out in December 2004, he departed with a generous package of retirement benefits. Fannie Mae will pay Raines an annual pension of $1.4 million for the rest of his life and the life of his surviving spouse. The actuarial value of this pension benefit — the present value of the stream of payments Fannie Mae shareholders should expect to make over time — was about $24 million. This pension value constituted a significant component of Raines’s total compensation at Fannie Mae, and it substantially weakened the link between
Raines’s total pay and his performance.1 How common are pension plans, like this
one, that comprise a substantial fraction of an executive’s total pay? How important are such payments to a complete assessment of the executive compensation landscape? These are the questions that we investigate in this paper.
Existing disclosure rules significantly complicate these seemingly
straightforward questions because they do not require companies to place a
monetary value on the pensions to which executives are entitled.2 Pay Without
Performance, a recent book co-authored by Jesse Fried and one of us, suggests that firms use retirement benefits to provide executives with substantial amounts of “stealth compensation” — compensation not transparent to shareholders – that is
largely decoupled from performance.3 The “camouflage” role of retirement benefits
might, in part, explain their heavy use. Whatever explains the use of pension plans and other retirement benefits, assessing their magnitude and overall effects on the
1 For a detailed analysis of Raines’s retirement benefits, see Lucian Bebchuk & Jesse Fried, Executive Compensation at Fannie Mae:A Case Study of Perverse Incentives, Nonperformance Pay, and Camouflage (Working Paper Jan. 2005), at http://papers.ssrn.com/abstract=653125. 2 Although proxy rules require some disclosure of executive pension benefits, see Executive Compensation Disclosure, Securities Act Release No. 6962, 1992 Transfer Binder Fed. Sec. L. Rep. (CCH) paragraph 85,056, the rules do not require that issuers disclose the cost of these pensions to their shareholders. Because it can be difficult for investors to ascertain the value of these pension benefits from the firms’ limited disclosures, see infra text accompanying notes 10-13, shareholders are often unaware of the magnitude of these benefits.
3 LUCIAN BEBCHUK & JESSE FRIED, PAY WITHOUT PERFORMANCE: THE UNFULFILLED PROMISE
link between pay and performance is critical to obtaining a complete picture of the executive compensation landscape.
Investors currently lack such a picture. To be sure, the press has from time to
time described the pension arrangements of particular executives in detail.4 Recently,
for example, the media has discussed the pensions that Franklin Raines and Carly
Fiorina received after departing from their respective firms.5 But prior research,
media coverage, and existing datasets have not provided systematic evidence about the magnitude and variance of pension values — and their effects on the sensitivity of executive compensation to performance — in a representative sample of
companies.6
Standard datasets of executive pay generally include only those components of compensation for which a precise monetary value is disclosed in companies’ public filings. Estimating the value of pension benefits requires additional research
4See, e.g.,Michael Barbaro, A King’s Ransom in Retirement Benefits: GE Pays Ex-CEO Millions a Year in Pension, Perks, WASH. POST, Sept. 7, 2002, at E1 (detailing the significance of Jack Welch’s pension benefits); Daniel Kadlec, How to Get Paid: Stock Options Still Make Sense, But the Boss is Getting Other Goodies, TIME, Jan. 27, 2003, at A20 (describing “boosting pension benefits by giving credit” for additional service time as the “latest wrinkle in CEO pay”); Joanne S. Lublin, ITT Executives Get Severance – And Jobs, WALL ST. J., Feb. 15, 1998, at H1 (noting that $165 million was earmarked for executive severance and pension benefits in the event of a change of control); Gretchen Morgenson, Jackpot du Jour: It Pays to Quit, N.Y. TIMES, Oct. 31, 2004, at 1 (describing substantial executive pay in the form of pension, long-term incentive, and change-of-control arrangements); Evan Perez, Delta Holders Approve Plan on Executive Pension Accounts, WALL ST. J., Apr. 26, 2004, at B2.
5 See Geoffrey Colvin, Outraged over CEO Exit Packages? You’re Too Late, FORTUNE, Mar. 7, 2005, at 62 (criticizing Fiorina’s severance arrangements); David S. Hilzenrath, Fannie Mae Begins Paying Benefits to Former Executives, WASH. POST, Feb. 9, 2005, at E2; Jenny Wiggins, Fund Files Suit Over Fannie Mae Executive Pay-Offs, FIN. TIMES, Jan. 20, 2005, at 20; see also Eric Dash, The New Executive Bonanza: Retirement, N.Y. TIMES, April 3, 2005 § 3 (Magazine), at 1 (discussing, among other examples, the costs of generous pensions provided to the CEOs of Exxon Mobil, Pfizer, and UnitedHealth Group).
6 The only other attempt to study systematically executive pensions of which we are aware is in Rangarajan K. Sundaram and David L. Yermack, Pay Me Later: Inside Debt and Its Role in Managerial Compensation, Working Paper No. 05-08, New York University, May 2005. A main focus of the Sudaram-Yermack study is on the possibility that pensions serve the beneficial role of aligning the interests of executives with those of debtholders, an issue which we discuss in Part III below.
and financial analysis, and standard databases therefore do not include compensation paid through pension plans. This omission would not lead to significant distortions in analysis of executive pay if (i) pension plan values were not significant relative to total executive pay or (ii) pension plan values did not vary significantly among executives. In this paper, we examine whether these assumptions are valid — and, thus, whether the exclusion of pension values from analyses of executive compensation has undermined our understanding of the magnitude and nature of executive pay.
To do so, the paper provides evidence about the magnitude and variance of executives’ pension plan benefits. We study a sample composed of (1) CEOs of S&P 500 companies who left their position during 2003 and the first five months of 2004 and (2) current CEOs that are at or close to the retirement age at which they will become entitled to a full pension benefit. We find that pension plan values are on average quite substantial; that these values vary considerably among the executives in our sample; and that omitting them introduces significant inaccuracies in assessments of the magnitude and performance sensitivity of executive pay overall.
Events of recent years have increased the attention given to executive compensation by investors and the media, and it has been suggested that this additional scrutiny may provide a check on pay levels and ensure that executive
compensation is related to firm performance.7 As long as investors, researchers, and
the media do not have a complete and accurate picture of the magnitude and makeup of pay, however, their ability to evaluate pay arrangements will necessarily be limited. We seek in this paper both to highlight the inaccuracy of existing assessments and to make an empirical contribution to improving them.
Our findings indicate that the opaqueness of pension values leads to substantial distortions of the picture that investors have of the magnitude and
7 See, e.g., Fat Cats Turn to Low Fat: CEO Pay, THE ECONOMIST, Mar. 5, 2005 (noting “encouraging aspects” among results from a recent survey in CEO pay); Adrian Michaels, Off the Leash: What Will Bring Executive Pay Under Control?, FIN. TIMES, Aug. 24, 2004, at 15 (noting that most examples of excessive CEO pay come from the “pre-reform era”).
makeup of total pay. We therefore examine what additional disclosure requirements could enable investors to get a better picture of the role of pensions in executive compensation. Investors would obtain such a picture if firms were required to disclose annually (1) the monetary value of each executive’s pension entitlement and (2) the year-over-year increase in the value of this benefit based upon the executive’s additional service and any increases in the executive’s compensation. In addition, the effect of pensions on total pay would become more transparent if firms were to include the annual increase in the value of pension benefits in the summary compensation tables that most analysts use in assessing the magnitude of executive pay across firms.
The remainder of the paper is organized as follows. Part II describes the current disclosure rules that enable firms to provide compensation via pension benefits that is less transparent than other forms of executive pay. Part III discusses the difficulty of explaining the heavy use of executive pensions as an efficient compensation device. Part IV discusses in detail several examples of CEO pension packages to illustrate the potential significance of pension compensation in assessing executives’ total pay. Part V provides evidence about the magnitude of pension benefits both in absolute terms and relative to other forms of compensation. Part VI considers the effects of pension benefits on the link between executive pay and performance. Part VII discusses the policy implications of our analysis and the disclosure requirements that could, at minimal cost, improve information available to investors about the magnitude and effects of pension benefits. Part VIII concludes.
II. THE NON-TRANSPARENCY OF PENSION PAY
Pension plans are an important feature of contemporary executive
compensation.8 The amounts of the annual payments available under these plans are
usually based on the number of years an executive has served with the company and
8 For a detailed description of pension practices and disclosures provided in BEBCHUK & FRIED, supra note 3, ch. 9.
the executive’s pre-retirement cash compensation. In general, then, as an executive’s salary and tenure increase, the executive’s annual pension benefits increase correspondingly. Pension payments, like salary, are largely decoupled from firm performance.9
In their annual proxy filings, firms must publish a summary compensation table providing the dollar value of the various forms of compensation received by the current CEO and the four other highest-paid executives of the firm. These figures are the most salient indicators of executive compensation in public firms. They are easily accessible to the media, shareholders, and researchers. As a result, the standard databases of executive compensation — including the ExecuComp database, which is used both by financial economists and compensation consultants to assess executive pay systematically — are based on the highly-visible figures set forth in these tables.
If executive pensions were structured as defined-contribution plans — with companies contributing a specified amount to accounts that will be made available to executives upon their retirements — firms would have to report these contributions
in their summary compensation tables. But under the defined-benefit approach
commonly used by public companies, annual increases in the value of an executive’s retirement assets are largely hidden from view: firms are not required to include these increases in their summary compensation tables. A person examining compensation tables alone would therefore be unable to detect the steady buildup in the value of an executive’s pension benefits.
Furthermore, disclosure requirements obligate firms to include only those
amounts paid to current executives in the summary compensation tables. Because
most executives are no longer employed by the firm when their pension payments begin, payments to these retired executives need not be included in the published
tables. Thus, the value of an executive’s defined-benefit pension plan never appears
9 In addition, it is not uncommon for firms to credit executives with additional years of service at the time of their retirement, ratcheting up the final payout under the plan’s formula. In our sample, for instance, such ratcheting up was done on behalf of the CEOs of Hercules and Delta.
— either when pension payments are promised or when they are delivered — in the summary compensation tables from which the media and researchers collect most of their information about executive compensation.
For this reason, executive pension plans have sometimes been marketed to corporate compensation committees specifically as a means for increasing
compensation “off the radar screen of shareholders.”10 According to media reports,
some directors have voted to adopt such plans only after being reassured that the monetary value of the benefits would not have to be stated in the company’s disclosures.11
Although the value of executive pension benefits do not appear in public disclosures, the existence of the pension plans and the method for determining the
amount of annual benefits must be disclosed in the firm’s SEC filings.12 In this paper,
we use these disclosures to make estimates of the value of pension plans awarded to the CEOs in our sample. But such estimates are not accessible to outsiders without closely analyzing company disclosures and making a series of actuarial assumptions and calculations.
Because of the limitations of existing disclosure requirements, monetary values of executive pension plans have not been included in the standard databases used for research on executive compensation by financial economists. The ExecuComp dataset, for example, includes only those compensation components on which firms place a monetary value in their filings. And, because the media also uses standard executive pay datasets, pension plan values have not been included in
10 Liz Pulliam Weston, The Fall of Enron; Despite Recession, Perks for Top Executives Grow; Pay: Hidden Benefits Mushroom as Employees’ Retirement Plans Shrink, L.A. TIMES, Feb. 1, 2002, at A1 (quoting Cynthia Richson, director of corporate governance for the State of Wisconsin Investment Board).
11 Glenn Howatt, HealthPartners Ex-CEO Reaped Board’s Favors; Secret Deals Contributed to $5.5 Million Package, MINNEAPOLIS-ST. PAUL STAR TRIB., Jan. 17, 2003, at 1A. According to this report, the HealthPartners board adopted a defined-benefit pension plan for the CEO “after receiving assurances that the supplemental retirement plan wouldn’t have to be reported to the public.” Id.
reports on CEO pay published annually in the financial press.13 To what extent has
this omission distorted perceptions about the magnitude and makeup of executive pay? This is a question that we seek to answer in this paper.
III. THE PUZZLE OF EXECUTIVE PENSIONS
Another important aspect of executive pensions that should be discussed at the outset is that it is far from clear that their heavy use by companies has an efficiency rationale – that is, that pensions provide an efficient form of compensating executives. For any given amount of total pay that executives receive, boards and executives negotiating at arm’s length can be expected to structure pay in an efficient way. If an alternative form of compensation could increase the total pie available to the contracting parties, they could be made both better off by switching to it. Thus, it is worth reflecting on whether there is a good efficiency explanation for the common use of pensions as a significant element of executive pay.
A. Tax Benefits
To many readers, the use of pensions to compensate executives seems natural and straightforward given that firms offer pension plans to many non-executive employees. But the pension plans used to compensate non-executive employees are designed to capture the benefits from favorable tax treatment of “qualified” pension plans. Firms get a current deduction for contributing funds to a qualified plan for employees, but employees do not pay income taxes until they retire and start getting payouts from the qualified plan. Until the employee retires, the funds invested by the firm grow tax-free, with neither the firm nor the employees paying any taxes on the appreciation in the value of investments. The qualified plans provided to
13 See, e.g., Matthew Boyle, 2003 Executive Compensation Report, FORTUNE, May 3, 2004, at 123 (examining climbing pay of Fortune 500 executives, but excluding pension values); Louis Lavelle, Executive Pay, BUSINESS WEEK, Apr. 19, 2004, at 106 (same).
executive employees provide them with tax benefits without increasing the firm’s tax bill.
Because of the limits on how much money can be placed in a qualified pension plan for each employee, however, firms cannot use qualified plans to provide executives with pensions that are close or even on a similar order of magnitude as the executives’ annual compensation. For this reason, firms provide pensions to executive mainly through nonqualified “supplemental” executive retirement plans (SERPs). These SERPs do not enjoy a tax subsidy. Rather than avoid taxes on investment income, they largely shift such taxes from executives to their firms. Whether such a shift reduces or increase the combined tax bill of the executive and the firm depends on their respective tax rates and investment opportunities.
There are reasons to doubt that it is generally efficient to have an executive’s tax burden shifted to the company. For one thing, given that the long-term capital-gains tax rate paid by individuals is lower than the marginal corporate tax rate paid by
profitable companies, such a shift is likely to be inefficient in many companies. More
importantly, it is telling that firms providing SERPs to executives generally do not offer such plans to non-executives employees. If SERPs were tax-efficient, one would expect companies to offer their non-executive employees at least the option of getting some of their compensation in the form of such nonqualified plans. However, firms generally do not offer employees that reach the limits on contributions to qualified plans the option to be paid through nonqualified plans; firms simply give compensation to employees and let them save whatever part of it they choose rather than save it for them in nonqualified plans. This fact suggests that, absent the tax subsidy provided to qualified plans, using nonqualified pension plans is commonly not a tax-efficient way to compensate employees. Thus, companies’ common practice of offering nonqualified SERPs to executives is difficult to explain on tax-efficiency grounds.
B. Reduction in Risk-Bearing Costs
The SERPs offered to executives shift from the executive to the company not only the tax liability for investment gains but also the risk of poor investment
performance. Executives’ pension plans are defined-benefit plans, which guarantee
fixed payments to the executive for life and thus shift the risk of investment performance entirely to the company and its shareholders. No matter how poorly the firm’s investments perform, the executive is guaranteed a specified lifelong stream of payments. Thus, putting taxes aside, it might be suggested that executives’ pension plans produce an efficient reduction in executives’ risk-bearing costs by shifting risk from executives to shareholders that are better able to bear such risk.
This explanation, however, is put in doubt by the fact that firms have been shifting from defined-benefit plans to defined-contribution plans in their compensation plans for non-executive employees. If defined-benefit plans produce a more efficient allocation of risks in contracts between companies and their executives, one would expect them to allocate risks efficiently also in contracts between companies and their non-executive employees. Indeed, if anything, one would expect defined-benefit plans to be more valuable to regular employees—and thus to produce a greater reduction in risk-bearing costs—than they are to executives. Relative to executives, non-executive employees are likely to be more dependent on their company’s retirement plans to meet their financial needs in retirement and therefore less able to bear the investment risks associated with defined-contribution plans. Thus, the fact that many companies offer defined-benefit plans to their executives but not (or at least no longer) to their regular employees casts doubt on the risk-bearing costs explanation.
C. Aligning the Interests of Executives and Debt-holders
Clearly, providing a substantial part of executives’ compensation through pensions does not provide executives with high-powered incentives to enhance share
value. In a recent paper, however, Sundaram and Yermack argue that executive pensions can be understood as a mechanism for aligning the interests of executives
not with shareholders but rather with those of debtholders.14 According to this
explanation, by providing executives with compensation in the form of a debt of the firm, firms induce executives to behave more conservatively and discourage them from taking risk-increasing actions that could increase the likelihood of default. There are several questions that arise, however, as to whether this debt-serving logic can explain companies’ heavy use of executive pensions. First, according to a standard view in financial economics, executives are likely to make choices in a more conservative fashion than would be in the interest of diversified shareholders, and a useful consequence of option plans is that they encourage executives to act less conservatively. For those who hold this view, providing executives with debt of the company would neutralize some of the effects of option grants and lead executives to be too conservative. Second, even if it were desirable to align the interest of executives with those of the company’s debtholders, it is unclear why such incentives need to be provided through pensions rather than simply by providing executives with compensation made of a mix of equity and debt securities of the company (or a mix of options on such securities); such compensation could align the interests of executives with the firm’s debtholders and shareholders in a more precise way than the standard design of pension plans could do.
Third, the debt-serving explanation is premised on an assumption that the pension obligations that companies create toward their executives face the default risk as long-term debt obligations of the company. However, companies often allow retiring executives to get in cash the actuarial value of their pension, and companies going through chapter 11 reorganizations often assume in full the company’s obligation to executives under defined-benefit plans even when they pay only part of the claims of financial creditors.15
14 See Sundaram and Yermack, supra note 6.
15 This statement is based on our conversations with Dave Gordon, a compensation lawyer with Clark Consulting with a great deal of experience in this area. In his experience, a
Finally, if executive pensions were designed to serve debtholders, one would expect firms to commit to using them in the agreements accompanying the issuance of public debt issues, the placement of private debt securities, or the taking of bank loans. But such commitments are not commonly included in such agreements.
D. Camouflage
Although the efficiency benefits of providing executives with defined-benefit SERPs are far from clear, such plans do have clear “camouflage” consequences. They reduce the visibility of a substantial amount of performance-insensitive compensation. Thus, to the extent that designers of pay arrangements are interested in reducing the salience of the total amount of compensation, or the extent to which compensation is decoupled from performance, executive pensions can be useful. A camouflage motive might lead to the inclusion of a pension component even when such inclusion does not produce efficiency benefits – indeed, even when compensation via a pension plan is less efficient than some alternative forms of compensation.
substantial fraction of SERPs provide executives with the option of taking the actuarial value of their plan as a lump-sum amount upon retirement. When such a lump-sum option is available, it is common to use the rate of return on long-term treasury bonds as the discount rate used in calculating the actuarial value of the plan at the time of the executive’s retirement.
Also, in Dave Gordon’s experience, it is common for unfunded pension obligations to executives to survive chapter 11 bankruptcy. Recent examples of companies that underwent chapter 11 reorganizations and assumed fully such obligations are Comdisco and Harvard Industries, whose reorganization plans can be found at:
http://lopucki.law.ucla.edu/BRD_documents/Comdisco/Plan.pdf, and
http://lopucki.law.ucla.edu/BRD_documents/Harvard%20-%20plan.pdf.
IV. MOTIVATING EXAMPLES
The discussion in the preceding Part highlights the importance of obtaining a quantitative sense of the magnitude of executive pensions and the fraction of total pay they comprise. Before proceeding to present systematic evidence concerning these variables, this Part discusses in detail several examples of large pension benefits enjoyed by CEOs. By raising the possibility that executive pensions might be a significant form of compensation, these examples motivate and set the stage for the more systematic examination conducted in Part V.
A. Pfizer’s $80 Million Pension Benefit
Dr. Hank McKinnell has served as Pfizer’s CEO since 2001. He is a current Chairman of the Business Roundtable and former co-chair of the Business Roundtable’s Corporate Governance Task Force. In November 2003, the Business Roundtable issued a statement entitled “Principles of Executive Compensation”
prepared by the Task Force co-chaired by McKinnell.16 According to one of the
principles companies were urged to follow, “corporations should provide complete, accurate, understandable, and timely disclosure to stockholders concerning all
significant elements of compensation and compensation practices.”17 The principles
call on companies to disclose compensation in a way that is “transparent and understandable to stockholders,” addressing both “the form and amount of executive compensation” as well as “the relationship of executive compensation packages to
corporate goals and strategy.”18
16 BUSINESS ROUNDTABLE, Executive Compensation: Principles and Commentary, Nov. 2003, available at http://www.businessroundtable.org/pdf/ExecutiveCompensationPrinciples.pdf [hereinafter Executive Compensation Principles and Commentary]; see also BUSINESS ROUNDTABLE, Transcript of Telephone Media Briefing, Nov. 17, 2003 (presentation of the adopted principles by Hank McKinnell, Franklin Raines, and John Castellani).
17Executive Compensation Principles and Commentary, supra note 16, at 2. 18Id. at 13-14.
During his tenure as CEO, McKinnell has received total salary of approximately $5 million; his total compensation as CEO, at the time of this writing,
has added up to about $67 million.19 McKinnell’s salary and total compensation as
CEO do not stand out when compared to CEO pay at peer firms. But these numbers tell only half of the compensation story: the value of Dr. McKinnell’s pension plan is greater than the total compensation he has received during his years as CEO.
At sixty-two, McKinnell is three years away from retirement. Assuming conservatively that his compensation will not increase before his retirement — and using the pension tables provided in Pfizer’s annual proxy — we estimate that Dr.
McKinnell will receive an annual pension of $6.5 million upon his retirement.20 It is
worth noting that Pfizer’s proxy statement discloses neither the actuarial value of Dr. McKinnell’s pension benefits nor the amount of the annual payment. To value this pension, therefore, a reader would have to carefully review Pfizer’s disclosures to determine how the firm will calculate the annual payment — and then make an actuarial assessment of the cost of these payments over the remainder of Dr. McKinnell’s life.
Moreover, investors seeking to place a monetary value on Dr. McKinnell’s pension plan would require additional information to do so. As is the case with many CEOs, his pension will be paid in the form of a joint-life annuity, guaranteeing a 50% benefit to his surviving spouse in the event of his death. Thus, the actuarial value of his pension plan depends on whether he is married and, if so, the age of his
19 Throughout this paper, we use the term “total compensation” to refer to both equity compensation (valued at the grant-date value of options and restricted shares) as well as non-equity compensation. We have drawn all of our salary and total compensation figures directly from ExecuComp’s database. All compensation from years prior to 2003 has been adjusted for inflation using the annual change in the Consumer Price Index. Note that, because ExecuComp contains data from 1992 to 2003 only, these results exclude compensation received in years outside this period. For additional discussion of our methodology for comparing pension values to executives’ total compensation, see infra note 47.
20 See Pfizer Inc. Proxy Statement, Mar. 10, 2005, at 55 (annual benefit calculated using the company’s pension plan table and assuming that Dr. McKinnell’s 2004 compensation is indicative of the total compensation figure upon which his pension benefit will be based).
spouse. The proxy statement does not provide any information on these matters.
According to an article in the press, Mr. McKinnell was engaged to be married,21 but
we have been unable to identify from public sources whether he has since then married his fiancée. The company declined a request that it provide the clarification concerning Mr. McKinnell’s marital status necessary to calculate the value of his retirement benefit.22
If Dr. McKinnell is not married, we estimate the actuarial value of his pension
plan at approximately $71.5 million.23 If he was indeed recently married, the extent
to which the value of his pension has increased depends on the age of his spouse. For example, assuming that Dr. McKinnell’s spouse is the same age as he is, we estimate that the marriage has increased the value of his pension by $11.6 million, bringing the total amount to about $83 million. In either case, understanding the value of Dr. McKinnell’s retirement benefits — which do not appear to be disclosed to investors in the “transparent and understandable” way recommended by the Business Roundtable — is critical for investors’ gaining a complete picture of his overall compensation.
B. UnitedHealth Group: Making CEO Retention More Difficult
Dr. William McGuire became CEO of UnitedHealth Group in October 1999. In 2003, he earned a base salary of $2.1 million and received total compensation of
about $10 million.24 Again, however, Dr. McGuire’s annual pay is only part of the
story.
Dr. McGuire is entitled to substantial retirement benefits. UnitedHealth will pay him about $5.1 million per year upon his retirement for the remainder of his life,
21See Amy Barrett, Pfizer’s Funk, BUSINESS WEEK, Feb. 28, 2005, at 72.
22 Telephone Interview with Pfizer Media Relations Department, April 8, 2005.
23 Our methodology for calculating the actuarial value of pension plans is described infra at text accompanying notes 41-43.
and it will pay about $2.5 million each year to his surviving spouse.25 Assuming Dr.
McGuire is married to a woman his age, we estimate the present value of his pension benefit at about $45 million, more than four times his total compensation in 2003.
An interesting feature of Dr. McGuire’s pension plan is that, once in place, the
plan’s design might make it more costly for the company to retain him. Companies
often refer to executive retention as one of the goals of their compensation arrangements, but Dr. McGuire’s plan does not seem to serve this goal. Under the terms of the plan, the company will be obligated to begin paying Dr. McGuire’s
annual benefit upon termination of his employment “for any reason.”26 Unlike most
executives — who must wait until a designated retirement age, usually sixty-five, before collecting pension benefits — Dr. McGuire, who is now just fifty-seven years old, can begin receiving these substantial payments whenever he chooses to retire.
From Dr. McGuire’s perspective, then, working for an additional year costs
him $5.1 million in forgone pension payments. Thus, UnitedHealth must pay him $5.1 million each year in order for him to break even with respect to his decision not to retire. That is: Dr. McGuire will be financially rewarded for choosing to work only after the company spends $5.1 million to neutralize the effects of McGuire’s
entitlement to large pension benefits whenever he leaves. 27
C. Black & Decker: The Significance of Pensions to Shareholder Value
While Drs. McGuire and McKinnell are entitled to substantial pension benefits in absolute terms, their companies have large market capitalizations, and their pension benefits comprise only a small fraction of their firms’ substantial market
25Id. at 25. 26Id. at 25-26.
27 It might be suggested that, at the time Dr. McGuire was promised his generous retirement benefits, the large actuarial value of the plan could have been helpful in inducing him to serve as CEO. For any given actuarial benefit the company wanted to provide ex ante, however, the company could have avoided the perverse effect described here by providing a larger annual payment beginning at a stipulated retirement age — rather than giving Dr. McGuire an annual incentive to retire from the firm.
value. For smaller companies, however, executives’ pension values might be significant relative to overall firm value.
Nolan Archibald, Black and Decker’s CEO, will be entitled to annual pension
payments upon his retirement at age sixty.28 Assuming conservatively that his
compensation will not go up before his retirement, his annual pension payment will be about $2.5 million. We estimate the present value of his retirement benefits at $38.3 million.29
These pension benefits are hardly negligible to the shareholders’ bottom line. At the time of this writing, Black & Decker’s market value stood at approximately
$6.5 billion.30 Mr. Archibald’s pension alone, then, was worth approximately 0.65% of
the total value of the firm that he operates. Mr. Archibald’s example makes clear that the magnitude of pension benefits can be substantial even in the context of overall firm size.
Interestingly, as recently as last year, Mr. Archibald’s pension value constituted a substantially higher percentage of Black & Decker’s market capitalization. This percentage declined between December 2003 and April 2005 as a consequence of a recent increase in the price of Black & Decker stock. As of December 31, 2003, Black & Decker’s market capitalization was approximately $3.8 billion, and the value of Archibald’s pension was therefore equal to about 1% of the firm’s market value. Clearly, pension values can be significant relative not only to total executive pay but also relative to total firm value.
28 Black and Decker Corporation Proxy Statement, Mar. 14, 2005, at 14, 16-17. Note that, although Black & Decker’s pension plan calls for a retirement age of sixty-five, its Supplemental Executive Retirement Plan has a “normal retirement age” of sixty. Because the majority of Mr. Archibald’s benefits will be paid through the latter program, we used a retirement age of sixty in valuing his pension.
29 For a description of the methodology we used to calculate the actuarial value of pension plans, see infra text accompanying notes 41-43.
30 We calculated the firm’s market capitalization on the basis of outstanding shares and share price as of April 1, 2004.
D. Home Depot: High Pensions, Brief Tenure
The preceding examples described executives who had a lengthy tenure with their companies. As our final example illustrates, however, some executives are able to accumulate rather large retirement benefits even before they accrue lengthy service with their firms.
Robert Nardelli joined Home Depot in December 2000 to become its new President and Chief Executive Officer. In 2003, he received total compensation of
about $22 million.31 Three years into his tenure, however, Mr. Nardelli, who is 56
years old, is already entitled to annual payments of approximately $3.25 million
upon his retirement at age sixty-two.32 This figure will go up in the likely event that
his salary and bonus increase before his retirement. Even assuming that Mr. Nardelli’s compensation level remains flat until he is sixty-two, we estimate the present value of his pension entitlement upon reaching retirement age at approximately $33 million. Thus, if Mr. Nardelli leaves the company upon reaching retirement age, he would receive about $4 million in retirement benefits for each year of service as CEO.
Moreover, even if Mr. Nardelli leaves the firm now, he will still be entitled to receive annual payments starting at age sixty-two. In such a case, Home Depot’s proxy statement indicates, Mr. Nardelli will receive only “discounted benefits,” — but the statement provides no information about the size of this discount. In response to a request for information about the size of the discount, the company declined to
provide this information.33 Assuming that the discount is approximately 33%, for
example, Mr. Nardelli can depart Home Depot after just four years of service with retirement benefits of $22 million — or more than $5 million for each year he served as CEO. Of course, the exact figure depends on the magnitude of the discount, which
31 The Home Depot, Inc. Proxy Statement, April 12, 2004, at 22.
32Id. at 29. We estimated Mr. Nardelli’s annual benefit by applying the company’s formula for the benefit to his 2003 compensation.
Home Depot has chosen not to disclose to investors — making it even more difficult for shareholders to appreciate the significance of these benefits and their effects on firm value.
V. THE SIGNIFICANCE OF PENSIONS
The above examples suggest that an analysis of executive pay that excludes retirement benefits might tell only part of the story. To examine whether this is indeed the case, we turn now to a more systematic study of the magnitude of these benefits and their effects on the makeup of executive compensation.
A. Sample
The precise value of an executive’s pension plan usually does not crystallize until the executive approaches retirement. Executives who will remain at their firms for extended additional periods may well experience changes — usually increases — in the magnitude of their annual pension amount. Therefore, to get a good sense of the role that pension values play in the overall picture of executive pay, it is useful to focus on executives whose final retirement benefits can be estimated with relative accuracy. Therefore, our sample includes executives who either have already departed their firms or who are likely to retire in the relatively near term.
Our study therefore includes two sets of executives. Our first sample was generated by searching ExecuComp’s database for issuers with CEOs that departed
their companies during 2003 and the first five months of 2004.34 The second sample
included all CEOs in the ExecuComp database at S&P 500 companies who are
between sixty-three and sixty-seven years of age.35
34 We selected this timeframe because ExecuComp’s most recent update at the time of this writing included only data available through May of 2004.
35 Because we drew data on the executives’ ages from the ExecuComp database, our second sample consists of CEOs between the ages of sixty-three and sixty-seven at the end of 2003. This is the most recent data on executives’ ages available from the database.
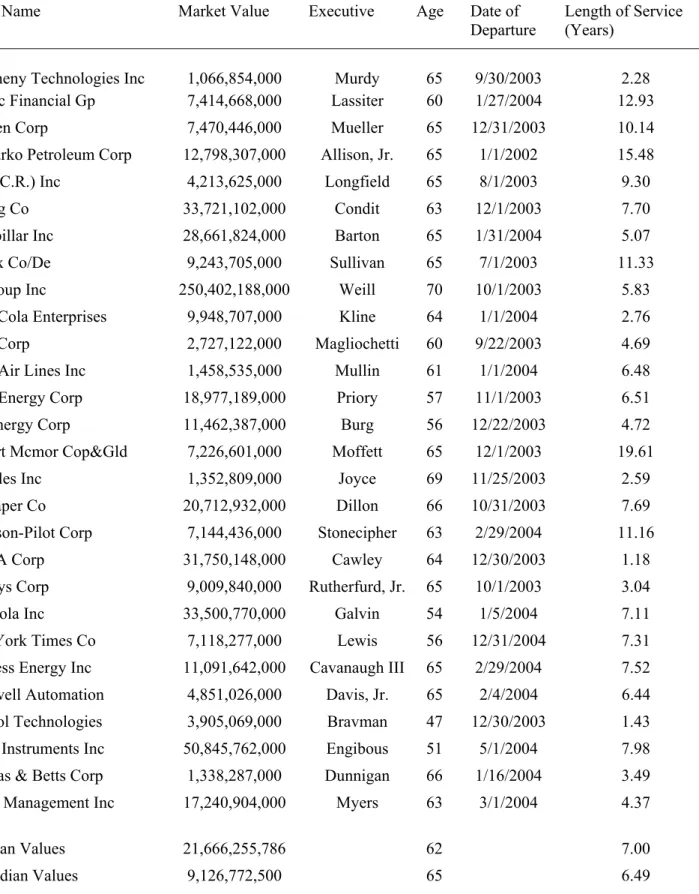
Our first sample of retired executives is set forth in Table 1 below. Among this first group of executives, twenty-eight, or 68%, were members of a company-sponsored pension plan. Thus, the incidence of pension plans in our sample is comparable to some recent estimates of the prevalence of such plans among CEOs of
public firms in general.36 The CEOs in our first sample were, on average,
approximately sixty-two years old and served an average term of seven years as CEO prior to their departure. Because the group contains only S&P 500 issuers, the mean market capitalization of the companies in our sample is rather large, at more than $21 billion—although the sample includes a relatively diverse collection of companies,
with values ranging from just over $1 billion to more than $250 billion.37
[Insert Table 1]
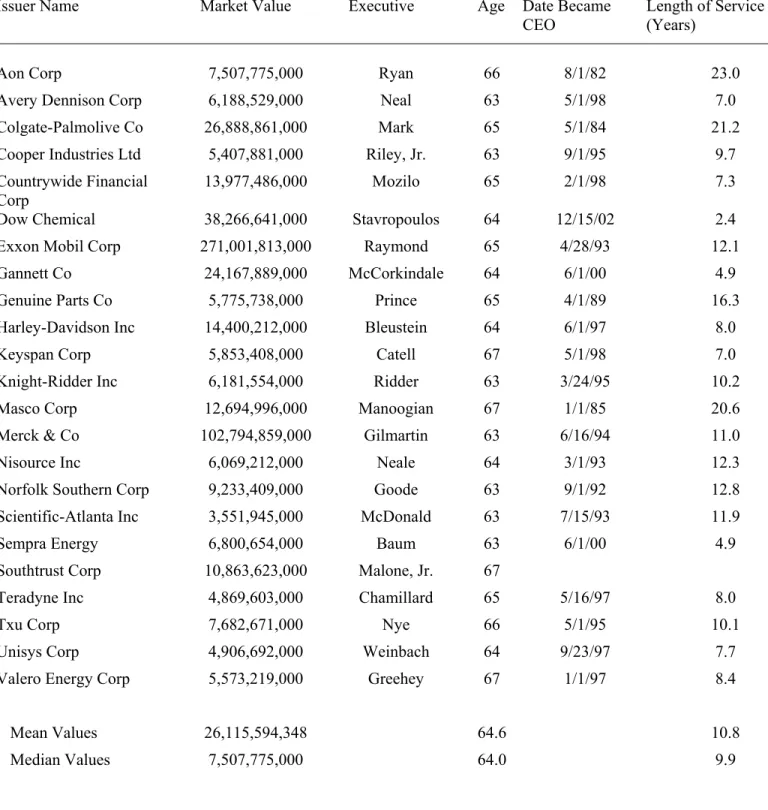
Our second sample of executives is set forth in Table 2 below. The ExecuComp database included thirty-six CEOs of S&P 500 companies between the ages of sixty-three and sixty-seven. Among our second group of executives, twenty-sixty-three, or 64%,
were members of a company-sponsored pension plan.38 Unsurprisingly, the CEOs in
our second sample have a slightly higher average age (64.6 years) than the executives in our first sample. The issuers in our second sample also have a slightly higher mean market value of $26.1 billion —although this sample, too, consists of a broad range of companies, with values ranging from $3.5 billion to $271 billion.
[Insert Table 2]
36 Clark Consulting estimated that approximately 70% of companies used defined-benefit pension plans in 2003. See Clark Consulting, Executive Benefits: A Survey of Current Trends: 2003 Results, at http://www.clarkconsulting.com/knowledgecenter/articles/benefits/ 10thannualsurvey.doc (last accessed Mar. 14, 2005).
37 Because we have drawn market value data from the ExecuComp database for this group of executives, note that all values represent the issuers’ market values at the end of 2003.
38 The incidence of pension plans in this sample, then, was also consistent with analysts’ estimates of the incidence of pension plans. See Clark Consulting, supra note 36.
Taken together, these samples provide a picture of the approximate magnitude of the expected costs that executive pension plans impose upon shareholders. The first sample, which consists only of retired CEOs, permits us to estimate the magnitudes of pensions that shareholders have already begun to pay. The second sample, which consists of CEOs that are approaching retirement, permits us to assess the approximate costs of pensions that shareholders can be expected to start paying before too long.
B. Annual Pension Values
After identifying the set of executives and issuers in each sample, we estimated the annual pension benefit of each executive by reviewing the issuers’ proxy materials, 8-Ks, and the executives’ employment agreements. These materials often disclose either the executives’ annual benefits — which are commonly based upon their length of service and selected categories of compensation during the
executive’s tenure — or at least the way in which the firm calculates this benefit.39
We also adjusted the annual value of the executives’ pension benefits for “grossing-up” provisions that entitle participants to have the company cover the tax liability
generated by pension benefits.40 Our estimates of the annual payments also included
additional grants of “service credit” by the issuers’ board, which in several cases increased the executives’ retirement benefits considerably. For example, in our first sample William H. Joyce was granted 15 years’ service credit when he became CEO of Hercules, Inc., at an anticipated cost of nearly $5 million.
39 In those cases in which the exact amount of the executive’s annual benefit was not disclosed, we assumed that the benefit would be calculated on the basis of the executive’s compensation in the year of service preceding his retirement. In all of these cases, we calculated the executive’s annual benefit based upon the categories of compensation that the issuer’s pension plan includes when calculating benefits.
40 In those cases that required “grossing up” of annual benefits, we conservatively assumed that federal and state income taxes combined subject retiring CEOs to a marginal tax rate of 35%.
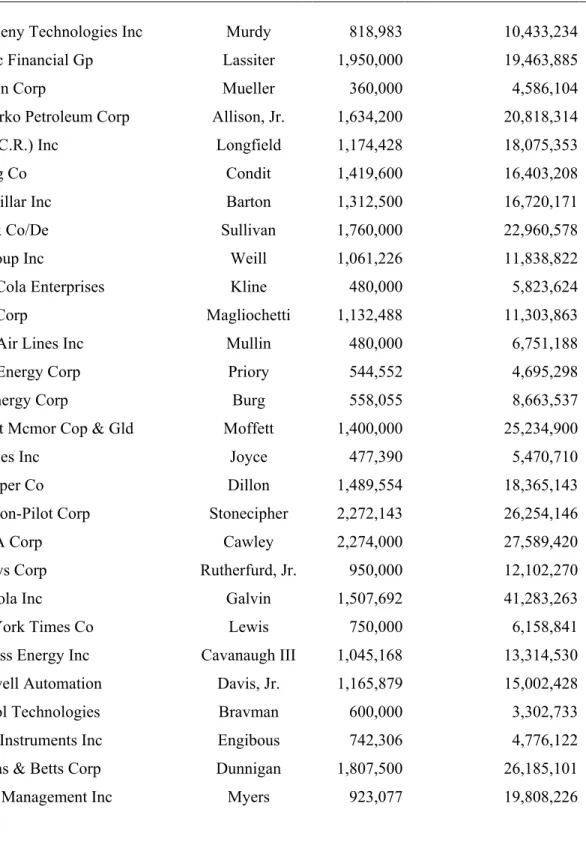
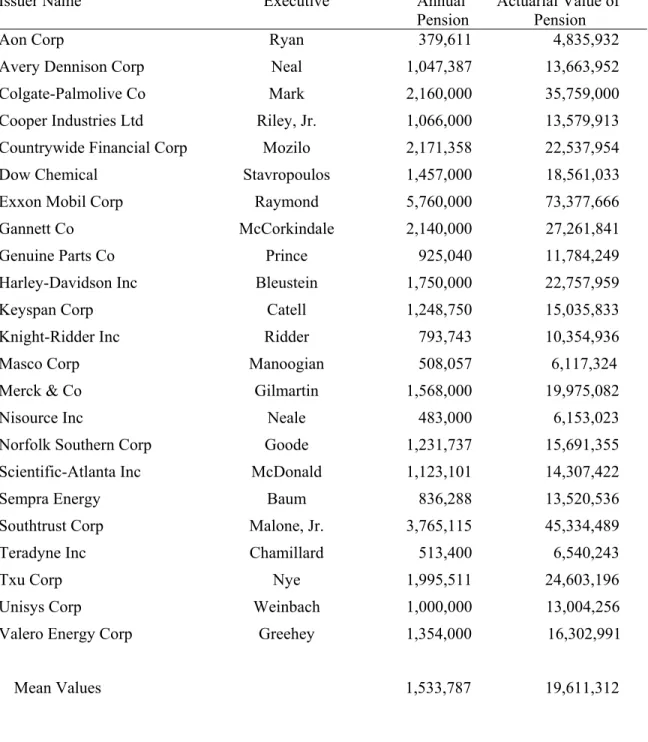
Tables 3 and 4 below set forth the CEOs’ annual pension benefits in each of the two samples we examine. As Table 3 indicates, the average annual payments for our sample of retired executives is about $1.1 million; Charles Cawley, former CEO of MBNA Corporation, is entitled to the highest annual pension payment in this group at more than $2.3 million per year. Table 4 provides our results for the sample of current executives approaching retirement age. These executives had an average annual pension benefit of more than $1.5 million. The executive with the highest annual pension among our sample of current CEOs, Lee Raymond of Exxon Mobil, is entitled to more than $5.7 million per year in benefits.
[Insert Table 3] [Insert Table 4]
C. Costs of Retirement Benefits: Actuarial Values of Pension Plans
After identifying each executive’s annual pension benefit, we calculated the
value of these income streams by estimating the price of a life annuity instrument41
purchased at the applicable retirement age and providing an annual payment equal
to the executive’s benefit.42 In those cases in which the company’s pension plan
provided benefits to the executive’s spouse on a joint survivor basis, we calculated
41 We did not deduct some small offsets from annual benefits required in some cases in our sample for simplicity of calculation and because we did not expect these offsets to be significant. Several of the pension plans in our sample require deductions for Social Security payments to which the executives will be entitled during their retirement. These benefits are likely to be quite small relative to annual pension payments.
42 These calculations, which depended in part on the executive’s gender and state of residence, were in many cases performed by using an Internet mechanism for providing annuity values. See Instant Annuity Price Calculator, at http://www.immediateannuities.com (last accessed April 14, 2005). For simplicity, we assumed that executives would reside or retire in the state in which the firm maintains its headquarters according to ExecuComp.
the value of the pension by pricing an annuity providing for joint survivor benefits
purchased when the executive reached retirement age.43
All but one member of our first sample are entitled to pension benefits at the
age of sixty-five.44 Because most of the executives in this first sample will not be
entitled to receive the annual benefit until they reach the age of sixty-five, we discounted the value of their pension benefits to present-value dollars over the time period between their departure and the year the executive will reach the retirement age.45
43 We used this methodology to calculate the value of the pension benefit in every case but one. In that case, Richard Bravman, former CEO of Symbol Technologies, was awarded a 15-year stream of payments rather than a life benefit. To estimate the value of that benefit, we simply calculated the value of a 15-year annuity in the amount of Mr. Bravman’s benefit at a discount rate of 5%.
44 In most cases, the issuer’s proxy materials explicitly indicated that executives would not be entitled to pension benefits until they reached the pension plan’s normal retirement age. In one case, however, Motorola CEO Christopher Galvin’s pension plan called for payments beginning at the age of fifty-five, or shortly after his retirement. Payments in advance of the standard retirement age were also used in the much-publicized case of Franklin Raines, which was not included in our analysis because Raines’s resignation took place outside our sample timeframe. See Bebchuk & Fried, supra note 1. Of course, because such arrangements significantly increase the number of actuarially likely payments in the pensioner’s income stream, they can increase the value of the pension asset substantially.
45 In calculating the present value of the pension of CEOs younger than the age in which they become entitled to get an annual benefit, we assumed that the executive’s benefit will not increase between his departure and age sixty-five. This is a conservative assumption because several executives in our sample continued to accrue service-time credit increasing the value of their pensions by serving as an outside consultant to the company or as a member of the company’s board of directors. For example, G. Thomas Baker of International Game Technology became Chairman of that company’s board after his resignation. Richard Bravman of Symbol Technologies remained a senior advisor to that company’s new CEO at the time of his retirement. Although we expect that both executives would continue to accrue service credit as a result of their continued employment, we have not increased their annual pension benefit as a consequence of these arrangements.
In calculating present values, we assumed a discount rate of 5%. Sundaram and Yermack, supra note 6, at 7, suggest that the discount rate we used might be lower than the one that should be used for companies with a significant likelihood of default. However, Some firms have established trusts to ensure that executive pensions will be secure even in the event that the firm declares bankruptcy. See, e.g., Theo Francis & Ellen E. Schultz, Guess Whose Retirement Benefits Aren’t Endangered?; Many Companies Set Up Trusts to Protect Huge
Tables 3 and 4 above set forth the actuarial values of the pension benefits of the CEOs in our samples. CEO pension values in our first sample, which includes only retired executives, had an average value of about $15 million; pension benefits
for all twenty-eight executives in this sample totaled more than $423 million.46 The
current CEOs featured in our second sample were, on average, entitled to even more generous benefits As Table 4 shows, the average actuarial value of the current executives’ pension benefits exceeded $19 million. The twenty-three executives in this group were entitled to approximately $451 million in total benefits. Taken together, then, our sample of fifty-one current and retired CEOs are entitled to pension benefits worth over $800 million.
Table 5 below provides summary statistics for each of our samples as well as summary data for the combined sample of fifty-one executives. The median actuarial value of the pension benefits in our first sample was about $14 million; the median for our second sample, as well as for the fifty-one executives in our sample overall, was approximately $15 million. (In discussing the summary statistics in this and subsequent tables, we will focus on median figures in order to avoid distortions caused by outliers in the sample.)
Pensions for Top Executives, WALL ST. J., April 6, 2003, at B1. Furthermore, as discussed in supra note 15, even when executives’ pensions are unsecured, firms going through chapter 11 bankruptcy often choose to assume fully such obligations. Given these considerations, and our assumption that the annual benefit is not expected to rise between the date of calculation and the date of eligibility for annual payments, there is little basis for expecting our methodology to result in estimates of the present value of executives’ pensions that are overall too high rather than too low.
46 In one case, Joseph Magliochetti of Dana Corporation, after the executive’s death his spouse chose a lump-sum payment equal to the present value of the annual benefit to which Mr. Magliochetti was entitled. To calculate the comparable annual benefit in this situation, we simply calculated the future value of the lump sum payment in this case and then computed the actuarially necessary annual payments required to finance an annuity with this value. This approach is simply the converse of the analysis we used to calculate the total actuarial value of a stream of payments in cases in which the issuer disclosed the value of each payment in the stream rather than the value of the lump sum. See text accompanying supra notes 41-43.
[Insert Table 5 here]
Importantly, there is substantial variance within each sample and across the combined set of fifty-one executives as a whole. As Table 5 shows, the annual pension amount ranges from a low of $360 thousand to a high of nearly $2.3 million in our first sample of retired CEOs and ranges from a low of about $380 thousand to a high of nearly $5.8 million in our second sample of currently serving executives nearing retirement age. This substantial variation among executives with pension plans indicates that the exclusion of pensions from analysis of executive
compensation is likely not only to skew analysis of the magnitude of executive pay
but also distort comparisons among executives. Because the effect of pension
payments on executives’ compensation varies considerably among individual CEOs, analyses of executive pay that omit pension values are likely to produce comparisons among executives that do not reflect an accurate ranking of the executives’ total compensation.
D. Relative Significance of Pension Values
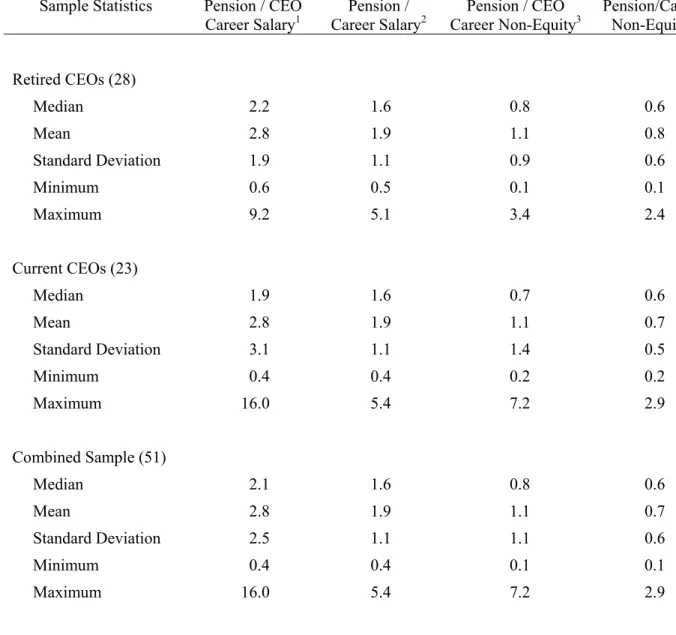
Having observed the value of pension benefits in each of our samples in absolute terms, we turn now to examining how significant these values are in the context of executives’ overall pay. Table 6 below presents a comparison between the pension benefits we valued and other components of executive compensation in each sample and for the combined group of fifty-one executives in our study.
[Insert Table 6 here]
(1) Ratio of Pension Values to Salaries Received During CEO Tenure: The first column in Table 6 compares the executives’ pension values to the base salary the
executives received throughout their tenure as CEO.47 The median ratio of
executives’ pension value to base salary received during their tenure as CEO was 2.2x for the first sample of retired executives; 1.9x for the second sample of current executives; and 2.1x for the overall group of fifty-one executives in our study.
In addition, the variation of the relationship of the CEOs’ pensions to their salaries was substantial within each of the samples and in the group as a whole. This ratio ranged from 0.6x to 9.2x in the first sample, and from 0.4xto 16.0x in the second sample. The executive with the highest ratio of pension value to CEO salary was Robert Catell of Keyspan Corporation, whose pension is worth more than 16.0x the total salary payments he has received as CEO.
(2) Ratio of Pensions to Salaries Throughout Tenure with the Firm: Because some of the CEOs in each sample served with their companies prior to their appointment as CEO, the second column in Table 6 provides our results for the ratio between the executive’s pension value and the salary he received during his entire tenure at the company to date. The median ratio between executives’ pension value and salary during the executives’ careers with their firms was approximately 1.6x in each of our samples, and the median ratio was also 1.6x for the entire group of fifty-one executives. Again, there was significant variance within each of the samples. The ratio of pension value to total career salary ranged from 0.5x to 5.1x in our first sample, and from 0.4x to 5.4x in our second sample. After Robert Catell, who again had the highest ratio, the CEO with the second-highest ratio was Maury Myers, CEO of Waste Management, Inc., whose pension is worth more than 5.1x the total salary he has received during his career at the firm.
(3) Ratio of Pensions to Non-Equity Compensation During CEO Tenure: The third
column in Table 6 focuses on the ratio of executives’ pension value to the non-equity
47 We calculated the executives’ total base salary during their service as CEO using ExecuComp’s base salary data for each executive between 1992 and 2003, and using the database’s “CEO” field to determine whether the executive was CEO during a particular year. These ratios therefore exclude compensation the executives received before 1992. Each executive’s compensation was adjusted to 2003 dollars using the Bureau of Labor Statistics’ estimate of the annual growth in the Consumer Products Index between 1992 and 2003.
compensation the executives received during their tenure as CEO.48 The median
value of this ratio was 0.8x for our first sample of retired executives, 0.7x for our second sample of current CEOs, and 0.8x for our group of executives as a whole. There was, again, significant variance among executives: the ratio ranged from 0.1x to 3.4x in our first sample, and from 0.2x to 7.2x in our second sample.
(4) Ratio of Pensions to Non-Equity Compensation Throughout Firm Tenure: The fourth column of Table 6 also compares pension values to non-equity compensation, but includes non-equity compensation received throughout the executives’ tenure with their firms — regardless whether the compensation was received during the executives’ service as CEO or in another executive position. Even when we include this compensation in our comparison between pension values and non-equity pay, pensions remain a significant factor. The median ratio between CEO pension values and non-equity compensation received throughout the executives’ tenure with their firms was approximately 0.6x for both of our samples of executives as well as for the group in our study overall.
In addition, there was considerable variance in the relationship between various executives’ pensions and their non-equity compensation; among all executives with pensions in our data set, this ratio ranged from 0.1x to 2.9x. Mr. Catell was again the leader among all fifty-one executives in our group with a ratio of approximately 2.9x between his pension and his total non-equity compensation; Kevin Dunnigan, CEO of Thomas & Betts, was close behind with a ratio of approximately 2.4x.
48 We calculated the executives’ non-equity compensation during their tenure as CEO using ExecuComp’s data for the executive’s total compensation including the value of options at the date they were granted and reducing that total compensation figure by the Black-Scholes value of the options at the date of issuance and the value of any restricted stock grants. In one case, to correct for a reporting error in ExecuComp’s database we were required to use the executive’s compensation based upon the exercise value, rather than the issuance value, of equity compensation. Because exercise value was typically less than issuance value in this executive’s case, this too is a conservative assumption. Note also that for our sample of currently serving executives, all compensation data includes only results through December of 2003, the last complete update of the ExecuComp database.
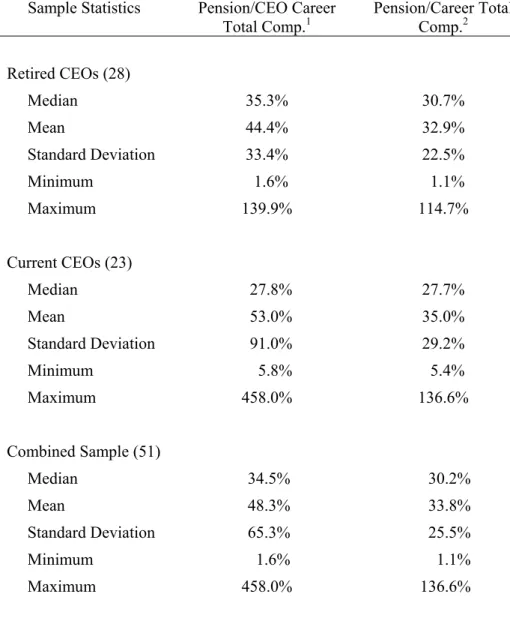
(5) Ratio of Pensions to Total Executive Compensation: Finally, we compared the
value of the executives’ pensions to the total compensation — including equity-based
compensation — that the executives received before their retirement.49 Table 7 below
presents the results of this analysis.
[Insert Table 7 here]
The first column of Table 7 compares the value of the executives’ pensions to the total compensation they received during their tenure as CEO and expresses the value of the pension as a percentage of the executive’s total compensation. The median ratio between the executive pensions and total executive compensation in our first sample was 35.3%; in our second sample, 27.8%; and in the overall group of executives in our study, 34.5%. Table 7 therefore indicates that the executives’ pensions represented a considerable proportion of the executives’ total compensation during their service as CEO. Table 7 also indicates that there was considerable variance among executives with respect to the ratio between executive pensions and total compensation. Robert Catell again led all executives in our sample, with a pension benefit worth more than 458.0% of the value of the total compensation he has received during his tenure as CEO.
The second column in Table 7 also measures the relationship between executive pensions and total compensation, but includes all compensation received during the executives’ careers with their companies, including any service prior to their appointment as CEO. Even when pre-CEO compensation is included, the relationship between pensions and total career compensation remained significant. The median ratio between the executives’ pensions and the total compensation they received throughout their careers with their companies was 30.7% for our first
49 To calculate the CEO’s total compensation, we used ExecuComp’s total compensation data including the value of stock options and restricted stock at the issuance date and adjusted each value to 2003 dollars using the Consumer Price Index. For a more detailed description of our methodology for valuing total executive compensation, see supra notes 47-48.
sample of retired executives, 27.7% for our sample of currently serving CEOs, and 30.2% for all executives included in our study. The ratio ranged from a low of 1.1% to a high of 136.6% among all of the executives in our group; Mr. Catell again led all CEOs, with Kevin Dunnigan of Thomas & Betts Corporation close behind with pension benefits worth 114.7% of the total compensation he has received during his career at the firm.
Thus, excluding pension benefits from analysis of executive pay leads to significant underestimation of the magnitude of executive compensation overall. Among the CEOs with pensions in our study, excluding pension values for the median executive ignores an element that increases the executive’s pay throughout his tenure at the firm by about 30%.
Second, the significant variance among executives with respect to the relationship between pensions and total executive pay indicates that analysis of executive compensation that excludes pensions is likely to lead to substantially inaccurate comparisons among CEOs. For example, excluding pension values for Sanford Weill of Citibank results in underestimating his total compensation during his career at the firm by just 1.1%. In contrast, excluding pension values for Robert Catell at Keyspan results in underestimating his total compensation while at the firm by more than 136.6%.
Moreover, excluding pension benefits would also distort comparisons between those executives that have pensions and the significant number of
executives that are not entitled to annual pension payments.50 In sum, in any ranking
of executives’ total compensation, the exclusion of pension values leads to significant underestimation of the relative position of executives with substantial pension values and overestimation of the relative positions of executives with low pension values or no pension plan at all.
50 Note that, among the executives reviewed in our first sample of retired CEOs, approximately 32% of executives had no pension benefits of any kind; and, within our second sample of currently serving CEOs, approximately 36% of executives had no disclosed pension benefits. See supra text accompanying supra notes 35-38.
VI. PENSIONS AND THE LINK BETWEEN PAY AND PERFORMANCE
The value of pension benefits is to a large extent unrelated to the performance of the firm during the executive’s tenure. The annual pension amount depends—to a significant extent, and sometimes exclusively—on the base salary that the CEO received in the years preceding his or her departure. Some benefit formulas are also based on bonus compensation, but even in such cases the pension benefit is
frequently based on the executive’s target bonus rather than the actual bonus paid,
decoupling the benefit from the executive’s performance.
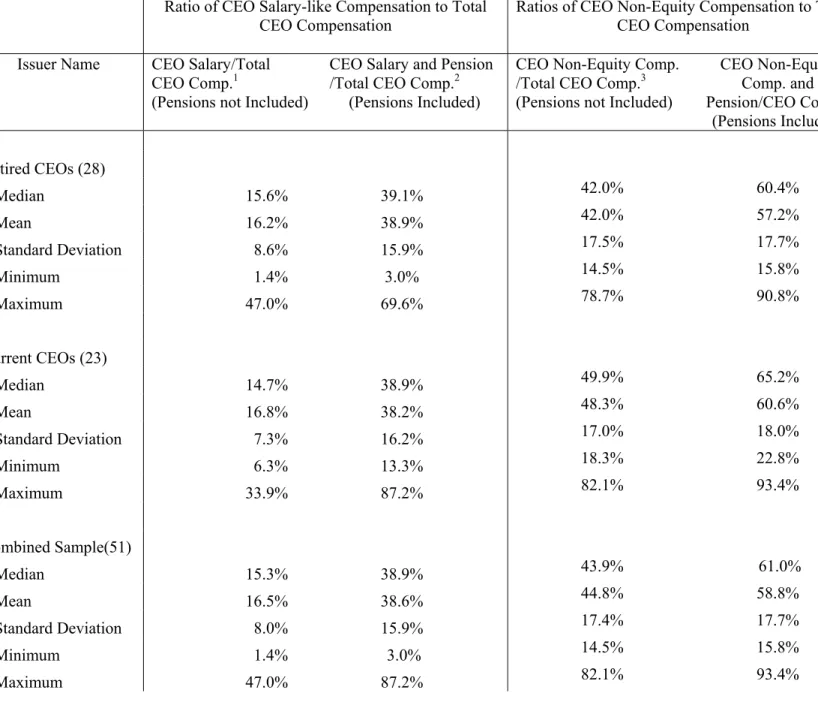
Thus, excluding the substantial compensation provided via pensions from analysis of executive pay results in a systematic underestimation of the extent to which pay is based on salary-like payments—that is, payments of salary during the executive’s service as CEO and pension payments afterwards. To get a sense of the magnitude of this underestimation, we compared the composition of the executives’ pay when their pension values were and were not included in the analysis. The results of these comparisons are presented in Table 8 below.
[Insert Table 8 here]
A. Effect of Pensions on the Proportion of CEOs’ Salary-Like Payments
As Table 8 shows, including pension values in executives’ total pay greatly increases the fraction of total compensation that is paid through salary-like payments. Before including pensions, the median CEOs in our first, second, and overall samples received 15.6%, 14.7%, and 15.3% of their total compensation while CEO in the form of salary-like payments. When we included pensions as an additional source of like payments, however, the median ratio between salary-like payments and total CEO compensation increased to 39.1% for the first sample, 38.9% for the second sample, and 38.9% for the overall group of CEOs.