DOI: 10.12928/TELKOMNIKA.v15i4.5731 1971
Improved Face Recognition Across Poses Using
Fusion of Probabilistic Latent Variable Models
Moh Edi Wibowo*1, Dian Tjondronegoro2, Vinod Chandran3,Reza Pulungan4, Jazi Eko Istiyanto5 1,4,5
Department of Computer Science and Electronics, Universitas Gadjah Mada FMIPA Sekip Utara, Bulaksumur, Sleman, Yogyakarta, 55281, Ph.: +62274546194, Indonesia
2,3
Science and Engineering Faculty, Queensland University of Technology, 2 George St, Brisbane CBD, Queensland, 4000, Ph.: +61731382000, Australia
*Corresponding Author, e-mail: [email protected], [email protected], [email protected], [email protected], [email protected]
Abstract
Uncontrolled environments have often required face recognition systems to identify faces appearing in poses that are different from those of the enrolled samples. To address this problem, probabilistic latent variable models have been used to perform face recognition across poses. Although these models have demonstrated outstanding performance, it is not clear whether richer parameters always lead to performance improvement. This work investigates this issue by comparing performance of three probabilistic latent variable models, namely PLDA, TFA, and TPLDA, as well as the fusion of these classifiers on collections of video data. Experiments on the VidTIMIT+UMIST and the FERET datasets have shown that fusion of multiple classifiers improves face recognition across poses, given that the individual classifiers have similar performance. This proves that different probabilistic latent variable models learn statistical properties of the data that are complementary (not redundant). Furthermore, fusion across multiple images has also been shown to produce better perfomance than recogition using single still image.
Keywords: face recognition, pose, classifier fusion, video, probabilistic latent variable
Copyright © 2017 Universitas Ahmad Dahlan. All rights reserved.
1. Introduction
Face recognition technology has played an important role in various automatic tasks, e.g., access control [1, 2], security and surveillance [3, 4], human computer interaction [5], and multimedia annotation [6]. Faces in these tasks become central objects, based on which, human identities are confirmed. Compared to other biometrics, such as fingerprints or irises, faces provide a more natural, direct, friendly, convenient, and non-intrusive means of human identification. These biometrics therefore demonstrate a high level of acceptance and offer a wide potential application.
While automatic face recognition has been carried out successfully in controlled exper-iments, its practical use is still limited. Situations in real-world environments change unpredicta-bly and might significantly degrade recognition performance. Pose variation is a major factor that critically affects face recognition. This variation induces non-convex facial shapes, self-occlusion, and nonlinear changes of shapes and appearances that complicate classification. Furthermore, probe faces in real-world environments often appear in poses that are totally dif-ferent from those in the enrollment databases. Identification in this case has to be performed by matching face images across poses.
Two approaches have been proposed to address face recognition across poses: (1) recognition through resynthesis, and (2) matching in pose-invariant spaces. The first approach reconstructs probe faces and enrollment samples in a reference pose (target pose) and applies traditional classification methods afterward. Geometric shape models, such as ASMs, AAMs, and 3DMMs, have been employed to facilitate accurate reconstruction [7-9]. Statistical methods, particularly linear and nonlinear regressions, have also been used to recon-struct image patches [10-12], image features, e.g., Gabor jets [13], or other representations, e.g., mixture distributions [14], in the desired view. The second approach transforms faces of different poses
into some pose-invariant representations and infers face identities by matching these representations in the pose-invariant spaces. The 3DMMs are fitted to face images in [15] to produce 3D shape and texture parameters that serve as pose-invariant representations. Sta-tistical methods, such as subspaces alignment [16] and kernel discriminant analysis [17], have also been employed for the same purpose. Recognition across poses is performed in [18] through the use of light-fields, i.e., the concatenation of face images of individuals from a number of poses. Probe faces and enrollment samples are viewed as light-fields with missing values whose least-square projections to the Eigenspace serve as pose-invariant representations. More recently, probabilistic latent variable models [19-21] have been applied to face recognition across poses with superior performance. These methods assume that there genuinely exists a multidimensional latent variable that uniquely represents the identity of an individual's faces irrespective of their poses. Using these models, the likelihoods that face images with different poses actually correspond to the same identity (latent variable) can be estimated.
While probabilistic latent variable models have been successfully used in face recogni-tion across poses, it is unclear whether richer parameters always lead to performance improve-ment. It is yet to know, for example, that the use of pose-specific transformations (tied models) will make the generic transformations (non-tied models) completely void. Similarly, it is important to confirm that explicit modelling of within-class variations (discriminant analysis) will always be a better and complete substitute for non-explicit modelling (factor analysis). This work investigates this issue by comparing the performance of variants of probabilistic latent variable models as well as the fusion of these classifiers. More specifically, three classification models are evaluated: probabilistic linear discriminant analysis (PLDA) [19], tied factor analysis (TFA) [20], and tied probabilistic linear discriminant analysis (TPLDA) [21]. Unlike the existing work, the evaluation is performed not only on still images but also on videos. Videos differ from still images in the much larger number of images available for each individuals and the dense face samples within the pose space. It is therefore interesting to see how such rich data benefit the recognition.
2. Research Method
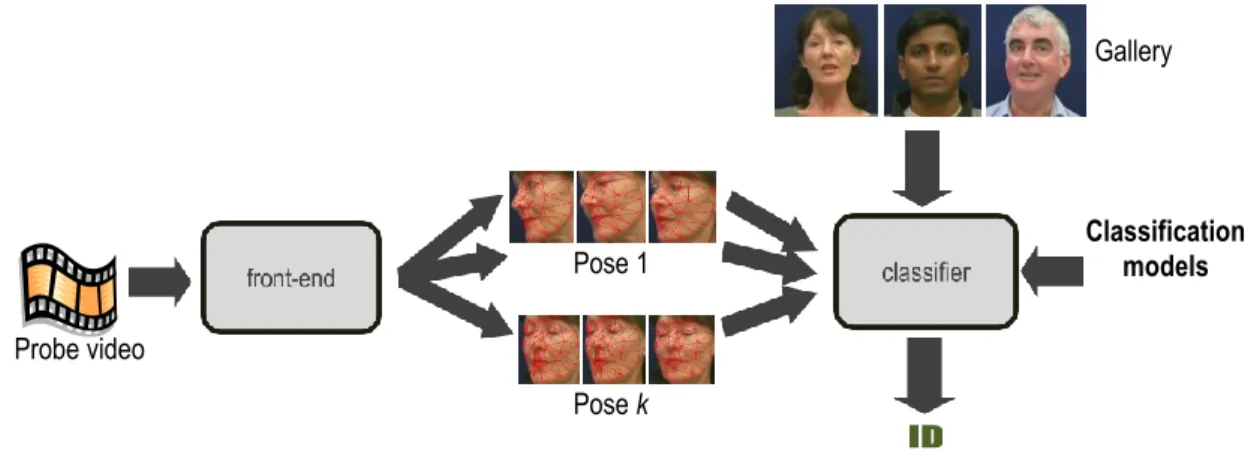
Figure 1 shows the proposed framework for face recognition across poses. The framework is composed of two components: front-end and classifier. The front-end serves to localize faces in videos, localize facial landmarks and estimate head poses, extract features, and group the features based on the estimated poses. The classifier matches probe faces, assumed to be non-frontal, against enrollment samples, which are frontal. Matching scores are computed based on probabilistic latent variable models that are constructed in the training stage. The rest of this section describes in more detail each of the processes involved in the proposed framework.
Figure 1. The proposed recognition method Probe video Pose 1 Pose k Gallery Classification models
2.1. Face and Facial Landmark Localization and Head Pose Estimation
Given a video frame as input, facial ROIs (regions of interest, i.e., bounding boxes) are localized using a combination of three Viola-Jones face detectors [22]. These detectors have been trained for three discrete poses: frontal, left-profile, and right-profile. The frontal detector is applied first and is followed by the application of the left-profile detector. If the frontal detector successfully detects a face, the left-profile detector is applied only to a small area around this detection result. The right-profile detector is executed only when the left-profile detector does not give a positive result. This procedure is able to anticipate left-right head rotations and might return multiple detection results for one particular face.
After facial ROIs have been detected, the process continues with the search of facial landmarks. We train a cascaded regression model that is able to perform simultaneous facial landmark localization and head pose estimation [23, 24]. Cascaded regression has been well known as an accurate and reliable method for facial landmark localization. In this work, the model has also been trained to handle occluded facial landmarks (for faces that rotate away from frontal). This model makes use of multiple facial ROIs as input to produce a single final output.
2.2. Face Normalization and Feature Extraction
Based on the estimated head poses, faces are classified into frontal, half-profile, and profile, which are defined as 0-20°, 20°-50°, and 50°-90° of left-right rotation, respectively. Note that faces facing to the left direction are flipped horizontally. Before appearance features are extracted, the faces are normalized and segmented.
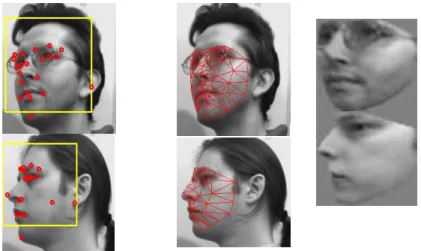
Piece-wise triangular warp is employed to normalize face images. This technique has been observed in this research to work better than the traditional procedures, i.e., similarity transforms. Piece-wise triangular warp employs point distribution models (PDMs) [25] to perform normalization. A PDM represents 2D facial meshes using a set of orthogonal basis shape-vectors.
Three PDMs are constructed for frontal, half-profile, and profile faces, respectively. Given a number of facial landmarks returned by the cascaded regression model, least square projection is performed to obtain the complete parameters of the PDMs as well as the corresponding 2D mesh. Figure 2 shows the estimated 2D meshes of different faces as well as the results of piece-wise triangular warp for the normalization. Note that a single reference mesh is used to deform (warp) all faces of a particular pose. Compared to similarity transforms, piece-wise triangular warp produces better correspondences of facial parts at the cost of losing facial shape information. The warp faces are resized into 51×51 ROIs, whose intensity values are concatenated to form feature vectors of 2601 elements.
2.3. Classification
As mentioned earlier, probabilistic latent variable models are employed in this work to match face images across poses. These include PLDA [19], TFA [20], and TPLDA [21], first proposed by Prince and colleagues. The tied models generalize the “original” models by introducing pose-specific generative transformations over the single latent identity space. More explicitly, PLDA can be described as
xij = µ + Fhi + Gwij + εij (1) while TFA and TPLDA can be expressed as
xijk = µk + Fkhi + εijk (2) and
xijk = µk + Fkhi + Gkwijk + εijk (3) respectively. The term xijk represents the j-th observation of class i in pose k. For each pose k, 4 parameters are defined: the mean µk, the bases Fk and Gk, and the diagonal covariance matrix Ʃk of εijk.
TFA and TPLDA models (analogous to PLDA) can be trained using an EM algorithm that executes two computation steps iteratively until it converges. In the expectation step, the expected values of latent variables hi and wijk are calculated for each individual i using data of the individual from all poses xij•. In the maximization step, model parameters Fk, Gk, and Ʃk are optimized for each pose k using data of the pose from all individuals x••k. Interested readers are encouraged to refer to the comprehensive discussion of this algorithm in[19-21, 26].
The trained models are used to recognize probe faces during the recognition phase. Prince and Elder [19] propose a Bayesian model comparison approach that assumes data points of the same class are generated from the same value of LIV. Given a probe xp and samples of M classes x1, x2, … , xM, there will be M generation models M1, M2, … , MM to consider. Mm represents the case where xp and xm are bound to the same LIV, which is hm, while the other samples are bound to their own LIVs. The likelihood P(xp, x1 … M |Mm, θ) can then be defined as
P(xp, x1 … M |Mm, θ) = P(xp, xm |Mm, θ)×Πi = 1 … M, i ≠ mP(xi |Mm, θ) (4) where θ is the set of model parameters. The posterior of the generation model is obtained as P(Mm| xp, x1 … M , θ)=P(xp, x1 … M |Mm, θ)×P(Mm) which is P(xp, x1 … M | Mm, θ) P(xp, xm |Mm, θ) / P(xm |Mm, θ) if the priors P(M1), P(M2), … , P(Mm) are assumed to be uniform.
In this research, only closed-set identification is considered. Classification systems will thus not be probed by individuals who are not enrolled in the systems (impostors). Furthermore, multiple enrollment samples are available for each individual. Suppose that a model θ is employed for the classification. Given a test image xp, matching score of xp and class i is computed using S(xp, xi• |θ)=maxj P(xp, xij |Mi, θ) / P(xij |Mi, θ) (matching to the nearest sample). The identity of the probe xp can then be inferred as argmaxi = 1 ... MS(xp, xi•).
In [19-21], high recognition rates have been achieved by fusing matching scores across different local areas. Inspired by this idea, this research investigates the possibility of improving performance by fusing matching scores from different classifiers. For a fusion to be successful, the fused classifiers must not be redundant. This research conjectures that PLDA, TFA, and TPLDA capture statistical properties of data that are complementary. Matching score of xp and xi under the fusion of classifiers can be expressed as:
S(xp, xi |θ1, … , θS) = Πs = 1 … SS(xp, xi |θs) (5) where θ1, … , θS are the fused classifiers. Later in the experiments, we also apply fusion across video frames f1, f2, … , fP which can be expressed as
3. Results and Analysis
Experiments are conducted to evaluate performance of different classification models. The experiments make use of enrollment samples that consist of frontal faces only. The probe faces include half-profile and profile faces.
3.1. Datasets for Evaluation
Two datasets are collected for the experiments: the VidTIMIT+UMIST dataset [27, 28] and the FERET dataset [29]. The VidTIMIT database [27] contains videos of 43 individuals who are asked to perform an extended sequence of head rotation. The rotation starts with the head facing forward, followed by facing to the right, to the left, back to forward, up, down, and finally return to forward. Three video sequences with a resolution of 512×384 are recorded from each individual in three sessions, respectively.
The UMIST database [28] contains 20 individuals, each of whom appears in various poses ranging from profile to frontal. Faces are captured as grey-scale images with a resolution of 220×220. Eighteen individuals from the UMIST database are merged with those from the VidTIMIT database to yield a total of 61 individuals. Using the merged data, three pairs of training and test sets are constructed. The training sets contain 10+24 individuals from the UMIST and the VIDTIMIT databases, respectively (randomly selected). The test sets contain the remaining 8+19 individuals from the UMIST and the VIDTIMIT databases, respectively.
The FERET database [29] contains 1199 individuals captured into 256×384 images. Each individual appears in 7 pose categories: frontal (fa/0), quarter left (ql/–22.5°), quarter right (qr/22.5°), half-profile left (hl/–67.5°), half-profile right (hr/67.5°), profile left (pl/–90°), and profile right (pr/90°). Among the 7 images of each individual, three (ql/–22.5°, fa/0, and qr/22.5°) are classified as “frontal”, two (hl/–67.5° and hr/67.5°) are classified as “half-profile”, and the other two (pl/–90° and pr/90°) are classified as “profile”. Note that faces facing to the left direction (ql, hl, and pl) are flipped horizontally. From the 1199 individuals, 319 are selected for experiments. Three pairs of training and test sets are constructed from the selected data. Each training set contains 219 individuals (randomly selected) and each test set contains the remaining 100 individuals.
3.2. Experiments using VidTIMIT+UMIST dataset
The training and the test data for these experiments are described in Section 3.1. Note that individuals used for testing are completely different from those used for training. The test data are divided into enrollment samples and probe data. The enrollment samples consist of “frontal” faces while the probe data consist of “half-profile” and “profile” faces. To detect faces, facial landmarks, and head poses from face images, the front-end described in Section 2 is employed.
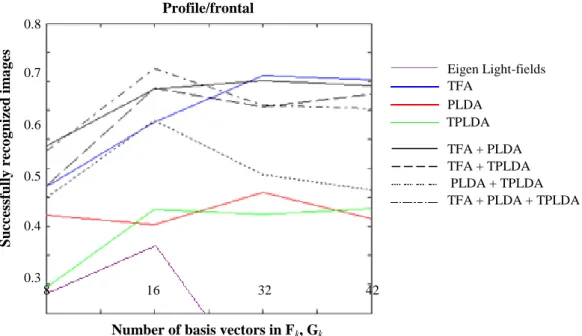
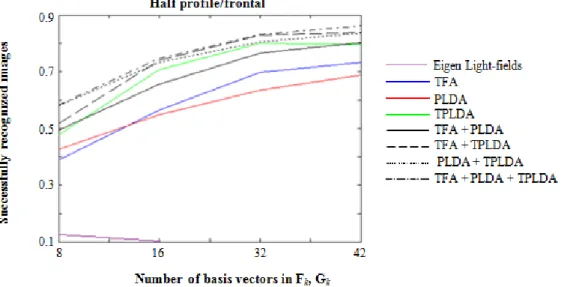
Figure 3 and Figure 4 show results of the experiments, presented in the form of the number (in percentage) of the successfully recognized images. The Eigen light-fields method is used as the baseline. When only individual classifiers are considered, TFA demonstrates the best recognition rates, i.e., 94.46 ± 0.71% and 70.95 ± 2.68% for half-profile and profile faces, respectively. TPLDA demonstrates recognition rates of 88.81 ± 2.40% and 48.10 ± 6.79% and PLDA demonstrates recognition rates of 85.67 ± 1.47% and 51.38 ± 11.87% for half-profile and profile faces, respectively. The Eigen light-fields method has become the worst performer. It should be noted, however, that the superiority of TFA doesn't apply to experiments with the FERET database (Section 3.3). TFA has therefore simply better captured statistical properties of the data than other classifiers have for this particular dataset.
Figure 3 also shows recognition results of half profile faces using fusion of classification models (Equation (5)). As can be seen from the figure, all fusion cases have better performance than the corresponding individual models, thus showing the finding that the fused models are complementary (not redundant). The highest recognition rate is achieved by the combination of the three classification models (95.57 ± 1.36%). The second highest recognition rate is achieved by the combination of TFA and PLDA, which are actually the best two individual models (95.25 ± 1.93%). Compared to recognition using individual classification models, peak performance increases from 94.46 ± 0.71% to 95.57 ± 1.36%.
Figure 3. Results of Recognition of Half-Profile Faces from the VidTIMIT+UMIST Dataset
Figure 4. Results of Recognition of Profile Faces from the VidTIMIT+UMIST Dataset
For recognition of profile faces as shown in Figure 4, fusion significantly outperforms individual classification models only for the combination of PLDA and TPLDA. When the fusion combines TFA (the best individual classification model) and other classification models, it hardly outperforms the individual models or even degrades the performance. These results therefore highlight the second requirement for a fusion to be effective: The fused classifiers should have similar individual performance (as is the case with PLDA and TPLDA). When there is too much discrepancy between the fused classifiers, the gain produced by the fusion is not enough to compensate the discrepancy between the classifiers. Figure 4 shows that the best fusion case corresponds to the combination of the three classification models. This combination reaches peak performance of 72.13 ± 8.49% which is better than the peak performance of individual models (70.95 ± 2.68%). Half profile/frontal S ucce ss ful ly re co g nized ima g es
Number of basis vectors in Fk, Gk
8 16 32 42 0.9 0.5 1.0 0.6 TFA PLDA TPLDA 0.8 0.7 TFA + PLDA TFA + TPLDA PLDA + TPLDA TFA + PLDA + TPLDA Eigen Light-fields Profile/frontal S ucce ss ful ly re co g nized ima g es
Number of basis vectors in Fk, Gk
8 16 32 42 0.7 0.3 0.8 0.4 0.5 0.6 TFA PLDA TPLDA TFA + PLDA TFA + TPLDA PLDA + TPLDA TFA + PLDA + TPLDA Eigen Light-fields
3.3. Experiments using FERET dataset
Data for these experiments are described in Section 3.1. Classification models are constructed using the training sets, each of which contains 219 individuals. Each test set contains 100 individuals that are further classified as enrollment samples (frontal faces) and probe data (non-frontal faces). To extract appearance features, faces are segmented from the background using an iterative graph-cuts procedure. The segmented faces are registered to standard templates and placed against a mid-gray background. The registration is performed using a piece-wise linear warp based on 21 manually annotated facial landmarks.
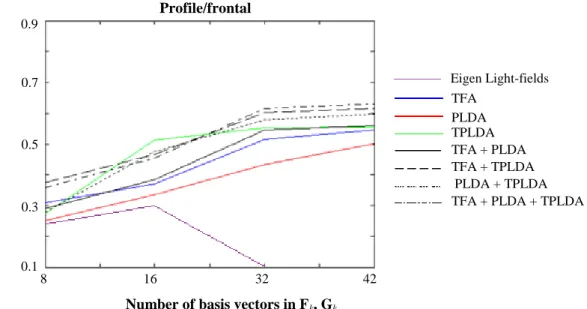
Figure 5 shows recognition results of half-profile faces using frontal faces as samples. For matching to the mean of samples: S(xp, xi• | θ) = P(xp, average(xi•) | Mi, θ) / P(average(xi•) | Mi, θ) is used to compute matching scores since it produces better results than matching to the nearest sample. TPLDA has become the best performer with a peak recognition rate of 81.50 ± 6.61%. TFA and PLDA become the second and the third best performer, respectively, demonstrating recognition rates of 73.67 ± 10.68% and 68.83 ± 2.47%, respectively. These results are thus different from those obtained from the VidTIMIT+UMIST dataset where TFA becomes the best performer followed by TPLDA and PLDA. Figure 6 shows recognition results of profile faces using frontal faces as samples. Similar to previous results, TPLDA, TFA, and PLDA have become the best, the second best, and the third best performers, respectively. TPLDA achieves a peak recognition rate of 55.50 ± 5.20%. TFA and PLDA achieve peak recognition rates of 54.50 ± 6.93% and 50.17 ± 8.28%, respectively. These results are again different from those obtained from the VidTIMIT+UMIST dataset, where TFA, TPLDA, and PLDA become the best, the second best, and the third best performers, respectively.
Figure 5. Results of Recognition of Half-Profile Faces from the FERET Dataset
Four combinations of classifiers are also evaluated in the experiments with the FERET database. Figure 5 shows recognition results of half-profile faces using the fused classifiers. As can be seen from the figure, all fusion cases give better performance than the corresponding individual models. The highest recognition rate is achieved by the combination of the three classification models (86.17 ± 3.82%). Figure 6 shows similar situations for recognition of profile faces. All fusion cases have better peak performance than the corresponding individual models, with the combination of the three models becoming the best performer (63.00 ± 5.66%). These results again highlight the finding that the tested classification models are complementary. It should also be noted that the three individual models have similar performance, explaining why the fusion is effective. Compared to recognition using individual classification models, the fusion increases peak recognition rates from 81.50 ± 6.61% to 86.17 ± 3.82% for recognition of half-profile faces and from 55.50 ± 5.20% to 63.50 ± 5.66% for recognition of half-profile faces.
From experiments on the VidTIMIT+UMIST dataset as well as on the FERET dataset, it can be concluded that fusion of different classifiers effectively improves face recognition across poses. The combinations of classifiers, however, perform differently on different datasets. It appears that when the fused classifiers differ only slightly in performance, the fused classifiers have better performance than the individual classifiers. To choose the most optimal combination of classifiers for a particular deployment, the fusion can be tested on a validation data before it is employed in the real task. Another possibility is simply fusing the three classification models altogether. It has been observed that fusion of the three models outperform the three individual classifiers most of the time.
Figure 6. Results of Recognition of Profile Faces from the FERET Dataset
3.4. Experiments on Videos
Previous experiments compute recognition rates by counting the number of successfully recognized images from test videos. Even though frames of training videos have been collectively used to construct classification models, recognition in these experiments is still performed based on still images. The reported recognition rates thus indicate only the probability of correct recognition, given a single image as input. To actually employ videos in the recognition, identities need to be inferred based on multiple images. In this section, such recognition is performed by fusing matching scores across video frames, which is also known in the literature as the decision level fusion. Two fusion methods are considered: voting and product rule (multiplying matching scores, Equation (6)).
Table 1 and Table 2 show results of the fusion on the VidTIMIT+UMIST dataset. Proba-bilistic latent variable models are trained to include 42 basis vectors and matching to the nearest sample is used to compute matching scores of individual images. For recognition of half-profile faces as shown in Table 1, fusion across video frames has given a better peak performance than using a single still image (98.77 ± 2.14% vs. 95.57 ± 1.36%, Section 3.2). The best recognition rate is achieved when TFA or combinations of TFA and other classifiers are employed together with the product rule. Note that TFA seems to be dominant whenever it is combined with other classifiers. This can be seen from the performance of the combined classifiers, which is identical to the performance of TFA alone. For recognition of profile faces as shown in Table 2, fusion across video frames has also given a better peak performance than using a single still image (81.48 ± 11.11% vs 72.13 ± 8.49%, Section 3.2). The best performance is achieved by the combination of TFA and PLDA coupled with the product rule.
Table 3 and Table 4 show results of the fusion on the FERET dataset. Compared to recognition using a single still image (Section 3.3), fusion across video frames has given better peak performance: 91.33 ± 3.21% vs. 86.17 ± 3.82% and 64.50 ± 3.54% vs. 63.50 ± 5.66% for
Profile/frontal S ucce ss ful ly re co g nized ima g es
Number of basis vectors in Fk, Gk
8 16 32 42 0.7 0.1 0.9 0.3 TFA PLDA TPLDA TFA + PLDA TFA + TPLDA PLDA + TPLDA TFA + PLDA + TPLDA 0.5
half-profile and profile faces, respectively. The best recognition rate is achieved when the prod-uct rule is applied to matching scores obtained from the combination of the three classification models. Note that voting is not tested on this dataset since there are only two probe images for each individual.
The improved performance given by fusion across multiple frames on the Vid-TIMIT+UMIST and the FERET datasets highlights the advantages of using video over single still image. The multiple observations available in videos provide additional information that can be employed to solve ambiguity in recognition.
Table 1. Frame Fusion on the Recognition of Half-Profile Faces from the VidTIMIT+UMIST Dataset
Classification Model Fusion Method Recognition Rate (%)
PLDA Voting 85.19 ± 3.71
PLDA Product Rule 86.42 ± 2.14
TFA Voting 97.53 ± 4.28
TFA Product Rule 98.77 ± 2.14
TPLDA Voting 95.06 ± 2.14
TPLDA Product Rule 95.06 ± 2.14
PLDA + TFA Voting 98.77 ± 2.14
PLDA + TFA Product Rule 98.77 ± 2.14
PLDA + TPLDA Voting 96.30 ± 0.00
PLDA + TPLDA Product Rule 95.06 ± 2.14
TFA + TPLDA Voting 97.53 ± 2.14
TFA + TPLDA Product Rule 98.77 ± 2.14
PLDA + TFA + TPLDA Voting 98.77 ± 2.14
PLDA + TFA + TPLDA Product Rule 97.53 ± 2.14
Table 2. Frame Fusion on the Recognition of Profile Faces from the VidTIMIT+UMIST Dataset Classification Model Fusion Method Recognition Rate (%)
PLDA Voting 77.78 ± 9.80
PLDA Product Rule 79.01 ± 8.56
TFA Voting 55.56 ± 9.80
TFA Product Rule 58.02 ± 13.01
TPLDA Voting 62.96 ± 11.11
TPLDA Product Rule 62.96 ± 9.79
PLDA + TFA Voting 79.01 ± 11.31
PLDA + TFA Product Rule 81.48 ± 11.11
PLDA + TPLDA Voting 59.26 ± 12.83
PLDA + TPLDA Product Rule 62.96 ± 12.83
TFA + TPLDA Voting 72.84 ± 9.32
TFA + TPLDA Product Rule 70.37 ± 9.80
PLDA + TFA + TPLDA Voting 75.31 ± 10.69
PLDA + TFA + TPLDA Product Rule 79.01 ± 11.31
Table 3. Frame Fusion on the Recognition of Half-Profile Faces from the FERET Dataset Classification Model Fusion Method Recognition Rate (%)
PLDA Product Rule 79.00 ± 11.53
TFA Product Rule 74.33 ± 6.66
TPLDA Product Rule 81.67 ± 4.93
PLDA + TFA Product Rule 88.67 ± 3.79
PLDA + TPLDA Product Rule 89.00 ± 1.00
TFA + TPLDA Product Rule 88.33 ± 4.04
PLDA + TFA + TPLDA Product Rule 91.33 ± 3.21
Table 4. Frame Fusion on the Recognition of Profile Faces from the FERET Dataset Classification Model Fusion Method Recognition Rate (%)
PLDA Product Rule 50.00 ± 18.38
TFA Product Rule 41.50 ± 12.02
TPLDA Product Rule 54.50 ± 6.36
PLDA + TFA Product Rule 55.50 ± 6.36
PLDA + TPLDA Product Rule 60.50 ± 4.95
TFA + TPLDA Product Rule 61.50 ± 9.19
4. Conclusion
This research evaluates the application of probabilistic latent variable models, namely PLDA, TPLDA, and TFA, as well as fusion of these classifiers, to face recognition across poses. Half-profile and profile faces are used as inputs to the recognition system, where frontal faces are used as enrollment samples. The evaluation is conducted using still images and videos, in particular, the VidTIMIT+UMIST and the FERET datasets are collected for this purpose.
Results of the experiments have shown that fusion of classifiers (at the decision level, i.e., product rule) generally produces better recognition performance than individual classifiers. This proves that different probabilistic latent variable models learn and capture statistical properties of data that are complementary. There is an important note, though, that fusion seems to produce clear improvement when the fused individual classifiers only slightly differ in performance. The optimal combination of classifiers also seems to vary from dataset to dataset. For the VidTIMIT+UMIST dataset, the peak performance increases from 94.46 ± 0.71% to 95.57 ± 1.36% and from 70.95 ± 2.68% to 72.13 ± 8.49% for recognition of half-profile faces and profile faces, respectively. For the FERET dataset, the peak performance increases from 81.50 ± 6.61% to 86.17 ± 3.82% and from 55.50 ± 5.20% to 63.50 ± 5.66% for recognition of half profile and profile faces, respectively.
To actually employ videos for face recognition, fusion has also been applied across video frames. Product rule and voting are used as the fusion method at the decision level. Results of experiments have shown that recognition using videos produces better performance than using single still image. For the VidTIMIT+UMIST dataset, the peak performance increases from 95.57 ± 1.36% to 98.77 ± 2.14% and from 72.13 ± 8.49% to 81.48 ± 11.11% for recognition of half-profile faces and profile faces, respectively. For the FERET dataset, the peak performance increases from 86.17 ± 3.82% to 91.33 ± 3.21% and from 63.50 ± 5.66% to 64.50 ± 3.54% for recognition of half-profile faces and profile faces, respectively.
References
[1] Li SZ, Jain AK. Handbook of Face Recognition. Springer. 2011.
[2] Ibrahim R, Zin Z. Study of Automated Face Recognition System for Office Door Access Control Application. IEEE 3rd International Conference on Communication Software and Networks. 2011; 132-136.
[3] Mazlan F, Harun A, Suliman S. Facial Recognition in Multimodal Biometrics System for Finger Disabled Applicants. Indonesian Journal of Electrical Engineering and Computer Science. 2017; 6: 638-645.
[4] Wheeler FW, Weiss RL, Tu PH. Face Recognition at a Distance System for Surveillance Applications. Fourth IEEE International Conference on Biometrics: Theory Applications and Systems. 2010; 1-8.
[5] Ekenel HK, Stallkamp J, Gao H, Fischer M, Stiefelhagen R. Face Recognition for Smart Interactions. IEEE International Conference on Multimedia and Expo. 2007; 1007-1010.
[6] Bouhou L, Ayachi RE, Fakir M, Oukessou M. Recognition of a Face in a Mixed Document. TELKOMNIKA Indonesian Journal of Electrical Engineering. 2015; 15: 301-312.
[7] González-Jiménez D, Alba-Castro JL. Toward Pose-Invariant 2-D Face Recognition through Point Distribution Models and Facial Symmetry. IEEE Transactions on Information Forensics and Security. 2007; 2: 413-429.
[8] Du S, Ward R. Face Recognition under Pose Variations. Journal of the Franklin Institute. 2006; 343: 596-613.
[9] Blanz V, Grother P, Phillips PJ, Vetter T. Face Recognition Based on Frontal Views Generated from Non-Frontal Images. IEEE Computer Society Conference on Computer Vision and Pattern Recognition. 2005; 454-461.
[10] Chai X, Shan S, Chen X, Gao W. Locally Linear Regression for Pose-Invariant Face Recognition. IEEE Transactions on Image Processing. 2007; 16: 1716-1725.
[11] Okada K, Akamatsu S, Von Der Malsburg C. Analysis and Synthesis of Pose Variations of Human Faces by a Linear PCMAP Model and Its Application for Pose-Invariant Face Recognition System. Fourth IEEE International Conference on Automatic Face and Gesture Recognition. 2000; 142-149. [12] Okada K, Von Der Malsburg C. Pose-Invariant Face Recognition with Parametric Linear Subspaces.
Fifth IEEE International Conference on Automatic Face and Gesture Recognition. 2002; 64-69. [13] Maurer T, Von Der Malsburg C. Single-View Based Recognition of Faces Rotated in Depth.
International Workshop on Automatic Face and Gesture Recognition. 1996; 176-181.
[14] Sanderson C, Bengio S, Gao Y. On Transforming Statistical Models for Non-Frontal Face Verification. Pattern Recognition. 2006; 39: 288-302.
[15] Blanz V, Vetter T. Face Recognition Based on Fitting a 3D Morphable Model. IEEE Transactions on Pattern Analysis and Machine Intelligence. 2003; 25: 1063-1074.
[16] Kim T-K, Kittler J. Locally Linear Discriminant Analysis for Multimodally Distributed Classes for Face Recognition with a Single Model Image. IEEE Transactions on Pattern Analysis and Machine Intelligence. 2005; 27: 318-327.
[17] Yang J, Frangi AF, Yang J-Y, Zhang D, Jin Z. KPCA plus LDA: A Complete Kernel Fisher Discriminant Framework for Feature Extraction and Recognition. IEEE Transactions on Pattern Analysis and Machine Intelligence. 2005; 27: 230-244.
[18] Gross R, Matthews I, Baker S. Appearance-Based Face Recognition and Light-Fields. IEEE Transactions on Pattern Analysis and Machine Intelligence. 2004; 26: 449-465.
[19] Prince SJ, Elder JH. Probabilistic Linear Discriminant Analysis for Inferences about Identity. IEEE 11th International Conference on Computer Vision. 2007; 1-8.
[20] Prince SJ, Warrell J, Elder J, Felisberti FM. Tied Factor Analysis for Face Recognition across Large Pose Differences. IEEE Transactions on Pattern Analysis and Machine Intelligence. 2008; 30: 970-984.
[21] Li P, Fu Y, Mohammed U, Elder JH, Prince SJ. Probabilistic Models for Inference about Identity. IEEE Transactions on Pattern Analysis and Machine Intelligence. 2012; 34: 144-157.
[22] Viola P, Jones M. Rapid Object Detection using a Boosted Cascade of Simple Features. IEEE Computer Society Conference on Computer Vision and Pattern Recognition. 2001; 1: I-511-I-518. [23] Cao X, Wei Y, Wen F, Sun J. Face Alignment by Explicit Shape Regression. International Journal of
Computer Vision. 2014; 107(2): 177-90.
[24] Wibowo ME, Tjondronegoro D. Gradual Training of Cascaded Shape Regression for Facial Landmark Localization and Pose Estimation. IEEE International Conference on Multimedia and Expo. 2013; 1-7.
[25] Cootes TF, Taylor CJ, Cooper DH, Graham J. Active Shape Models - Their Training and Application. Computer Vision and Image Understanding. 1995; 61(1): 38-59.
[26] Dempster PA, Laird NM, Rubin DB. Maximum Likelihood from Incomplete Data via the EM Algorithm. Journal of the Royal Statistical Society. Series B (Methodological). 1977; 1-38.
[27] Sanderson C, Lovell BC. Multi-Region Probabilistic Histograms for Robust and Scalable Identity Inference. Advances in Biometrics. 2009; 199-208.
[28] Graham DB, Allinson NM. Face Recognition: From Theory to Applications. NATO ASI Series F. Computer and Systems Sciences. 1998; 163: 446-456.
[29] Phillips PJ, Wechsler H, Huang J, Rauss PJ. The FERET Database and Evaluation Procedure for Face-Recognition Algorithms. Image and Vision Computing. 1998; 16: 295-306.