Universidade de São Paulo
2015-12
Adaptive positive selection for keystroke
dynamics
Journal of Intelligent and Robotic Systems, Dordrecht, v. 80, suppl 1, p. S277-S293, Dec. 2015
http://www.producao.usp.br/handle/BDPI/50902
Downloaded from: Biblioteca Digital da Produção Intelectual - BDPI, Universidade de São Paulo
Biblioteca Digital da Produção Intelectual - BDPIDOI 10.1007/s10846-014-0148-0
Adaptive Positive Selection for Keystroke Dynamics
Paulo Henrique Pisani·Ana Carolina Lorena· Andr´e C. P. L. F. de Carvalho
Received: 28 February 2014 / Accepted: 7 October 2014 / Published online: 26 October 2014 © Springer Science+Business Media Dordrecht 2014
Abstract Current technologies provide state of the art services but, at the same time, increase data expo-sure, mainly due to Internet-based applications. In view of this scenario, improved authentication mecha-nisms are needed. Keystroke dynamics, which recog-nizes users by their typing rhythm, is a cost-effective alternative. This technology usually only requires a common keyboard in order to acquire authentica-tion data. There are several studies investigating the use of machine learning techniques for user authen-tication based on keystroke dynamics. However, the majority of them assume a scenario which the user model is not updated. It is known that typing rhythm changes over time (concept drift). Consequently, clas-sification algorithms in keystroke dynamics have to be able to adapt the user model to these changes. This paper evaluates adaptation methods for an immune positive selection algorithm in a data stream con-text. Experimental results showed that they improved classification performance, mainly for false rejection rates.
P. H. Pisani ()·A. C. P. L. F. de Carvalho Universidade de S˜ao Paulo (USP), S˜ao Paulo, Brazil e-mail: [email protected]
A. C. P. L. F. de Carvalho e-mail: [email protected] A. C. Lorena
Universidade Federal de S˜ao Paulo (UNIFESP), S˜ao Paulo, Brazil
e-mail: [email protected]
Keywords Adaptive biometric systems·Keystroke dynamics·Positive selection·Data streams 1 Introduction
Nowadays, losses due to identity theft is an issue of growing concern, especially considering the increased data exposure caused by some services on the Internet. In view of this scenario, there is a need for enhanced authentication mechanisms, such as by the use of bio-metrics. In security area, biometrics tries to recognize users by physiological or behavioural features of the person.
Among the current biometric technologies, keystroke dynamics is a promising alternative due to several factors [14, 20]. First, it usually does not need any additional cost with hardware, as a common keyboard is enough to acquire keystroke data. In fin-gerprint or iris recognition, a specific device must be used. Second, keystroke dynamics recognition may be performed in background, while the user is typing an e-mail or entering a password. Consequently, day-to-day tasks of users are not disturbed, which may contribute to a better acceptability of this technology.
However, some questions are yet to be answered in keystroke dynamics. One of them is: how to adapt a classifier to changes in the typing rhythm of a user? Some studies have shown that typing rhythm changes over time and this may negatively impair the predic-tive performance of classifiers [12, 15]. This is an
issue dealt with by adaptive biometric systems, which tries to adapt the biometric model to these intra-class variations. Nevertheless, few studies have been carried out in this area [25].
In view of this scenario, this work evaluates adap-tation methods for user recognition by keystroke dynamics in a data stream context. Adaptation meth-ods used here are based on immune positive selec-tion. This paper extends [23] by providing further details of the evaluation methodology, inclusion of reference classification algorithms, tests on a new dataset, assessment of a modification over our pro-posed algorithm and discussion of additional results. For instance, we provided a detailed analysis of the performance through time by studying different user behaviours. This paper shows how adaptation is able to better capture concept drift by correlating user mod-els to legitimate and intruder data. Next sections are organized in the following way: in Section2, adaptive biometric systems are introduced; in Section3, stan-dard positive selection is presented, along with three adaptation methods; in Section4, we detail the evalu-ation methodology; in Section5, the experiment setup adopted in this study is defined; in Section6, results attained in the experiments are discussed; and, finally, in Section7, we present our main conclusions.
2 Adaptive Biometric Systems in Keystroke Dynamics
Intra-class variation is not an issue exclusive to keystroke dynamics. Several other biometric technolo-gies face similar variability, like fingerprint and face recognition [25]. Adaptive biometric systems try to address this issue by adapting the user model (some-times referred to asuser template) to these changes. This area is related to semi-supervised learning [26]. The problem could be formulated as: given a set of user examples (labelled examples), the algorithm has to create a user model and, afterwards, adapt it as new unlabelled examples are presented to the classifier.
As mentioned in the beginning of this paper, this area has not been widely investigated. Some rea-sons for this are [25]: the lack of publicly available datasets suitable for this type of study and the intrinsic complexity of the problem. There is a number of requirements that datasets have to meet to be use-ful for these studies. For instance, the dataset has to
contain several examples per user and these examples need to be acquired in different sessions. Some other requirements are discussed in [13].
In recent years, some datasets for keystroke dynam-ics, which may be used for user model adaptation evaluations, were released in the literature: CMU [16], GREYC [9] and GREYC-Web [10]. The last one was recently introduced, in 2012. These datasets, which are used in this paper, may contribute to expand research in adaptive biometric systems. Keystroke dynamics datasets, like the ones mentioned here, are based on time features, which are extracted from the instants when keys are pressed and released. As a result, examples are real-valued vectors.
Keystroke dynamics has been studied for several years. One of the first results in the area was published in 1980 [6]. Most of the studies in keystroke dynam-ics deals with static user models (without adaptation over time). Different machine learning algorithms have been used in this context, such as support vec-tor machines [18], artificial neural networks [31] and random forests [1].
There are some studies which discussed how to adapt the user model in keystroke dynamics. In [15], two approaches based on the concept ofgallerieswere investigated, namedgrowing windowandmoving win-dow. Later, in [12], approaches proposed in [15] were further studied. Both studies analysed onlyfixed texts, also named static texts or transcription, where all users type the same pre-defined text. Another work evaluated the adaptation in a free textscenario [19], also named dynamic texts, where each user can type any text. Here, we considered only static text as it reached improved performance in previous work in the area [3].
Next sections describe the immune positive selec-tion algorithm. After presenting the static (original) versions, we present three adaptive methods:Growing, Sliding and Usage Control, for an immune positive selection based algorithm.
3 Positive Selection
Artificial immune systems are computational systems inspired by the natural immune system and applied to solve various problems [2]. These systems have been employed in several applications related to pattern recognition, anomaly detection and optimization. This
Fig. 1 Positive selection algorithm [28] (figure adapted from [21])
work focuses on anomaly detection, which involves recognizing whether examples presented to the algo-rithm belong or not to a given legitimate user.
Among different immune algorithms, this paper deals with positive selection. A key algorithm of this class is the Self-Detector [28], which is used in this work. During thetraining phase, this algorithm sim-ply copies all the training examples and uses them as detectors. Each detector has a radius assigned, defining a hyper-sphere. Afterwards, in thematching phase, when an input example is presented, all detec-tors are tested against this example. If any detector matches the example, it is classified asself(legitimate user) and, otherwise, asnon-self (intruder). A detector matches an example if the distance between its cen-ter and the example is less than its radius. Figure 1
summarizes howSelf-Detectoralgorithm works. The original version of this algorithm uses a ROC analy-sis to define the self radius. In this paper, however, we used a different approach to define it, as discussed in Section5.
3.1 Adaptive Model
In order to makeSelf-Detector adaptive, we adopted the model presented in Fig. 2. The basic idea is to decide whether or not to change the detector set when a new example is matched by the algorithm. It is important to highlight that the adaptive process only occurs when an example is classified as positive.
Three alternative methods to adapt the model in immune positive selection are discussed in the next Fig. 2 Adaptive positive
selection algorithm (adapted from [23]). Detectors may change when an example is classified as Self (notice theadaptation process in the figure)
sections:Growing,SlidingandUsage Control.
Grow-ing and Sliding methods are based on the work
reported in [15] and [12].Usage Control was intro-duced by our work published in [23].
3.2 Growing and Sliding Methods
In the Growing version, each example classified as positive (from the legitimate user) is included in the classification model as a new detector. Consequently, the number of detectors in theGrowingmethod only grows, as the name suggests. Another problem is that detectors generated from wrongly classified examples will never be removed from the classification model. TheSlidingversion also includes examples classified as positive in the detector set. However, in contrast to theGrowingapproach,Slidingdiscards the oldest detector from the classification model when a new detector is added. This makes the amount of detectors constant and is, therefore, more efficient thanGrowing with regard to memory usage.
Although the approach proposed in [15] is similar to the wayGrowingandSlidingare used here, it is not exactly the same. As mentioned in [7] and [11], the work of [15] dealt with a supervised scenario, where only true legitimate examples are used for adapta-tion. In another study, [12] considered an adaptation method without knowing the true labels, called a semi-supervised setting by the authors. Nonetheless, they used a different classification algorithm, even though their approach is closer to what was done here. 3.3 Usage Control
The third method investigated, Usage Control, eval-uates which detectors are used more often in order to decide whether to keep them in the model mem-ory. Each detector has two additional attributes, whose values are defined as follows:
– Usage Count: increases every time an example is matched by the detector.
– Recent Usage: decreases every time another
detector matches an example. If a detector matches an example, it resets to a maximum value (here we adopted the value 10). When the detector is created, it assumes the maximum value. If a detector matches an example, these two attributes have their values updated. Afterwards, all
detectors with Recent Usage = 0 are ordered by Usage Count. The detector with lowestUsage Count is removed and a new detector is added to the set of detectors in the classification model.Usage Count makes the algorithm just remove detectors with low usage and Recent Usageguarantees that new detec-tors are not removed instantly (as theirUsage Countis zero when created). If there is no detector withRecent Usage equals to zero, no adaptation occurs and the recognized example is discarded.
In order to determine the detector which matches the example, detectors are checked from the oldest to the newest one in Usage Control. However, this increases the likelihood that older detectors are used and have their counters updated. In this paper, we also investigate a version which adopts the opposite check-ing order: from the newest to the oldest, calledUsage Control Rin this paper.
The procedure of keeping examples in memory and replacing them according to their usage was also discussed in the context of biometrics in a technical report [27]. In that work, three approaches that explicit deal with the usage of examples are presented: LFU (least frequently used), LRU (least recently used) and Extended replacement algorithm. These approaches are inspired by cache management. However, that work did not execute tests to evaluate the performance of the presented approaches. Later, another work eval-uated LFU along with other replacement strategies [5].
Although the replacement of examples based on usage of [27] may seem similar to Usage Control, there are some fundamental differences between them. In all three approaches from [27], authentication is performed using the nearest neighbour. In the most common strategy, all examples in memory must be scanned. Usage Control is based on Self-Detector, which does not necessarily scans all detectors to clas-sify an example. One detector matching the input example is enough toSelf-Detector.
Apart fromUsage Controlbeing potentially faster for classification, this behaviour difference affects how the matching detector is chosen, which will have its counters updated. For instance, given a new input example, a detector less similar to it than another one may have its counters updated, while the other detector does not. As a result, detectors that are more similar can eventually be eliminated, what may be seem as a problem in a first analysis. However, it is
important to remember that when the detector set is updated, a new detector is included using the input example. As a consequence, this problem is reduced.
During the description of LFU, the study of [27] claims that this approach is not totally suitable to replace examples in memory. If an example is used too many times for a period, it will not be easily replaced, even if it does not represent the current behaviour of the user. This is due to its high value of usage frequency. The authors suggested that this problem could be reduced if the replacement is done periodi-cally, but the authors do not detail how to perform this procedure.
Conversely, Usage Controlmitigates this problem with the inclusion of a recent usage counter. If a detec-tor was not recently used, it can be eliminated even with a usage count higher than that of other detectors. Another related problem is that new detectors may be removed right after their inclusion in LFU, since their usage count is very low when inserted. InUsage Control, the recent usage counter also contributes to avoid this problem. Every time a new detector is cre-ated inUsage Control, it is flagged as being recently used (recent usage assumes the maximum value). As a result, new detectors are not instantly removed in Usage Control.
In the same report, the authors also present LRU, without presenting implementation details. However, they claim that it may involve high computational cost because it needs to store what was used and when. This is a problem in cache management, which needs very high efficiency, but may not be a critical issue in biometrics. In order to approximate the effect of LRU, theclock algorithmis presented. This algorithm keeps a circular list and controls recent usage moving a pointer over this list (similar to a clock).
The third algorithm which deals with example usage in [27] is theExtended replacement algorithm. This algorithm associates a measure of relevance to each example in memory, which is then used for choosing which example is replaced. By definition, this measure combines both LFU and LRU. How-ever, the combination of everything into a single measure leads to some limitations. For instance, it inherits some problems from LFU, like the difficulty to remove examples used with high frequency of usage even if it does not represent the current user behaviour. Although Extended replacement algorithm reduces this problem, it is still present.
As discussed earlier, this problem is mitigated by Usage Control, which has two counters: one for fre-quency of usage and another for recent usage. Thus, even detectors with high frequency of usage (and higher than other detectors) may be eliminated first if the recent usage count reaches zero. Apart from the various differences between Usage Control and approaches in [27] previously discussed, it is impor-tant to highlight that if all detectors inUsage Control have been recently used, the detector set is not modi-fied. Hence, if the detector set is still representative, no adaptation is performed. Approaches in [27], however, always perform replacement.
4 Evaluation Methodology
In order to evaluate the adaptive algorithms, we fol-lowed the methodology described in this section. This methodology is based on the one presented in [21], but adapted to a data stream context.
4.1 Parameter Tuning
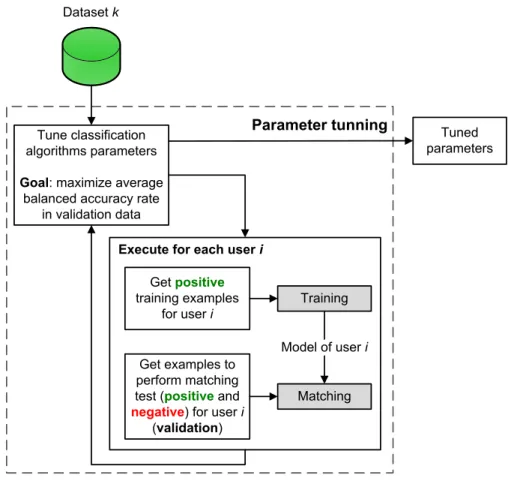
First, we tune the parameters of the classification algo-rithms following the diagram presented in Fig.3. The inclusion of a parameter tuning step in our evalua-tion methodology is not intended to obtain the optimal parameter values, but to allow the assessment of all algorithms under similar conditions.
Parameter tuningis performed using the first exam-ples of all users. As this work deals with one-class classification, only examples from the legitimate user (positive examples) are available for training. Conse-quently, training and matching processes are executed per user and, after processing all users, an average accuracy rate (balanced) is obtained. This procedure of training and matching is executed for different parameter values, experimentally defined by trial and error. The parameter tuning steps look for the com-bination of parameter values which maximizes the average balanced accuracy rate of the classification algorithm. The balanced version of the accuracy rate along with a discussion why we chose it is seen in Section 4.3. As shown in Fig. 3, for each user i, the tuning process uses positive training examples, positive matching examples and negative matching examples. Figure4illustrates a hypothetical example of how examples are divided for user 1 (i=1).
Fig. 3 Parameter tunning
As described in Fig. 4, first examples from user 1, which is the legitimate user (positive) in this case, are used as positive training examples. Remaining examples are used for assessing positive matching. All examples from the other users in the same range are used for assessing negative matching. The same procedure is applied for all users.
The process described here also uses negative examples, although it does not use the entire test data. It was done due to the difficulty to tune the parameters of the learning algorithms using only positive exam-ples. For example, the frontier between positive and negative cannot be easily determined only by looking at examples from one class (the positive class in this
Fig. 4 Parameter tuning window
case). However, it is important to emphasize that only the first examples of each user are used in the param-eter tuning. It may also not be possible to use negative examples in some situations, but procedure is closer to a practical scenario than using all test data.
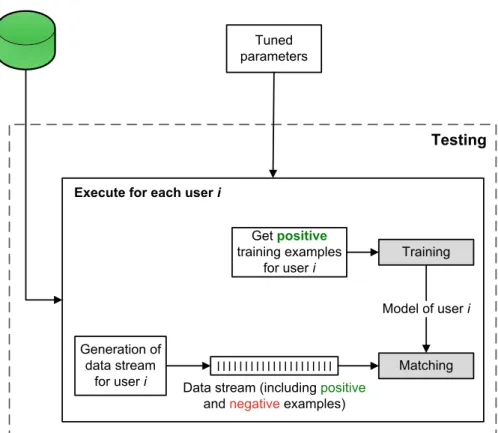
4.2 Testing
After parameter tuning, the test is finally performed, as shown in Fig.5. As previously discussed, we con-sidered a one-class scenario and, as a consequence, training and matching processes are executed per user. This scenario implies that only positive examples are available for training. In testing phase, training is performed using only positive examples from the parameter tuning phase, including those used for vali-dation.
Matching test is then executed by a data stream generated per user. This data stream is composed by all examples from the legitimate user interleaved with examples randomly selected from other users (intruders). Consideringpi a positive example
(legit-imate user) and nj a negative example (intruder), a
hypothetical stream could bep1,p2,n1,p3,n2,p4. A rate of positive/negative examples must be defined to generate the data stream. In [12], the stream had 30 % of negative examples in a keystroke dynamics scenario. The same value was adopted here. Addi-tionally, during the generation of the data stream, the order in which the examples appear in the datasets are preserved. This is a relevant aspect, as it allows the verification of concept drift in the biometric profile. Another important consideration is that all positive examples used either in parameter tuning or training for a given user (first examples in the sequence) are not included in the data stream generation of that user (testing phase).
The generated data stream is presented to the classifier, example by example, to perform matching (recognition). In order to make experiments closer to a practical biometric scenario, the classifier does not receive the true label of those examples. As our testing model does not provide the true label, user models must be updated in a unsupervised setting. Training, data stream generation and matching test are performed for each useriin the dataset.
4.3 Evaluation Measures
In this work, we adopted the following common eval-uation measures in biometrics to assess predictive performance:
– FAR (False Acceptance Rate): measures the per-centage of times that an intruder is erroneously accepted as being legitimate;
– FRR (False Rejection Rate): measures the per-centage of times that a legitimate user is wrongly rejected;
– Balanced accuracy rate: measures the percentage of correct classifications attained by the algo-rithm. This work uses the balanced version, which gives the same weight for positive and nega-tive classifications. It is defined as 1−(F AR+ F RR)/2. Due to imbalance between positive and negative examples (generated data stream has 30 % of negative examples), the standard accuracy measure would be around 70 % for a classifier which classifies everything as positive. It could be wrongly understood as a good result. In the balanced version, however, the result would be 50 %, which is clearly not a good predictive performance.
Several papers in biometrics report experimental results in terms of EER, which represents the algo-rithm adjustment that yields the same value for FAR and FRR. To the best of our knowledge, it is only possible to reach this adjustment by evaluating the classifier on the test data, using the true labels. Con-sequently, the reported results may not represent a practical scenario, because it would not be possible to use test data. Moreover, it can possibly overesti-mate results. A related issue was raised in [7]. In their
work, it was also mentioned that parameter values may change between test sessions. They suggested report-ing FAR and FRR for a given parameter configuration. Even though, EER may be a suitable measure in other evaluation scenarios.
As previously discussed, training and matching processes are executed per user. As a consequence, experimental results are obtained per user too. Tables and graphs reported here consider an average perfor-mance among all users. Apart from that, as data stream generation is stochastic (examples from intruders are interleaved randomly), we executed all experiments 30 times and reported average results (standard deviation is also reported).
Another important consideration in a data stream context is whether the performance evaluation occurs globally or at different instants in the sequence of examples. The work of [24] claims to be the first paper to report biometric performance measures over time. When measures are reported over time, it is possible to assess whether performance drops, rises or stays the same for newer examples. In addition to showing global measures, we also reported performance mea-sures at different instants in the sequence of examples, as shown in Fig. 6. This figure considers, for sim-plicity, that the stream was divided into three parts, although we divided into five parts in our experiments, as discussed in Section6.2.
5 Experimental Setup
5.1 Datasets and Extracted Features
In the experiments performed for this study, predictive performance was assessed using three datasets:
Fig. 6 Evaluation measures: global and over time
– GREYC [9]: 100 users typed the expression “greyc laboratory” in at least five sessions, dur-ing a period of two months. Considerdur-ing these 100 users, there are near 7,000 examples available in GREYC dataset.
– CMU [16]: 51 users typed the password “.tie5Roanl” plus Enter key 400 times in eight sessions. Considering all users, a total of 20,400 examples are available in this dataset.
– GREYC-Web [10]: 118 users contributed to this dataset, some of them for more than 1 year. For this study, the updated version was used, as avail-able in their website. Free text and transcription examples are available, however, only the tran-scription of the login part was considered in this paper, because it is closer to the setup of the other two datasets (CMU and GREYC). Addition-ally, we filtered the users with less than 100 valid examples, resulting in data for 35 users (a total of more than 7,000 examples).
Main aspects of these datasets are summarized in Table1.
As discussed in [10], CMU and GREYC were regarded as the only ones available which could
Table 1 Summary of datasets used in this paper ([8,9,16])
GREYC CMU
No. of users 100 51
No. of examples 67.49 400
(avg per user)
Expression “greyc laboratory” “.tie5Roanl” +Enterkey
No. of characters 16 11
Age (years) 19 - 56 18 - 70
Gender (aprox.) 73 % (males) / 59 % (males) / 27 % (females) 41 % (females) GREYC-Web
No. of users 35 No. of examples 213.26 (avg per user)
Expression “laboratoire greyc” No. of characters 17
Age (years) 19 - 39 Gender (aprox.) 71 % (males) /
29 % (females)
provide statistical significant results in keystroke dynamics. A more recent dataset is GREYC-Web, released in that publication, was also used here.
Apart from the key itself, keystroke data usually provides the instant in which eachkeyis pressed and released. From these data, a number of features can be extracted. In this paper, we used the featureflight timetype 1 [30], which is one of the most used fea-ture in previous work, according to our review in [22]. In Fig.7, we show this feature graphically, which is the time difference between the instants when akeyis released and the nextkeyis pressed.
In GREYC, CMU and GREYC-Web datasets, the extraction of flight times results in a feature vector with 15, 10 and 16 dimensions for each example, respectively. We appliedrank transformationover the extracted feature vector in order to improve the clas-sification performance ofSelf-Detectors, as presented in [21]. This procedure basically associates a rank to each attribute of the feature vector and uses the ranked vector as the feature vector (the final vector is rescaled to [0;1] range, dividing all values by the maximum rank).
5.2 Reference Algorithms
Apart from the immune algorithms, we also used a reference algorithm from the keystroke dynamics literature: [Magalhaes et al. [17]. We included this algorithm because it was used in a recent work [12] to assess keystroke dynamics in an adaptive context. Two versions of this algorithm are used in this study, the standard (original), which is not adaptive, and a more recent adaptive version, which uses a method proposed by [12]. These two versions are described in this section.
The standard version of this algorithm, called
M2005 here, compute some statistics over
train-ing examples (mean, median and standard devia-tion) for each dimension of the feature vector [17]. These values represent the user model. Afterwards,
in the matching phase, this algorithm verifies each dimension of the given example to check if it meets conditions (1) and (2), in whichdiis the value of the
dimensioniin the given example andmean,median
andstdare the mean, median and standard deviation of the dimensioniin the training examples.
min(mean;median)∗(0.95−std/mean) <=di (1)
di<=max(mean;median)∗(1.05+std/mean) (2)
For each dimensioniwhich satisfies conditions (1) and (2), the algorithm computes a sum according to the following rules:
– ifdiis the first dimension, 1.0 is added to the sum;
– ifd(i−1)does not meet (1) and (2), 1.0 is added to
the sum;
– ifd(i−1)also meets (1) and (2), 1.5 is added to the
sum.
After verifying all dimensions, the algorithm com-putes a score using Eq. 3, in which max sum is defined as 1.0+1.5∗(dimension count−1.0).
Score=sum/max sum (3)
For the classification of a new example, if the computed score is higher than a given threshold, the example is classified as positive (legitimate user) and, otherwise, as negative (intruder).
A suitable adaptive method for this algorithm was proposed in [12]. The method consists of retraining the classification algorithm to adapt the user model over time. The proposal was based on ideas from [15]. In their work, a method which reached good performance wasDouble Parallel. The classification algorithm cited in their tests wasM2005described in this section.
Double Parallel keeps two user models in
mem-ory: one generated using growing window and another one using sliding window. In growing window, all training examples are stored in memory. Afterwards, in the matching phase, any example recognized as positive (legitimate user) whose score is higher than an update threshold is added to the set of examples. The classification algorithm is then retrained on the updated training set. Sliding window procedure fol-lows a similar procedure, but it also removes the oldest training example before retraining the algorithm. As Double Parallel keeps two user models, the testing example is presented to both models, producing two score outputs. The version we used here computes the average between both scores and use it to perform classification.
An important consideration regardingDouble Par-allelis that its memory usage grows without limit over time. It is a consequence of the use of a model induced by growing window method.
5.3 Parameters
Five variations of Self-Detector (immune positive selection) are used here: No adaptation (standard),
Growing, Sliding, Usage Control and Usage
Con-trol R. Self radius assumed the value 0.02 for
CMU, 0.05 for GREYC and 0.04 for GREYC-Web after the parameter optimization process presented in Section 4.1. Self-detectors used cosine similarity [29] to calculate distances as discussed in [23]. The formula used here is shown in Eq.4.
cosine dist (x, y) =1− d i=1xiyi d i=1x2i ∗ d i=1yi2 (4)
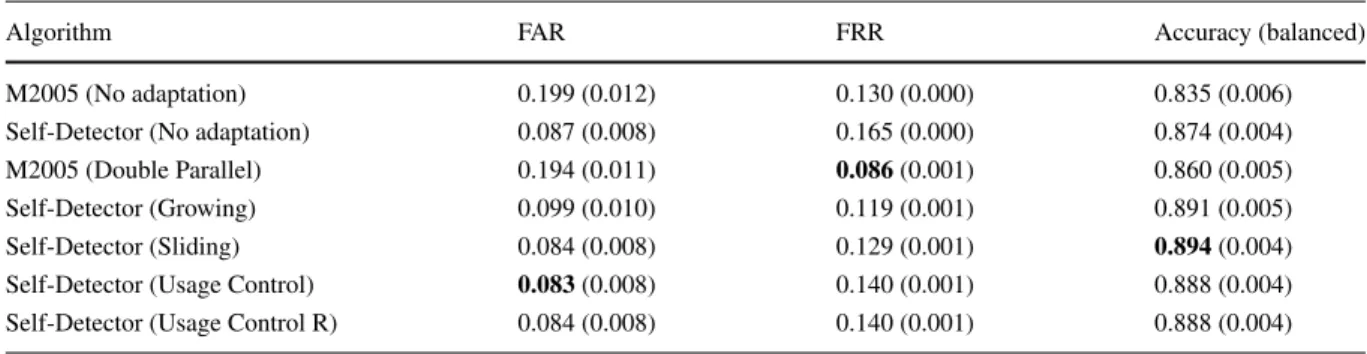
Table 2 Results in GREYC dataset
Algorithm FAR FRR Accuracy (balanced)
M2005 (No adaptation) 0.199 (0.012) 0.130 (0.000) 0.835 (0.006)
Self-Detector (No adaptation) 0.087 (0.008) 0.165 (0.000) 0.874 (0.004)
M2005 (Double Parallel) 0.194 (0.011) 0.086(0.001) 0.860 (0.005)
Self-Detector (Growing) 0.099 (0.010) 0.119 (0.001) 0.891 (0.005)
Self-Detector (Sliding) 0.084 (0.008) 0.129 (0.001) 0.894(0.004)
Self-Detector (Usage Control) 0.083(0.008) 0.140 (0.001) 0.888 (0.004)
Self-Detector (Usage Control R) 0.084 (0.008) 0.140 (0.001) 0.888 (0.004)
Table 3 Results in CMU dataset
Algorithm FAR FRR Accuracy (balanced)
M2005 (No adaptation) 0.195 (0.003) 0.451 (0.000) 0.677 (0.002)
Self-Detector (No adaptation) 0.272 (0.003) 0.410 (0.000) 0.659 (0.001)
M2005 (Double Parallel) 0.066(0.004) 0.378 (0.004) 0.778(0.002)
Self-Detector (Growing) 0.518 (0.005) 0.122(0.004) 0.680 (0.003)
Self-Detector (Sliding) 0.240 (0.006) 0.211 (0.003) 0.775 (0.004)
Self-Detector (Usage Control) 0.308 (0.006) 0.212 (0.004) 0.740 (0.004)
Self-Detector (Usage Control R) 0.266 (0.007) 0.220 (0.004) 0.757 (0.004)
Best results are highlighted in bold. Values between parenthesis are the standard deviation for each measure For the reference algorithms, the threshold assumed
0.6 for GREYC and GREYC-Web datasets, and 0.7 for CMU in our parameter optimization process. As these reference algorithms were originally designed to work with raw data, we did not apply rank trans-formation forM2005. Additionally, according to our experiments, there was no performance gain by using rank transformation for this algorithm.
Parameter optimization was used only in thestatic (no adaptation) versions of the algorithms. The adap-tive counterparts then assumed the same parameter values. ForDouble Parallel, we considered the same threshold values for matching and updating.
6 Experimental Results
This section reports the experimental results obtained in the experiments using the three datasets (GREYC, CMU and GREYC-Web) and analyses the predictive performance of the investigated algorithms for these datasets.
6.1 Accuracy, FAR and FRR
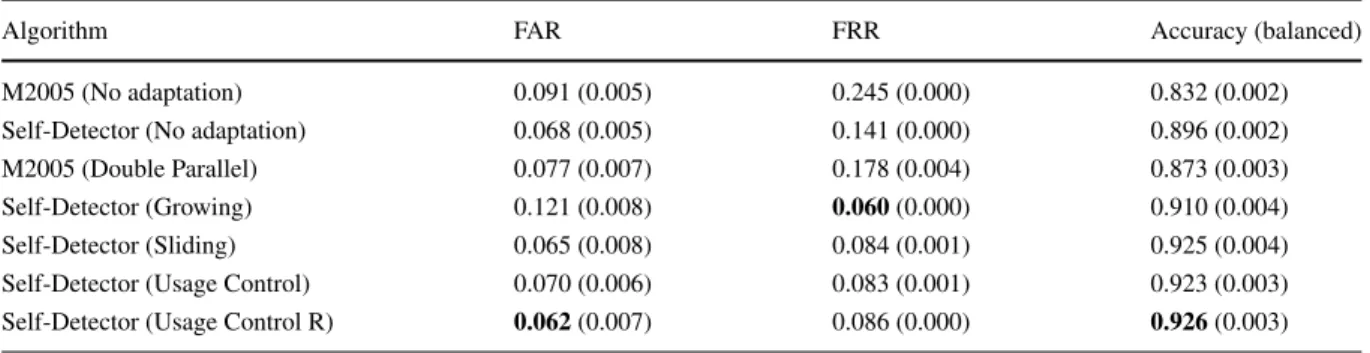
Tables 2, 3 and 4 show overall predictive perfor-mance values for all adaptation methods in GREYC, CMU and GREYC-Web datasets. Based on the values in these tables, all adaptation methods attained bet-ter accuracy values compared to when no adaptation method is used, for both Self-Detector and M2005. This is mainly caused by the reduction in false rejec-tion brought by the adaptarejec-tion of the user model through time. This indicates that concept drift occurs in keystroke data and that model update has a key impact on its predictive performance.
For the CMU dataset, the reduction in false rejec-tion rate was larger than for GREYC dataset. This may be explained by the fact that there are more examples in the CMU data stream. Considering a scenario with 30 % of negative examples, CMU data streams have approximately 514 examples per user, while GREYC data streams have 28 examples (for users with less examples). Hence, there is more room for changes in the typing rhythm in the CMU dataset, making the
Table 4 Results in GREYC-Web dataset
Algorithm FAR FRR Accuracy (balanced)
M2005 (No adaptation) 0.091 (0.005) 0.245 (0.000) 0.832 (0.002)
Self-Detector (No adaptation) 0.068 (0.005) 0.141 (0.000) 0.896 (0.002)
M2005 (Double Parallel) 0.077 (0.007) 0.178 (0.004) 0.873 (0.003)
Self-Detector (Growing) 0.121 (0.008) 0.060(0.000) 0.910 (0.004)
Self-Detector (Sliding) 0.065 (0.008) 0.084 (0.001) 0.925 (0.004)
Self-Detector (Usage Control) 0.070 (0.006) 0.083 (0.001) 0.923 (0.003)
Self-Detector (Usage Control R) 0.062(0.007) 0.086 (0.000) 0.926(0.003)
difference between static and adaptive models more evident.
Comparing the adaptive methods forSelf-Detector regarding accuracy rate, the Slidingmethod reached best values in almost all cases. This indicates that the use of newer examples from the legitimate user in the adaptation process is a good strategy. Usage Controlalgorithms obtained the second best predictive performance (in GREYC and GREYC-Web datasets), showing that keeping the most used detectors and switching the least used by new ones is also a suit-able strategy for adaptation.Usage Control Rshowed to be slightly better than its previous version, sug-gesting that checking detectors from the newest to the oldest, in order to prioritize new detectors, is a better strategy than checking from the oldest to the newest.Growingalso improved the predictive perfor-mance, however, for the CMU dataset, the benefit of adaptation was not as clear as in the case of Usage ControlandSliding.Double Parallelobtained the best results in the CMU dataset, but not significantly better than Sliding Self-Detector. Nonetheless, in GREYC and in GREYC-Web, its accuracy was worse than Self-Detectorwithout adaptation, although still better than standard M2005. The fact that Double Parallel per-forms better than M2005 without adaptation was also observed in [12].
Concerning false acceptance, Sliding and Usage Control(both versions) achieved similar performance for GREYC and also for GREYC-Web, but, for CMU, Slidingperformed better. This may be explained by the fact that most used detectors not necessarily detected only true positive examples. In some cases, most used detectors may have wrongly recognized intruder examples as being from the legitimate user, contribut-ing to a larger FAR. Usage Control R managed to reduce FAR in CMU and GREYC-Web datasets com-pared to its first version. In the CMU dataset,Double Parallelattained the lowest FAR values, showing that for M2005algorithm, the adaptive method was also important to decrease the number of wrongly accepted intruders.
Still in terms of FAR,Growingreached worst clas-sification results in CMU and GREYC-Web. This adaptation method only grows the number of detectors and, therefore, does not eliminate outdated detec-tors. Consequently,Growingadapts the classification model to new typing patterns from the legitimate user, but does not forget outdated patterns. In addition, a
detector wrongly generated by an intruder example will never be eliminated, asGrowingdoes not remove any detectors. In summary, the number of accept-able typing patterns grows through time, increasing the acceptance rate for both cases: legitimate users and intruders. In fact, lower FRR values and higher FAR were obtained by the Growingmethod. In the CMU dataset, this effect is clearer, where the Grow-ing method achieved a FAR higher than 50 %. This is a poor classification result, since more than a half of intruder attempts were wrongly accepted as being from the legitimate user.
6.2 Performance Over Time
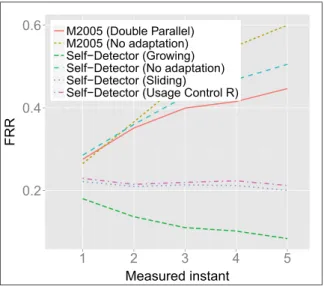
We also analysed accuracy, FAR and FRR over time. In order to do that, we divided the data stream of the testing phase in five parts for each user and calculated the average of performance measures (as discussed in Section 4.3). Since the stream has on average more examples in the CMU dataset, we only show graphs for this dataset, without losing generality as we observed in last section that tendencies have similar-ities in the datasets. In addition, onlyUsage Control R is analysed here and in the next sections, because its balanced accuracy was higher than its previous ver-sion. This avoids an excessive number of algorithms in the graphs, which would not contribute much to the analysis. Figures8,9and10show accuracy (bal-anced), FAR and FRR measured through the stream, respectively. In these figures, we can see the impact of concept drift on each adaptation method.
As expected, when there is no adaptation, per-formance drops through time. In the first instants, accuracy of static approaches are close to the adaptive methods. This good performance, however, rapidly decreases as detectors become outdated. As seen in Fig.10, false rejection is the measure that was more affected by the use of an adaptive method. Even Dou-ble Parallel, which increases FRR over time managed to improve it when compared to standard M2005 alone.
The results show that, among the three adaptation methods for Self-Detector, the Sliding method pre-sented the best classification accuracy over time, fol-lowed by theUsage Control Rmethod. As discussed earlier in this paper, the Growingmethod has a ten-dency to present high FAR values. Figure9illustrates how this problem becomes worse as later examples
Fig. 8 Accuracy (balanced)
are presented. Consequently, performance ofGrowing method rapidly decreases over time, although it still achieves better accuracy than both algorithms without adaptation most of the time.Double Parallelreached a good performance over time too. However, an inter-esting aspect is thatM2005both standard andDouble Parallel versions had a higher rate of performance decrease through time when compared to the immune algorithms.
In order to evaluate the statistical significance of the experimental results, we applied the Friedman statistical test [4] to evaluate the differences in the accuracy rate, FAR and FRR obtained by the different methods. According to this test, there are significant differences between the experimental results only for accuracy and FRR (p-value < 0.10). Even though, with the exception ofGrowingmethod, all other adap-tive algorithms performed consistently better than their static counterparts.
6.3 Effect of Adaptation on Detectors
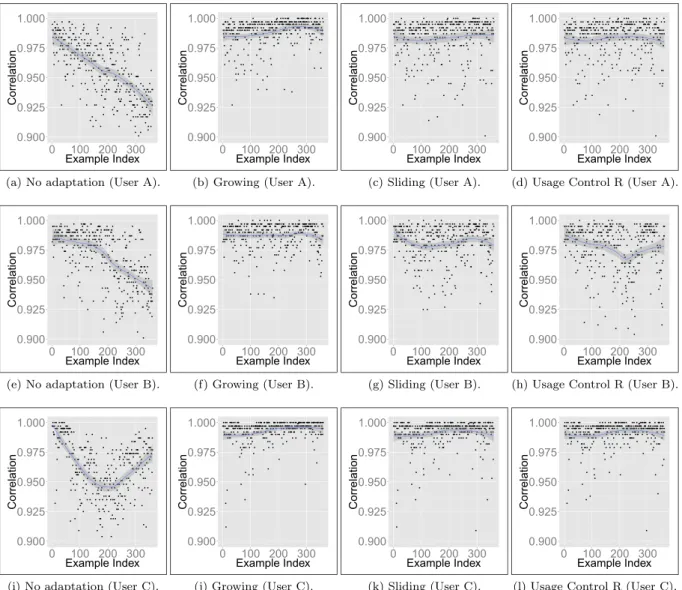
In addition to the predictive performance analysis from the previous sections, we also performed a detailed analysis on the behaviour of the evaluated methods, investigating the effect of the adaptation methods on the detectors. As only Self-Detector is based on the idea of detectors, both non-immune ref-erence classification algorithms were not included in this analysis. Figures 11 and 12 show the value of
Fig. 9 FAR
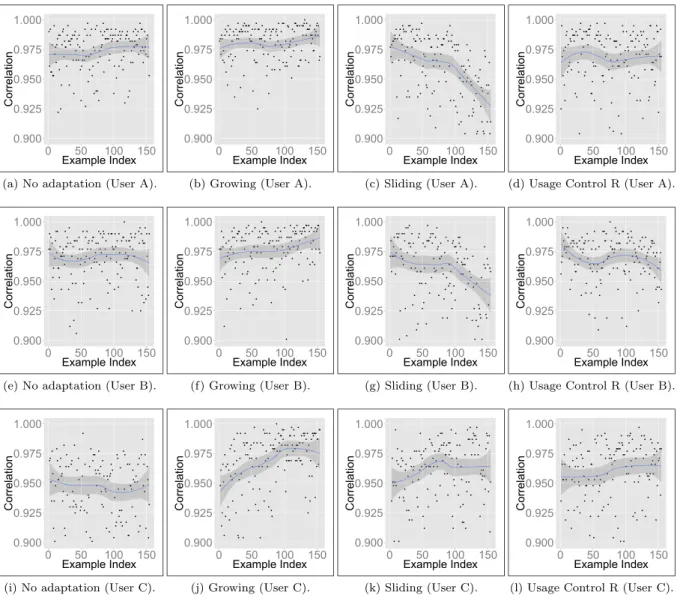
the maximum correlation obtained among all detec-tors given an example in the stream (the detector with the highest correlation is the one closest to the input example). Two versions of these graphs were plotted: Fig. 11 for true positive (legitimate user) examples only and Fig.12for negative (intruder) examples only (the tendency is shown by the line in the shaded area). These graphs consider data for three different users in CMU as it would impracticable to show graphs for every user due to space constraints. These partic-ular three users were selected due to their different
Fig. 11 Effect of different adaptation methods on the POSITIVE examples
characteristics, mainly when no adaptive method is used. For instance, we see in Fig. 11 that user A steadily decreases correlation values over time, user B has a period of stability before decreasing correla-tion values and user C decreases then tends to increase correlation values. There may be other behaviours, but the goal is just to show how adaptive approaches performed on different cases. As seen in previous sections, on average, adaptive versions improved pre-dictive performance over static algorithms.
In Fig.11, it is possible to see the effect of the adap-tation methods. Highest values are better, since they represent correlations between the detector set and
legitimate user examples. In no adaptationscenario, the maximum correlation steadily decreases, showing that true positive examples became distant to the initial set of detectors. The exception was user C, which may be understood as arecurrent drift. In this case, the user patterns changed and, after a while, had a tendency to return to its original state. Even in this case, all three adaptation methods successfully managed to main-tain their maximum correlation values more stable by automatically updating the set of detectors.
Negative correlations are shown in Fig.12. In con-trast to Fig. 11, lowest values are better now, as they refer to correlations between the detector set
Fig. 12 Effect of different adaptation methods on the NEGATIVE examples
and intruder examples. As shown in the graphs, the Sliding method decreased negative correlations for users A and B. Even no adaptation was similar to some adaptation methods. This may explain why false acceptance had less improvement by adaptation when compared to other performance measures discussed here, like FRR. Another important observation con-cernsGrowingadaptation, which has highest negative correlation values in the graphs, which may imply in the highest FAR values attained by this method. Forno adaptationandGrowing, the tendency was similar for all users, butSlidingandUsage Control Rfollowed a different behaviour for user C. The recurrent drift seen
in the positive correlation graphs may have caused it too. Even though, negative correlation values in the end of the stream were better in Slidingand Usage Control Rmethods when compared toGrowing.
7 Conclusion
In light of the current need for enhanced authen-tication mechanisms, keystroke dynamics shows as a promising alternative. This behavioural biomet-ric technology does not usually involve additional cost with hardware, which may contribute to its
widespread adoption. In this paper, we investigated the problem of adapting user models to typing rhythm changes over time. We evaluated adaptation methods for a immune positive selection algorithm in a data stream context.
All adaptation methods resulted in improvements on the classification performance, illustrating the importance to deal with typing rhythm changes (con-cept drift) in keystroke dynamics. The best adaptation method for Self-Detector in most of the cases was Sliding, followed byUsage Control R.Double Parallel also achieved good performance, however, its memory usage grows without limit through time, which may be a problem for larger data streams.
Considering FRR separately, theGrowingmethod reached best performance, what may improve system usability. However,Growingalso decreases security, as false acceptance attained highest values in our tests. Both Slidingand Usage Control Rprovided a good balance between FAR and FRR. Due to their lower FAR, these methods provide better security than Growing, since less intruders are wrongly accepted in
SlidingandUsage Control R methods.Growinghas
the same memory issue discussed forDouble Paral-leltoo. All in all, the choice of the adaptation method must also consider the application focus: high security or a balance between security and usability.
In future work, other scenarios may be investigated by changing the ratio of positive/negative examples in the data stream. We expect that the evaluation methodology detailed here may contribute to improve the evaluation of adaptation methods proposed for keystroke dynamics in the future. Another important research topic is the adaptive adjustment of algorithm parameters. This adaptation could improve even more the prediction performance.
Acknowledgments The authors would like to thank Coordenac¸˜ao de Aperfeic¸oamento de Pessoal de N´ıvel Superior (CAPES), Conselho Nacional de Desenvolvimento Cient´ıfico e Tecnol´ogico (CNPq) and Fundac¸˜ao de Amparo `a Pesquisa do Estado de S˜ao Paulo (FAPESP) for financial support.
References
1. Bartlow, N., Cukic, B.: Evaluating the reliability of creden-tial hardening through keystroke dynamics. In: 17th Inter-national Symposium on Software Reliability Engineering, 2006. ISSRE ’06, pp. 117–126. IEEE (2006)
2. de Castro, L.N., Timmis, J.: Artificial Immune Systems: A New Computational Intelligence Approach. Springer (2002)
3. Crawford, H.: Keystroke dynamics: Characteristics and opportunities. In: 2010 Eighth Annual International Con-ference on Privacy Security and Trust (PST), pp. 205–212 (2010)
4. Demˇsar, J.: Statistical comparisons of classifiers over mul-tiple data sets. J. Mach. Learn. Res, 1–30 (2006)
5. Freni, B., Marcialis, G., Roli, F.: Replacement algo-rithms for fingerprint template update. In: Campilho, A., Kamel, M. (eds.) Image Analysis and Recognition, Lec-ture Notes in Computer Science, vol. 5112, pp. 884–893. Springer, Berlin Heidelberg (2008)
6. Gaines, R., Lisowski, W., Press, S., Shapiro, N.: Authen-tication by keystroke timing: Some preliminary results, technical report. Tech. rep., Rand Corporation (1980) 7. Giot, R., Dorizzi, B., Rosenberger, C.: Analysis of
tem-plate update strategies for keystroke dynamics. In: 2011 IEEE Workshop on Computational Intelligence in Biomet-rics and Identity Management (CIBIM), pp. 21–28. IEEE (2011)
8. Giot, R., El-Abed, M., Hemery, B., Rosenberger, C.: Unconstrained keystroke dynamics authentication with shared secret. Comput. Secur.30(6–7), 27–445 (2011) 9. Giot, R., El-Abed, M., Rosenberger, C.: Greyc keystroke:
A benchmark for keystroke dynamics biometric sys-tems. In: IEEE International Conference on Biometrics: Theory, Applications and Systems (BTAS 2009), pp. 419– 424. IEEE Computer Society, Washington, DC (2009) 10. Giot, R., El-Abed, M., Rosenberger, C.: Web-based
benchmark for keystroke dynamics biometric systems: A statistical analysis. In: 2012 Eighth International Confer-ence on Intelligent Information Hiding and Multimedia Signal Processing (IIH-MSP), pp. 11–15 (2012)
11. Giot, R., Rosenberger, C., Dorizz, B.: Can chronological information be used as a soft biometric in keystroke dynam-ics?. In: 2012 Eighth International Conference on Intelli-gent Information Hiding and Multimedia Signal Processing (IIH-MSP), pp. 7–10 (2012)
12. Giot, R., Rosenberger, C., Dorizzi, B.: Hybrid template update system for unimodal biometric systems. In: 2012 IEEE Fifth International Conference on Biometrics: The-ory, Applications and Systems (BTAS), pp. 1–7 (2012) 13. Giot, R., Rosenberger, C., Dorizzi, B.: Performance
evalua-tion of biometric template update. In: Internaevalua-tional Biomet-ric Performance Testing Conference, pp. 1–4 (2012) 14. Hosseinzadeh, D., Krishnan, S.: Gaussian mixture
model-ing of keystroke patterns for biometric applications. IEEE Trans. Syst. Man Cybern. Part C: Appl. Rev.38(6), 816– 826 (2008)
15. Kang, P., Hwang, S.s., Cho, S. In: Lee, S.W., Li, S. (eds.): Continual retraining of keystroke dynamics based authenti-cator, vol. 4642, pp. 1203–1211. Springer, Berlin /Heidel-berg (2007)
16. Killourhy, K., Maxion, R.: Why did my detector do that?! predicting keystroke-dynamics error rates. In: Jha, S., Som-mer, R., Kreibich, C. (eds.) Recent Advances in Intrusion Detection, Lecture Notes in Computer Science, vol. 6307, pp. 256–276. Springer, Berlin / Heidelberg (2010)
17. Magalhaes, S.T., Revett, K., Santos, H.M.D.: Pass-word secured sites: Stepping forward with keystroke dynamics. In: Proceedings of the International Con-ference on Next Generation Web Services Practices, NWESP ’05, p. 293. IEEE Computer Society (2005). doi:10.1109/NWESP.2005.62
18. Martono, W., Ali, H., Salami, M.J.E.: Keystroke pressure-based typing biometrics authentication system using sup-port vector machines. In: Proceedings of the 2007 Inter-national Conference on Computational Science and Its Applications -Volume Part II, ICCSA’07, pp. 85–93. Springer, Berlin, Heidelberg (2007)
19. Messerman, A., Mustafic, T., Camtepe, S., Albayrak, S.: Continuous and non-intrusive identity verification in real-time environments based on free-text keystroke dynam-ics. In: 2011 International Joint Conference on Biometrics (IJCB), pp. 1–8 (2011)
20. Peacock, A., Ke, X., Wilkerson, M.: Typing patterns: A key to user identification. IEEE Secur. Priv.2(5), 40–47 (2004) 21. Pisani, P.H.: Algoritmos imunol´ogicos aplicados na detecc¸˜ao de intrus˜oes com dinˆamica da digitac¸˜ao. Master’s thesis, Universidade Federal do ABC (2012)
22. Pisani, P.H., Lorena, A.C.: A systematic review on keystroke dynamics. J. Braz. Comput. Soc.19(4), 573–587 (2013)
23. Pisani, P.H., Lorena, A.C., de Leon Ferreira de Carvalho, A.C.P.: Algoritmos imunol´ogicos adaptativos em dinˆamica da digitac¸˜ao: um contexto de fluxo de dados. In: Anais do X Encontro Nacional de Intelig˙ncia Artificial e Computa-cional - ENIAC (2013)
24. Rattani, A., Marcialis, G., Roli, F.: Self adaptive systems: An experimental analysis of the performance over time. In: 2011 IEEE Workshop on Computational Intelligence in Biometrics and Identity Management (CIBIM), pp. 36–43 (2011). doi:10.1109/CIBIM.2011.5949222
25. Roli, F., Didaci, L., Marcialis, G.: Adaptive biometric sys-tems that can improve with use. In: Ratha, N., Govindaraju, V. (eds.) Advances in Biometrics, pp. 447–471. Springer, London (2008)
26. Roli, F., Marcialis, G.: Semi-supervised pca-based face recognition using self-training. In: Yeung, D.Y., Kwok, J., Fred, A., Roli, F., Ridder D. (eds.) Structural, Syntactic, and Statistical Pattern Recognition, Lecture Notes in Com-puter Science, vol. 4109, pp. 560–568. Springer, Berlin Heidelberg (2006)
27. Scheidat, T., Makrushin, A., Vielhauer, C.: Automatic template update strategies for biometrics. Tech. rep., Otto-von-Guericke University of Magdeburg, Germany (2007)
28. Stibor, T., Timmis, J.: Is negative selection appropriate for anomaly detection. ACM GECCO, 321–328 (2005) 29. Tan, P.N., Steinbach, M., Kumar, V.: Introduction to Data
Mining. Pearson Education (2006)
30. Teh, P.S., Teoh, A.B.J., Yue, S.: A survey of keystroke dynamics biometrics. Sci. World J., 1–24 (2013). doi:10.1155/2013/408280
31. Yu, E., Cho, S. In: Liu, J., Cheung, Y.m., Yin, H. (eds.): Novelty detection approach for keystroke dynamics identity verification, vol. 2690, pp. 1016–1023. Springer, Berlin / Heidelberg (2003)
![Fig. 1 Positive selection algorithm [28] (figure adapted from [21])](https://thumb-us.123doks.com/thumbv2/123dok_us/94703.2510771/4.820.322.755.81.352/fig-positive-selection-algorithm-figure-adapted.webp)
![Table 1 Summary of datasets used in this paper ([8, 9, 16])](https://thumb-us.123doks.com/thumbv2/123dok_us/94703.2510771/10.820.70.394.595.1002/table-summary-datasets-used-paper.webp)