EN
EN
EUROPEAN COMMISSION Brussels, 26.11.2015 COM(2015) 691 finalREPORT FROM THE COMMISSION
TO THE EUROPEAN PARLIAMENT, THE COUNCIL, THE EUROPEAN CENTRAL BANK AND THE EUROPEAN ECONOMIC AND SOCIAL
COMMITTEE
Alert Mechanism Report 2016
(prepared in accordance with Articles 3 and 4 of Regulations (EU) No 1176/2011 on the prevention and correction of macroeconomic imbalances)
2
The Alert Mechanism Report (AMR) is the starting point of the annual cycle of the Macroeconomic Imbalance Procedure (MIP), which aims to identify and address imbalances that hinder the smooth functioning of the economies of Member States, the economy of the EU, and may jeopardise the proper functioning of the economic and monetary union.
The AMR uses a scoreboard of selected indicators, plus a wider set of auxiliary indicators, to screen Member States for potential economic imbalances in need of policy action. Member States identified by the AMR are then analysed an In-Depth Review (IDR) by the Commission to assess how macroeconomic risks in the Member States are accumulating or winding down, and to conclude whether imbalances, or excessive imbalances exist. Following established practice, for Member States for which imbalances were identified in the previous round of IDRs, a new IDR will in any case be prepared.
Taking into account discussions with the Parliament, and within the Council and the Eurogroup, the Commission will prepare IDRs for the relevant Member States and the findings will feed into the country-specific recommendations under the 'European Semester' of economic policy coordination. The IDRs are expected to be published in February 2016, ahead of the 'European Semester' package of country-specific recommendations.
1. EXECUTIVE SUMMARY
This Report initiates the fifth annual round of the Macroeconomic Imbalance Procedure (MIP)1. The procedure aims to identify imbalances that hinder the smooth functioning of Member State economies, of the euro area, or of the EU as a whole, and to spur the right policy responses. The implementation of the MIP is embedded in the 'European Semester' of economic policy coordination so as to ensure consistency with the analyses and recommendations made under other economic surveillance tools. The Annual Growth Survey (AGS), which is adopted at the same time as this report, takes stock of the economic and social situation in Europe and sets out broad policy priorities for the EU as a whole for the coming years.
The report identifies Member States for which further in-depth reviews (IDRs) should be undertaken so as to assess whether they are affected by imbalances in need of policy action2. The AMR is a screening device for economic imbalances, published at the start of each annual cycle of economic policy coordination. In particular, it is based on an economic reading of a scoreboard of indicators with indicative thresholds, alongside a set of auxiliary indicators.
This year, three employment indicators, namely the activity rate, long-term and youth unemployment, are added to the main scoreboard. The inclusion of new employment variables in the scoreboard is a concrete deliverable on the Commission’s commitment to strengthen its analysis of macroeconomic imbalances. This is particularly relevant for the social consequences of the crisis and because long, drawn-out negative employment and social developments can have a negative impact on potential GDP growth in a variety of ways and risk compounding macroeconomic imbalances. This inclusion does not change the focus of the MIP, which remains aimed at preventing the emergence of harmful macroeconomic imbalances and ensuring their correction. Flashes of the new indicators do not imply by
1
This Report is accompanied by a Statistical Annex which contains a wealth of statistics which have contributed to inform this report.
2
3
themselves, an aggravation of the macro-financial risks, and consequently are not used to trigger any steps in the MIP3.
As compared with previous issues of the Alert Mechanism Report, a greater emphasis is put on euro-area considerations. In line with the 21 October Commission Communication "On steps towards Completing Economic and Monetary Union", the Alert Mechanism Report aims at a more systematic analysis of the euro-area wide implications of countries' imbalances and how such implications require a coordinated approach to policy responses.
The horizontal analysis presented in the AMR leads to a number of conclusions:
• Adjustment to existing imbalances is taking place in a challenging environment. The ongoing moderate recovery in the euro area is projected to continue but it remains fragile and subject to increased external risks. Over the past few months, global trade has considerably slowed down and downside risks, in particular in relation to emerging markets' prospects, have increased4. Growth has become more reliant on domestic demand sources, in particular a more pronounced recovery in investment.
• EU Member States continue to progress in correcting their imbalances. In countries with high external liabilities, the large and unsustainable current account deficits of the pre-crisis period have been considerably attenuated and external positions balanced or in surplus would need to be sustained in order to significantly reduce the vulnerabilities. Furthermore, cost competitiveness developments have been broadly consistent with external adjustment needs, and in most countries, the process of balance-sheet repair is progressing in the different sectors of the economy.
• However, vulnerabilities associated with elevated levels of indebtedness remain a source of concern. In several Member States, the stock of liabilities, private and public, external and internal, remain at historically high levels. They not only represent vulnerabilities for growth, jobs and financial stability in the EU, but the associated deleveraging pressures related to their necessary unwinding also weigh on the recovery.
• Surpluses in some Member States remain large over the forecast horizon (2015-2017). At the aggregate level, the euro area is posting a current account surplus which is one of the world's largest and is expected to rise again this year. While weaker commodity prices and the depreciation of the euro exchange rate have contributed to boosting the trade balance, the surplus largely reflects an excess of domestic savings over investment at the area level.
• After years of markedly divergent patterns, labour market conditions are converging but social distress remains at unacceptable levels in a number of countries, notably those concerned by the unwinding of macroeconomic imbalances and debt crises.
3
The indicators are added in order to better capture the employment and social dimension of imbalances and adjustment processes. The indicators are the activity rate, the long-term unemployment rate, and the youth unemployment rate, all expressed as changes over a three-year period. Such indicators were already included among the auxiliary MIP indicators. For details regarding the criteria for the selection of the indicators see the Commission Staff Working Document "Adding employment indicators to the scoreboard of the Macroeconomic Imbalances Procedure to better capture employment and social developments" that was discussed in Committees of the ECOFIN and EPSCO Councils and the European Parliament.
4
See 'European Economic Forecast-Autumn 2015', European Economy, Institutional Paper 011, November 2015.
4
As identified in the AGS, a coordinated approach to macroeconomic policies is warranted to tackle imbalances while supporting the recovery. Policy action and effective reform implementation, in particular in the field of competitiveness but also insolvency, must especially be stepped up in countries whose capacity to grow is constrained by elevated deleveraging pressures or structural growth bottlenecks. In parallel, domestic demand and investment needs to be boosted particularly in countries with fiscal space, a large current account surplus or low deleveraging pressures. In light of the interconnection between Member States, this combination of policies would contribute to put the rebalancing process on a more stable footing by making it more symmetric, while making the recovery more self-sustainable.
More detailed and encompassing analyses for Member States flagged by the AMR will be performed in in-depth reviews (IDRs). As in the previous cycle, IDRs will be embedded in Country Reports, which also integrate the additional Commission services analysis on other structural issues necessary to inform the EU Semester Country Specific Recommendations (CSRs). To prepare the IDRs, the Commission will base its analysis on a much richer set of data and information: all pertinent statistics, all relevant data, all material facts will be taken into account. As established by the legislation, it is on the basis of the IDRs that the Commission will conclude whether imbalances or excessive imbalances exist, and subsequently prepare the appropriate policy recommendations for each Member State5.
Based on the economic reading of the MIP scoreboard, the Commission finds that IDRs are warranted for the following Member States in order to examine in further detail the accumulation and unwinding of imbalances, and their related risks6.
• For most countries, IDRs are needed because imbalances were identified in the previous
round of IDRs7. Following established practice, a new IDR is needed to assess whether
existing excessive imbalances or imbalances are unwinding, persisting or aggravating, while paying due attention to the contribution of the policies implemented by these Member States to overcome imbalances. The Member States concerned are Belgium, Bulgaria, Germany, France, Croatia, Italy, Hungary, Ireland, the Netherlands, Portugal, Romania, Spain, Slovenia, Finland, Sweden and the United Kingdom.
• IDRs will be prepared for the first time also for Estonia and Austria. In the case of
Estonia, the IDR will assess the risks and vulnerabilities linked to a renewed build-up of demand pressures. In the case of Austria, issues related to the financial sector, notably its high exposure to developments abroad and the impact on credit provided to the private sector will be analysed.
For the Member States that benefit from financial assistance, the surveillance of their imbalances and monitoring of corrective measures take place in the context of their
5
Regulation (EU) No 1176/2011 (OJ L 306, 23.11.2011, p. 25). 6
The increase in the number of Member States selected for an IDR since 2012 is partly a reflection of the need to integrate countries exiting a financial assistance programme as a result of economic improvement. This concerns Ireland, Portugal and Romania whose inclusion in the MIP surveillance was deemed prudent. In addition, Croatia joined the standard surveillance after acceding to the EU in 2013. The persistence of a certain number of Member States subject to an IDR is linked to the fact that Member States can exit MIP surveillance only on the basis of a new IDR Looking ahead, if economic conditions improve or do not worsen, one may expect the number of countries subject to an IDR to fall over time.
7
See '2015 European Semester: Assessment of growth challenges, prevention and correction of macroeconomic imbalances, and results of in-depth reviews under Regulation (EU) No 1176/2011' - COM(2015) 85 final -, 26.2.2015, and 'Macroeconomic Imbalances, Main Findings of the In-Depth Reviews 2015' European Economy-Occasional Papers 228. For the full set of country-specific recommendations adopted by the Council, including those that are MIP-relevant, see OJ C272, 18.8.2015.
5
assistance programmes. This concerns Greece and Cyprus. As was the case in the previous cycles for Member States expected to exit their financial assistance programme, the situation of Cyprus will be assessed in the context of the MIP only after the on-going financial assistance programme, which is expected to finish by March 2016.
For the other Member States, the Commission will not at this stage carry out further analyses in the context of the MIP. On the basis of the economic reading of the scoreboard, the Commission is of the view that for the Czech Republic, Denmark, Latvia, Lithuania, Luxembourg, Malta, Poland and Slovakia, an In-Depth Review is not needed at this stage and that further MIP surveillance is not warranted. However, careful surveillance and policy coordination are necessary on a continuous basis for all Member States to identify emerging risks and put forward the policies that contribute to growth and jobs.
Box 1. Stabilising and streamlining MIP imbalance categories
The configuration of MIP imbalance categories evolved over time and currently it appears as follows: 1. No imbalance
2. Imbalances, which require monitoring and policy action
3. Imbalances, which require monitoring and decisive policy action
4. Imbalances, which require specific monitoring and decisive policy action
5. Excessive imbalances, which require specific monitoring and decisive policy action 6. Excessive imbalances, leading to the Excessive Imbalance Procedure
The Excessive Imbalances Procedure (EIP) has not been invoked yet. The identification of excessive imbalances, however, implies the requirement of decisive policy action and specific monitoring. Since 2014, some euro-area countries of systemic relevance identified with imbalances were required decisive policy action and specific monitoring, with a view of ensuring progress with the euro-area CSR addressing macroeconomic imbalances. Some countries with imbalances were required decisive policy action.
While the fine-tuning of the categorisation of MIP imbalances has permitted to articulate the activation of MIP surveillance, the resulting complexity did not help in terms of transparency and enforceability. For this reason, the Communication of 21 October puts forward a number of avenues for improving the implementation of the MIP looking forward. Notably, the Commission will ensure a transparent implementation of the MIP, stabilise the categories and clarify the criteria guiding its decision.
6
2. IMBALANCES,RISKS AND ADJUSTMENT: ISSUES OF A CROSS-COUNTRY NATURE
In a context of uncertain global conditions, the economic recovery is becoming increasingly reliant on domestic demand. The latest economic forecasts confirm that a moderate recovery is taking place across the EU in a context of low oil prices and very accommodative monetary policy. In 2015 and 2016, economic activity in the EU is expected to grow at 1.9 and 2.0 per cent, after having posted 1.4 per cent growth in 2014. In the euro area, real GDP growth rates correspond to 0.9, 1.6 and 1.8 per cent in 2014, 2015 and 2016, respectively8. Although consumption has recently strengthened, domestic demand remains subdued partly in light of significant deleveraging pressures in several Member States. This is reflected in low inflation and the growth of the euro-area current account surplus, which is expected to rise again in 2015, also against a backdrop of declining oil prices since mid-2014 and the lower euro exchange rate. Since the summer, a marked slowdown in external demand has been taking place while downside risks to the global economy are growing in light of geopolitical factors and the possibility of a sharper than expected slowdown in China and other emerging countries9. Depending on the magnitude of the global slowdown, EU economies could be significantly affected, reinforcing the need for consolidating competitiveness improvements, but also making domestic demand vital to the recovery.
In this context, macroeconomic imbalances continue to adjust but elevated levels of indebtedness represent important vulnerabilities. EU economies continue to progress in correcting their external and internal imbalances. High and unsustainable current account deficits have been reduced and the process of balance-sheet repair is progressing in all sectors in most countries. Furthermore, cost competitiveness developments are in general consistent with external adjustment needs. However, serious vulnerabilities related to the stocks of liabilities and the quality of the adjustment persist. The stock of liabilities, private and public, external and internal, remains at historically high levels in several Member States. They not only represent vulnerabilities for growth, jobs and financial stability in the EU, but the simultaneous deleveraging pressures related to their necessary unwinding also weigh on the recovery. In addition, the persistence of sizeable current account surpluses in countries with relatively low deleveraging needs implies large savings and investment imbalances, pointing to a misallocation of resources which increases the risk of prolonged economic weakness and which may complicate the deleveraging process in the EU at large.
Overcoming the high levels of debt while making room for the recovery to become more self-sustainable represents the main challenge for the euro area at the current juncture. At the euro area aggregate level, the risk of protracted anaemic growth and low inflation must be mitigated by countries that are better placed to boost investment consistently with available fiscal space and low deleveraging needs. In parallel, structural reforms aimed at unlocking growth potential must continue or be stepped up especially in countries whose growth potential is limited by structural growth bottlenecks. Moreover, countries whose capacity to boost demand is constrained by high deleveraging pressures should also focus on growth enhancing reforms, ensuring also that their insolvency framework is adequate to address the stock of non-viable debt, free up economic resources accordingly and reallocate capital efficiently. (Box 2)
8
See 'European Economic Forecast-Autumn 2015', European Economy, Institutional Paper 011, November 2015. Although aggregate figures of the recovery mask significant differences across Member States, real convergence seems now to progress with higher growth rates recorded in Spain, Ireland, Slovenia, the Baltic states, but also Hungary, Poland, Czech Republic, Romania while growth in France, Italy, Austria, Finland, Belgium is likely to remain subpar in 2015.
9
See International Monetary Fund. 2015. World Economic Outlook: Adjusting to Lower Commodity Prices. Washington (October).
7
Box 2: The euro-area dimension of macroeconomic imbalances
Euro-area wide implications of macroeconomic imbalances deserve careful consideration. In line with proposals contained in the 22 June 2015 Report "Completing Europe's Economic and Monetary
Union" by Jean Claude Juncker, Donald Tusk, Jeroen Dijsselbloem, Mario Draghi and Martin Schulz,
and the 21 October 2015 Commission Communication "On steps towards completing Economic and
Monetary Union", starting from this year the AMRcontains a more systematic analysis of the
euro-area wide implications of countries' imbalances and how such implications require a coordinated approach to policy responses.
The euro area is currently posting one of the world's largest current account surpluses in value terms. In 2015, it is expected to amount to approximately EUR 390bn, or 3.7% of GDP. The bulk of the surplus is accounted for by Germany and the Netherlands, whose contribution represents 2.5% and 0.7% of the euro area GDP respectively, and by Italy (0.4% of euro area GDP). (Graph 1) Former deficit countries are now also recording balanced or surplus positions, which are needed in order to ensure the sustainability of their external positions. In a context of low growth and nearly zero inflation, the persistence of very high surpluses in countries with relatively low deleveraging needs points to a lack of domestic sources of growth. Once oil prices rise again, domestic demand strengthens, the effect of the lower euro fades away and export growth slows, the trade balance surpluses of the euro area and the EU should stop widening and eventually decline slightly in 2017. The continuous accumulation of net foreign assets may also imply growing exposure to exchange rate risk and reduced room for national authorities to manage macro-financial risks (e.g. via prudential or regulatory measures) as the share of assets in domestic portfolios originating in foreign countries grows larger.
Simultaneous deleveraging pressures are currently at play in all sectors of the economy (households, corporates, government). At the euro area aggregate level, households, corporations and governments are currently struggling with elevated levels of indebtedness, and the necessary process of deleveraging implies subdued investment and consumption dynamics. According to Eurostat data, in 2014, debt stocks in consolidated terms represented 59.7% and 79.5% of euro area GDP for households and non-financial corporations, while they amounted to 63.1% and 81.9% of GDP respectively in 2009. The aggregates hide wide disparities across Member States. Private sector deleveraging started early on, when the crisis broke out, but the process is still ongoing10. Households are still exhibiting a net lending position that is twice as high as its pre-crisis level. Corporations, which often record net borrowing needs in normal times, are still posting a positive net lending position. Government deleveraging started later, as the first phase of the recession prompted stimulus packages in 2009-2010. Since then, governments have entered a consolidation phase, and budgetary policy has remained tight or, more recently, broadly neutral. The demand impact of the deleveraging processes by households and corporations has therefore been compounded by the need to contain the rise in debt in the government sector11.
The level of the euro area current account surplus is likely to be above what fundamental characteristics imply, reflecting economic inefficiencies and subdued domestic demand. A number of economic characteristics such as the ageing profile of the population, the old-age dependency ratio, the relatively high levels of income per capita but also the status of the euro as a reserve currency suggest that the appropriate overall saving-investment balance in the euro area should be broadly balanced12. However, the increase in the euro area current account surplus over the past few
10
Deleveraging process can be evidenced by looking at the aggregate net lending position of the euro area by sectors. In 2014, it amounted to 3.2% of GDP, of which households, corporations and government represented 2.9%, 1.8% and 2.6%. In 2010, the respective figures amounted to 0.6%, 2.9%, 3.3% and -6.2%, and in 2007, to 0.3%, 1.4%, -0.6% and -0.6%.
11
See Bricongne J.-C. and Mordonu A. (2015), 'Interlinkages between household and corporate debt in advanced economies', European Commission Discussion Papers N° 17 (October 2015).
12
The benchmark is derived from reduced-form regressions capturing the main determinants of the saving-investment balance, including fundamental determinants (e.g. demography, resources), policy factors and
8
years has led to a position that is higher than the surplus implied by economic fundamentals. Despite recent improvements and notwithstanding the temporary effects of lower oil prices and exchange rate developments, the absence of robust credit growth in the euro area as a result of balance sheet redress and sizeable deleveraging pressures partly explains the difference. Looking forward, policies put in place at the EU level (e.g. the ECB's Public Sector Purchase Programme and the Investment Plan launched by the Commission) are meant to support credit for investment and consumption, even though the effect on the real economy might take some time to materialise.
Cross-border spillovers within the euro area warrant a coordinated approach to macroeconomic policies to tackle imbalances while supporting the recovery. In light of the interconnection among euro area economies through trade, financial and institutional linkages, a coordinated approach to macroeconomic policies is warranted to accelerate the correction of imbalances while supporting growth. Moreover, confidence effects have also proven to be an important transmission mechanism13. In particular, spillovers arising from the policy stance in large countries are of systemic relevance for the euro area at the current juncture.
The risk of protracted low growth and low inflation at euro-area level should be mitigated especially by countries that are better placed to boost investment consistently with available fiscal space and positive savings investment balance14. This is the case of Germany and the Netherlands whose current account surpluses are forecast to remain high in the coming years. A reduction of surpluses in countries with relatively low deleveraging needs would bring a much needed improvement in demand in the euro area and help ease the trade-off faced by highly indebted countries, which need to deleverage and boost growth simultaneously.
In parallel, structural reforms aimed at unlocking growth potential must continue or be stepped up, in particular in countries of systemic relevance like Italy and France. Such reforms would help not only to remove growth bottlenecks, but they would also contribute to support confidence on the sustainability of fiscal imbalances in these countries.
Finally, countries whose capacity to sustain demand is constrained by debt overhang and a high level of non-performing loans should also focus on growth enhancing reforms, ensuring that their insolvency frameworks are also adequate to address the stocks of non-viable debt, free up economic resources, and reallocate capital efficiently.
global financial conditions. The methodology is akin to the External Balance Assessment (EBA) approach developed by the IMF. See Phillips, S. et al. (2013), 'The External Balance Assessment (EBA) Methodology', IMF Working Paper, 13/272.
13
See D’Auria, F., Linden, S., Monteiro, D., in ‘t Veld, J. and Zeugner S., 'Cross-border Spillovers in the Euro Area', Quarterly Report on the Euro Area, Vol 13 No 4 (2014).
14
Cf. Recital 17 of Regulation 1176/2011: "When assessing macroeconomic imbalances, account should be taken of their severity and their potential negative economic and financial spill-over effects which aggravate the vulnerability of the Union economy and are a threat to the smooth functioning of the economic and monetary union. Actions to address macroeconomic imbalances and divergences in competitiveness are required in all Member States, particularly in the euro area. However, the nature, importance and urgency of the policy challenges may differ significantly depending on the Member States concerned. Given vulnerabilities and the magnitude of the adjustment required, the need for policy action is particularly pressing in Member States showing persistently large current-account deficits and competitiveness losses. Furthermore, in Member States that accumulate large current-account surpluses, policies should aim to identify and implement measures that help strengthen their domestic demand and growth potential."
9
Graph 1:The euro area current account balance
-4 -3 -2 -1 0 1 2 3 4 99 00 01 02 03 04 05 06 07 08 09 10 11 12 13 14 15 16 % o f G D P
DE NL ES FR IT Other Euro Area
Source: National accounts and European Commission Autumn forecasts 2015 (AMECO)
Large current account deficits have adjusted to more balanced positions or surpluses in most Member States, while large current account surpluses still persist. In 2014, the majority of Member States registered current account surpluses. Euro area countries most hit by the crisis have undertaken a sharp adjustment and are now registering moderate surpluses (Spain, Portugal, Italy) or somewhat larger surpluses (Ireland, Slovenia). While the initial adjustment was mainly the result of reduced private domestic demand, the recent surpluses have also been achieved through export growth15. However, cyclically-adjusted figures are in general lower than the headline balances (Spain, Italy, Portugal, Greece, Cyprus), suggesting that further increases in current account are not to be expected as the recovery brings back output close to potential, even though risks of going back to pre-crisis deficits seem limited. A few Member States registered relatively contained current account deficits like Finland and France while deficits were much wider in the United Kingdom and Cyprus. Overall, the three-year average indicator exceeds the threshold in four surplus countries (Germany, Denmark, the Netherlands and Sweden) and two deficit countries (the United Kingdom and Cyprus). Countries such as Germany, the Netherlands, as well as non-euro area Member States such as Sweden and Denmark continue to post very high surpluses. These large and persistent surpluses show no tendency to correct. While current account surpluses in countries with an ageing population like Germany are to be expected, and recent oil price and exchange rate developments had a favourable impact on the trade balance, the current value of the surplus appears well above what economic fundamentals would imply16.
In the case of Germany, when allowing for the position in the business cycle, the cyclically-adjusted surplus is higher than the headline figure17.
15
See Box I.3 in 'European Economic Forecast-Spring 2015', European Economy, 2015(2). 16
See 'Macroeconomic Imbalances, Main Findings of the In-Depth Reviews 2015' European Economy-Occasional Papers 228.
17
Given the reduction in current account deficits, the geographic composition of the surpluses in creditor economies, particularly Germany, has changed. The balance vis-à-vis the rest of the world has increased, while the balance vis-à-vis the euro area has declined. The latter has been driven mainly by a reduction in exports to the rest of the euro area, rather than an increase in imports by Germany.
10
Graph 2:Net International Investment Position and Net External Debt in 2014
-150 -100 -50 0 50 100 150 CY EL PT IE* ES SK LV LT SI EE IT FR FI AT LU* MT* DE BE NL HR HU BG PL RO CZ UK SE DK
Net external debt (neg. sign) Other net assets
Net international investment position (NIIP)
In % of GDP
Euro Area Non-Euro Area
Source: Eurostat (BPM6, ESA10)
Note: Data for the net external debt are unavailable for Croatia and the United Kingdom. The decomposition is
not fully displayed for Ireland, Luxembourg and Malta18.
Vulnerabilities persist as the adjustment in external flows has not yet translated into a sizeable reduction in external indebtedness (Graph 2). Overall, sizeable vulnerabilities persist among net debtor countries: in 2014, the scoreboard indicator for the net international investment position exceeds the indicative threshold in 16 Member States. Since the emergence of current account surpluses over the past few years, net external liabilities expressed as a percentage of GDP have not significantly improved in euro area countries such as Greece, Spain, or Portugal. In particular, with the exception of Ireland and, more recently, Portugal, the contribution of nominal GDP growth has been either small (Spain) or negative (Greece and Cyprus). This highlights the risks linked to a low inflation environment and how it can hamper the correction of imbalances. Negative valuation effects have also weighed – sometimes significantly – on the improvement of net external liabilities, notably in Greece, Spain and Portugal. The absence of significant improvement is also observed in Croatia. In the majority of the economies with highly negative positions, higher current account surpluses than those currently observed would be needed in order to reduce their net external liabilities in a timely fashion (Graph 3). Consolidating improvements in export competitiveness remains therefore essential, as well as policies aimed at attracting foreign direct investments (FDI). In Ireland and a number of Eastern European countries (Hungary, Poland, Romania), the current account balances that are currently recorded need to be maintained for a protracted period of time in order to lead to a significant improvement in the net external liabilities over the medium term. In net creditor countries such as Germany and the Netherlands, risks associated with growing stocks of net foreign assets cannot be compared with external sustainability risks. Nonetheless, the fast and continuous accumulation of net creditor risks should not be overlooked.
18
For these countries, the major share of external liabilities is not linked to domestic capital and activities, but rather to external assets. For instance, much of the Irish external liabilities are dominated by mutual funds that reside in Ireland but whose assets stem from other countries. According to the Balance of Payments classification, the balance sheet of mutual funds is composed by equity liabilities matched by portfolio debt assets, which translates into a very negative equity position along a very positive marketable debt position.
11
Graph 3:Current account: cyclically-adjusted balances and balances required to stabilise or reduce
external liabilities -10 -8 -6 -4 -2 0 2 4 6 8 10 12 CY EL FI FR SK ES PT LV IT BE AT EE IE LU SI LT MT DE NL UK CZ PL RO HR BG HU DK SE Cyclically adjusted current account in 2014
Current account balance in 2014
Current account required to stabilise NIIP over 2015-2016 Current account required for the NIIP to reach -35% by 2024
Euro Area Non-Euro Area
Source: Current account is displayed in the national accounts concept. Commission services calculations.
Notes: Cyclically-adjusted balances are calculated using the output gap estimates underlying the Commission
Autumn Forecasts 201519. Current account balances required to stabilise or reduce net external liabilities rest on the following assumptions: nominal GDP projections stem from the Commission Autumn Forecasts (up to 2017), and the Commission T+10 methodology projections beyond that20; valuation effects are conventionally assumed to be zero in the projection period, which corresponds to an unbiased projection for asset prices; capital account balances are assumed to remain constant as a percentage of GDP, at a level that corresponds to the median over 2014 and projections for 2015-201721.
Cost competitiveness developments have been broadly consistent with external adjustment needs. (Graph 4) In 2014, declines of unit labour costs were recorded in a number of euro area countries that were particularly affected by the crisis (e.g. Cyprus, Greece, Spain, Slovenia, Portugal and Ireland). In Cyprus, Greece and Portugal, the adjustment is mainly the reflection of wage moderation while in Spain and Ireland, productivity gains appear to account for a large share of the decline in unit labour costs (ULC). In addition, in countries where the labour market is improving, hours worked started to contribute positively to the evolution of unit labour costs (Spain, Portugal and Ireland). Conversely, in Italy and France, unit labour costs grew at a pace that was higher than the euro area average (1.1%), and Germany and Austria registered increases near 2%, mainly on account of wage dynamics while in the case of Italy, sluggish productivity also played a role. The fastest increases were recorded in the Baltic states, owing to sharp increases in hourly wages. Overall, taking into account developments over the past three years, the unit labour costs indicator exceeds the threshold in Estonia, Latvia and Bulgaria. The downward adjustment in unit labour costs in Member States facing higher adjustment needs was followed by a more muted though still visible relative decline in the real effective exchange rate, suggesting some responsiveness of price-cost margins to weak economic conditions. As
19
The estimates of the cyclically-adjusted balances are based on the methodology described in Salto, M. and A. Turrini (2010), 'Comparing Alternative Methodologies for Real Exchange Rate Assessment', European
Economy-Economic Papers, 427.
20
For the T+10 methodology, see Havik, K., K. Mc Morrow, F. Orlandi, C. Planas, R. Raciborski, W. Röger, A. Rossi, A. Thum-Thysen, and V. Vandermeulen (2014), 'The Production Function Methodology for Calculating Potential Growth Rates & Output Gaps', European Economic Papers 535.
21
For a detailed presentation of the calculations and assumptions, see, Loublier, A., Turrini A. and Zeugner, S. (2015), 'Methodologies for computing current account benchmarks', European Economy Economic Paper
12
a result of these relatively contained developments, no flashes are observed for the indicator, with the exception of Greece.
Graph 4:Decomposition of ULC growth in 2014
-8% -6% -4% -2% 0% 2% 4% 6% 8% 10% CY EL IE SI ES PT BE SK NL FI EA1 9 MT IT LU FR DE AT LT EE LV HR UK PL CZ RO BG SE DK HU
Of which: labour productivity (neg. sign) - contribution of total factor productivity and capital accumulation
Of which: labour productivity (neg. sign) - contribution of hours worked Of which: real hourly compensation per employee
Of which: inflation (GDP deflator growth) ULC growth in 2014
Euro Area Non-Euro Area
Source: AMECO and MIP scoreboard. Commission services calculations
Notes: The decomposition is based on the standard breakdown of ULC growth into inflation, real hourly
compensations and labour productivity, the latter being further broken down into the contribution of hours worked, total factor productivity and capital accumulation using a standard growth accounting framework.
The scoreboard still records cumulated export market share losses breaching the indicative threshold in several Member States, but improvements start being visible. The indicator on export market share changes over a five-year period shows cumulated losses above threshold in 18 Member States, suggesting that the aggregate current account surplus observed in the euro area is not mainly linked to a strong export performance (Graph 5a)22. However, the further decline in export market shares observed in EU economies over the past few years seems to have come to a halt with annual gains observed in 2013 and 2014 in the majority of Member States, with Finland, Sweden and Malta being exceptions (Graph 5b). In 2014, gains were in some cases relatively contained (Austria, France, the Netherlands, Spain, Italy) or in other cases more significant (Belgium, Germany, Hungary, Romania, Greece, Ireland). Nevertheless, these gains are in general of a much lower magnitude than the drops registered in 2010-2012. The recent improvement in export market shares in the EU is partially due to the fact that the global trade came to a halt in 2013-2014, which mechanically attenuated export market shares losses. In this respect, the recent market share improvements may not be structural. Looking forward, it is too early to assess whether these gains represent a permanent shift or are just temporary.
22
Exports in value from the euro area have decelerated between 2013 and 2015, and exports towards non-EU countries have roughly flattened.
13
Graph 5a:Five-yearchange in export market
shares -Scoreboard indicator in 2014
-40 -30 -20 -10 0 10 20 30 40 50 CY FI MT HR EL DK AT HU IT FR SI ES NL BE SE UK DE IE CZ PT SK PL BG LV LU RO EE LT Gains within Extra-EU market
Gains within EU market Exposure to Extra-EU Exposure to EU
Scoreboard indicator 2014 (5 year change)
Graph 5b:Two-year change in export market
shares in 2014 -10 -5 0 5 10 15 20 25 CY FI MT HR DK AT HU IT FR EL SI ES NL BE SE UK DE IE CZ PT SK PL BG LV LU RO EE LT Gains within Extra-EU market
Gains within EU market Exposure to Extra-EU Exposure to EU
Cumulated change in 2013 and 2014
Source: Eurostat, Commission services calculations.
Notes: The decomposition rests on the shift-share methodology. Shaded bars represent the contribution to market
share dynamics stemming from changes in the exposure to a given market; solid bars measure the contribution to market share dynamics coming from market share changes within a given market23. Calculations use BPM6 data except for BG, IT, FI and MT where exports to EU are derived from national accounts; data partly unavailable for ES, HR and IE.
Graph 6a:Household debt
(consolidated, in % of GDP) 0 20 40 60 80 100 120 140 160 DK CY NL IE UK PT ES SE DE FI EL MT BE EE LU FR AT LV IT HR HU PL LT SK CZ SI BG RO 09 14 10 09 09 09 09 14 00 14 13 14 14 09 14 14 10 09 12 10 10 14 09 14 13 12 09 10 % of GD P
Country | Peak year
2000 incr. to peak 2014
Graph 6b:Debt of non-financial corporations
(consolidated, in % of GDP) 0.0 50.0 100.0 150.0 200.0 250.0 CY IE BE SE NL PT ES BG MT EE DK UK FI FR SI HR LV IT HU AT EL DE RO LT CZ SK PL 00 12 12 09 00 12 09 13 09 09 08 09 10 14 09 10 10 12 09 09 10 01 10 09 00 09 14 % o f G D P
Country | Peak year
2000 incr. to peak 2014
Source: Eurostat, Commission services calculations
Notes: On Graph 6a, the peak of the debt-to-GDP ratio is indicated on the horizontal axis. The earliest
observation is 2000, except for IE, SI, HR (all 2001), PL (2003), MT, LV, LT (all 2004). The 2014 value, when not available, is estimated from quarterly data. On Graph 6b,LU is not included due to specificities regarding the drivers of corporate indebtedness. The peak of the debt-to-GDP ratio is indicated on the horizontal axis. The earliest observation is 2000, except for IE, SI, HR (all 2001), PL (2003), MT, LV, LT (all 2004). The 2014 value, when unavailable, is estimated from quarterly data.
Private sector debt remains high and above the indicative threshold of the scoreboard in several Member States. Private indebtedness varies substantially, reflecting not only the
23
For a detailed presentation of the methodology used for the decomposition of export market shares, see 'A closer look at some drivers of trade performance at Member State level', Quarterly Report on the Euro Area, 2012(2):29-39.
14
degree of development of the financial sector but also the extent to which over-borrowing took place linked to easy borrowing conditions before the crisis. Differences are also quite substantial regarding the composition of private debt across the main sectors of the economy
(Graphs 6a and 6b). In some countries high indebtedness is mostly linked to the accumulation
of debt by households, often linked to a strong growth in house prices and the value of mortgage stocks. In other countries indebtedness is high especially among non-financial corporations. In some countries high indebtedness concern all sectors of the economy. High debt constitutes a vulnerability in that it amplifies the macro-financial implications of adverse shocks. It reduces the adjustment capacity of the economies by making less effective the monetary policy transmission as indebted corporations hardly benefit from low interest rates24. In light of remaining deleveraging needs, downward adjustment in private debt stocks would act as a drag on growth in terms of muted investment or consumption dynamics. In this context, well-working insolvency frameworks would contribute to reduce the extent of debt overhang by resolving unviable debt, thereby mitigating the drag on growth linked to deleveraging.
Progress in deleveraging has been mixed, and the reduction in private debt was mainly the result of negative credit flows in most Member States. According to Eurostat data, at the EU aggregate level, debt stocks for households and non-financial corporations in consolidated terms represented 64.6% and 77.7% of EU GDP respectively in 2014, while they amounted to 68.0% and 82.5% in 2009. Since debt levels peaked, progress in deleveraging has been mixed, with genuine reductions of indebtedness observed more often in the corporate sector (Graphs 6a and 6b). The latest developments show a very uneven deleveraging picture across countries and sectors (Graphs 7a and 7b). Throughout 2014 and early 2015, active debt repayment by households was facilitated by a favourable growth contribution in Ireland and to a lesser extent in Portugal, Spain and Hungary. Passive deleveraging was achieved in the United Kingdom and Denmark which reduced debt-to-GDP ratios on the back of favourable contributions from growth while keeping credit flowing to households. Conversely, household debt continued to increase in Sweden, Finland, France, Belgium, supported by positive credit flows. In some cases, firms, too, underwent an active deleveraging concomitant with a favourable contribution of nominal growth. This is the case of Latvia, Ireland, Denmark, Slovenia and Portugal. Passive corporate deleveraging took place only in a limited number of countries (e.g. the United Kingdom, and the Czech Republic). Corporate deleveraging was however unsuccessful in a few Member States such as Cyprus and Greece with debt-to-GDP ratios worsening despite increased savings, on the back of negative nominal GDP dynamics. Corporate debt increased in some Member States like Austria, France, Slovakia, Poland or, to a lesser extent, Germany, supported by positive credit flows25.
24
The legacy of high corporate debt is likely to continue to weigh on the economy. High private debt is generally associated with low medium-term growth, although devising specific debt thresholds may be analytically challenging (see references in Chen et al.(2015). 'Private Sector Deleveraging and Growth Following Busts', Working Paper 15/35, International Monetary Fund, Washington). Debt is also seen to have been detrimental to post-crisis economic performance (see Bornhorst, F. and Ruiz Arranz, M. (2013). 'Indebtedness and Deleveraging in the Euro Area.' Country Report 13/232, International Monetary Fund, Washington; and European Central Bank (ECB), (2012), 'Corporate Indebtedness in the Euro Area.' Monthly
Bulletin (February): 87–103.
25
Exchange rate movements, in particular the depreciation of the euro in the second half of 2014, are likely to have caused significant valuation effects raising the value of non-euro denominated debts, e.g. in Ireland or in the Netherlands.
15
Graph 7a:Drivers of households deleveraging (yoy
change in 2015Q1) -10 -8 -6 -4 -2 0 2 4 IE PT ES HU LV NL EL RO SI IT UKDK CZ DE LT EE LU HR CY FR AT PLMTSE FI BE SK Active deleveraging Passive Unsucc. No deleveraging
pp
.
Credit flows
Writeoffs, reclass., val. changes Nom. GDP growth D/GDP, ch.
Graph 7b:Drivers of NFCs deleveraging (yoy
change in 2015Q1) -25 -20 -15 -10 -5 0 5 10 SI PT ES ROHU IE FI LT IT LV DKMTUK CZ HR EL CY EE DE SE PL AT BE SK FR NL Active deleveraging Passive Unsucc. No deleveraging
% of
G
D
P
Credit flows
Writeoffs, reclass., val. changes Nom. GDP growth D/GDP, ch.
Sources: Eurostat, Commission services calculations.
Notes: The graphs present a breakdown of the evolution of the debt-to-GDP ratios into three components: credit
flows, nominal GDP growth (denominator effect) and other changes in the stock of debt. A reduction of leverage can be achieved through different combinations of debt repayment, growth of the economy and other changes in the outstanding debt stock. Active deleveraging involves net repayment of debt (negative net credit flows), usually leading to a nominal contraction of the sector's balance sheet and having, ceteris paribus, adverse effects on economic activity and asset markets. Passive deleveraging, on the other hand, consists in positive net credit flows being outweighed by higher nominal GDP growth, leading to a gradual decrease in debt/GDP. Active deleveraging may turn unsuccessful, if the deflationary effects on GDP lead to stagnation or even an increase in the debt-to-GDP ratio26.
Vulnerabilities in the banking sectors of a number of Member States suggest that impaired access to finance may continue to play a role for debt dynamics. The overall situation of the banking sector has been improving in a majority of Member States. Capital levels have been replenished and now stand at safer overall ratios27. In addition, progress has been made as regards the institutional framework for bank recovery and resolution, which reduces the risk of negative feedback loops between banks and sovereigns. However, vulnerabilities and deleveraging pressures in the financial sector are still evident in several Member States, as also reflected by the decline in the scoreboard indicator of financial liabilities in several cases. In Ireland, Greece, Spain, Italy, Cyprus, Hungary, Portugal, Bulgaria, Romania and Slovenia, banks are still plagued with high non-performing loan ratios in their balance sheets which, in some cases, continued to increase throughout 2014 (Graph 8). In Austria, high exposure to developments abroad may also be a source of vulnerability. Since mid-2014, the reliance on central bank funding has stopped declining, signalling a potential halt in the reduction in financial fragmentation or a reorientation of banks' funding towards cheaper official funds28. In addition, a low growth and a low interest rate environment is weighing on bank profitability in a number of Member States29. In this
26
For a detailed presentation, see P. Pontuch, 'Private sector deleveraging: where do we stand?', Quarterly Report on the Euro Area, 2014(4):7-19.
27
See European Central Bank (2015), 'Financial Stability Review', May 2015, and Joint Committee of the European Supervisory Authorities (2015), 'Joint Committee Report on Risks and Vulnerabilities in the EU Financial System', JC 2015 007.
28
Since last summer, the overall narrowing of TARGET2 balances seems to have come to a halt, mainly driven by developments in Italy, Greece and Spain.
29
The low interest rate environment is also weighing significantly on the profitability of the life insurance sector with return mismatches emerging between low government bond yields and the guarantees offered to customers.
16
environment, taking into account deleveraging pressures in the financial and non-financial sectors, credit contraction continued in 2014 in the most vulnerable countries.
In 2014, the evolution of house prices reflected different positions in housing cycles across the EU. (Graph 9) The annual change in inflation-adjusted house prices in 2014 varied from more than a 5 per cent fall in Slovenia and Greece to surges well above the indicative threshold of 6 per cent in Ireland and Estonia. This widening of the distribution reflects different positions in the housing cycle and different risks30. In some Member States, prices underwent a sharp correction during the crisis and reached levels that are well below what would be implied by fundamentals. This is the case of Irish house prices that sharply increased during the last year. Similarly, Hungary, Estonia, Lithuania and Slovakia also exhibited important real house price increases. House prices in these countries are assessed as still undervalued, so the recovery pace may not signal a new build-up of risks in the near future. Conversely, in Member States where house price are still assessed to be overvalued, such as Sweden or the United Kingdom, house prices increased from very high valuation levels and require careful monitoring31.
Graph 8:Non-Performing Loans ratios (NPLs)
0 5 10 15 20 25 30 35 40 45 50 CY EL IE RO BG HU IT HR SI LT PT ES MT LV CZ SK PL DK FR BE NL UK AT DE EE FI SE LU 2013Q4 2014Q4
Graph 9: House prices: valuation levels in 2013 and
variations in 2014 BE DE IE EL ES FR IT CY LU MT NL AT PT SI SK FI BG CZ DK EE LV LT HU PL RO SE UK HR -20 -15 -10 -5 0 5 10 15 20 -30 -20 -10 0 10 20 30 De fl a ted ho use p rice s 1 y e ar % ch an ge, 2 0 1 4 (% )
Estimated valuation gap, 2013 (%)
Correcting from overvalued levels Overvalued and still
growing Recovering from
undervalued levels
Undervalued and still falling
Sources: For Graph 8: IMF, ECB; for Graph 9: Eurostat, ECB, BIS, OECD, Commission services calculations.
Notes: On Graph 8, figures are all from IMF data except for FR for which the 2013Q4 IMF is extrapolated to
2014 with the ECB 2014H1 change, and for FI for which ECB data are used. For LU, no IMF or ECB figures are available for 2014. On Graph 9, overvaluation gap estimated as an average of the price/income, price/rent and fundamental model valuation gaps32.
The level of government debt, although still high, has started receding thanks to past fiscal consolidation efforts and the pick-up in growth. Government debt, which had been
30
House price developments have to be read in tandem with an assessment of the house price misalignment. 31
Sweden and Luxembourg are the only countries where house prices have been virtually unaffected by the crisis and have been increasing steadily since the mid- 1990s. In the United Kingdom, deflated house prices underwent a correction of some 18 percent from the 2007Q3 peak until 2012, but went up by 8 percent in 2014 only, and continued rising through 2015.
32
An estimate of a house price misalignment gap is obtained as an average of three valuation indicators: (i) the affordability gap (the distance to the long-term average of the price-to-income ratio); (ii) the yield gap (the distance to the long-term average of the price-torent ratio); and (iii) an estimate of deviations of house prices from equilibrium values justified by housing demand and supply fundamentals. For further details, see European Commission: 'Housing market adjustment in the European Union,' box 1.3, in 'European Economic Forecast-Spring 2014,' European Economy 2014(3).
17
rising at a rapid pace since 2007, would only start decreasing this year, remaining at historically very high levels. The reduction in the overall level of public debt results both from the continuing decrease in the overall general government deficit and from the pick-up in nominal growth. As a matter of fact, adjusting for the cycle, the fiscal stance in the euro area and in the EU is broadly neutral, and appropriate to allow downward debt dynamics while supporting the nascent economic recovery. However, in a number of countries, including Greece, Spain, France, Italy, Portugal, the fiscal adjustment is set to slow down despite high government debt levels.
Graph 10:Evolution of the unemployment rate since 2013
BE BG CZ DK DE EE IE EL ES FR HR IT CY LV LT LU HU MT NL AT PL PT RO SI SK FI SE UK -6.0 -5.0 -4.0 -3.0 -2.0 -1.0 0.0 1.0 2.0 0.0 5.0 10.0 15.0 20.0 25.0 30.0 Change i n unem pl oy m ent rat e bet w een 2013Q1 and 20 15Q2 Unemployment rate in 2013Q1 Source: Eurostat
Notes: Latest figure is 2015Q2 except EE IT UK (2015Q1) and IE NL FI SE (2015Q3)
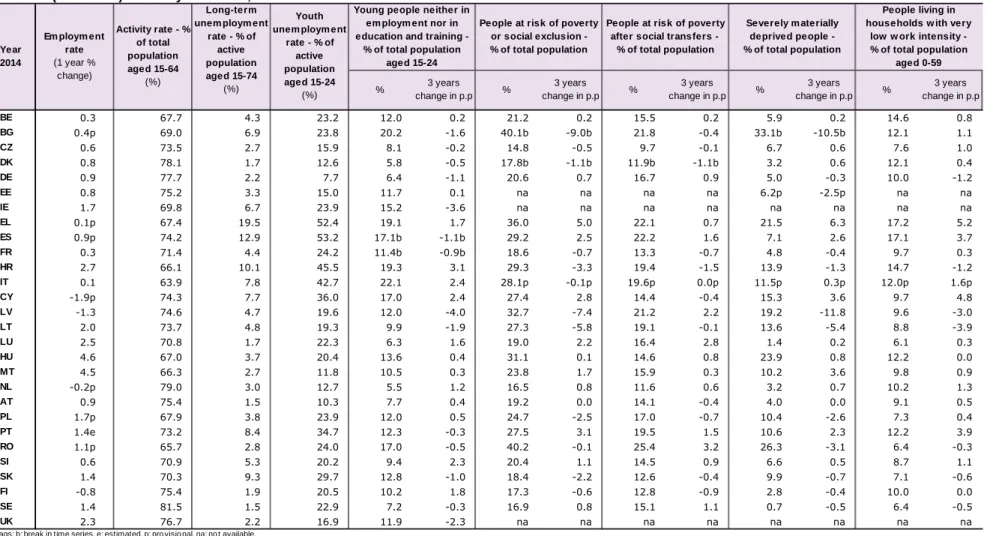
Box 3: Employment and social developments
Labour market conditions in the EU are improving and differences across Member States are decreasing while the social situation in many Member States is still serious.
Main messages from the AMR scoreboard
In 2014, unemploymentrates in the EU were still at very high levels in several countries with the 3-year average exceeding the threshold indicator of 10% in 12 Member States (Bulgaria, Ireland, Greece, Spain, France, Croatia, Italy, Cyprus, Latvia, Lithuania, Portugal and Slovakia). Overall, in 2014, the unemployment rate (age group 15-74) stood at 11.6% and 10.2% in the euro area and the EU. However, a relatively broad-based fall in the unemployment rate started to take place in 2014 as the economic recovery took hold: between 2013 and 2014 the unemployment rate declined on an annual basis by 0.4 pp and 0.7 pp in the euro area and the EU respectively. In high unemployment countries, the improvement was stronger, which contributed to a reduction in the dispersion across the EU and the euro area. The decline in unemployment was particularly marked in Portugal, Spain, Ireland, the Baltic states but also in Hungary, Bulgaria, the United Kingdom and Poland. Conversely, the unemployment rate increased in Italy and Finland, while it broadly stabilised in Germany and France. In general, the improvement was stronger than what GDP growth would imply, on the back of improved confidence, visible effects of structural reforms and reduced ULCs while hours worked remained subdued. In the first half of 2015, the unemployment rate continued to decline in the large majority of EU countries. The drop has been sustained particularly in countries which experienced a rapid increase in the jobless rate during the crisis, including Cyprus, Spain, Greece and Portugal.
18
Activity rates remained resilient in most countries. On aggregate, between 2013 and 2014 an increase
of 0.2 pp and 0.3 pp was recorded in the euro area and the EU respectively, which can largely be attributed to the structural increase in the participation of women and older workers which continued in almost all countries. It also partly reflects the decline of the working age population, in particular in the Baltic states, and, to a lesser extent, in countries hit by the sovereign debt crisis. The 3-year pp. change in the activity rate exceeds the (negative) threshold in two Member States only, namely Portugal and Denmark. In both countries, this development is mostly attributable to the decreasing participation among young cohorts that is not fully matched by the increasing participation of older workers; however, this development should be seen against an observed decrease in the share of young people neither in employment nor education and training which points to an increasing enrolment in education. The combination of resilient activity rates and positive employment growth resulted in falling unemployment rates in the majority of Member States in 2014. In general, employment growth was more pronounced in the tradable sector. This notably reflected a sectoral pattern of wage growth broadly supportive of the reallocation of production from the non-tradable to the tradable sectors as required for external rebalancing of euro area deficit countries.
Overall, the improvement in unemployment rates is mostly linked to a reduction in dismissal rates while job findings rates, though improving, remain below pre-crisis levels. In particular, the recovery of the job finding rates has not been sufficient to avert an increase in long-term-unemployment rates, which was particularly strong over the past three years in 11 Member States, most notably in Greece, Spain, Portugal, Cyprus and Italy; conversely, long-term unemployment has declined in Germany, the Baltic states, Hungary and the United Kingdom. The persistence of long-term unemployment has implications for the efficiency of labour market matching and the risk that unemployment becomes entrenched ("unemployment hysteresis")33. Its high level is also a source of concern because of its grave social implications, such as the depletion of human capital and increases in poverty in the EU since the crisis34.
Although the youth unemployment rate fell at faster rates than overall unemployment, it remains at high levels, amounting to 23.7% and 22.2% in the euro area and in the EU respectively in 2014. In tandem with total unemployment, youth unemployment started decreasing in the second half of 2013, with further improvements in 2014 and beginning of 2015. Among countries with high youth unemployment rates, substantial reductions were registered from the peak of 2013 in Greece, Croatia, Portugal, Slovakia, Bulgaria, Cyprus and Spain. Italy stands out as the only high youth unemployment country in which the situation continued to deteriorate for most of 2014. The overall recent improvement in youth employment is however not sufficient. As a consequence, the 3-year change indicator is still flashing for 13 Member States (Belgium, Greece, Spain, France, Croatia, Italy, Cyprus, Luxembourg, Netherlands, Austria, Portugal, Slovenia, Finland). The decline in youth unemployment is accompanied in most countries by a decline in the share of young people that are neither in employment, education nor training. The NEET rate has declined to 12.4 % in 2014 but remains considerably above pre-crisis levels. The highest NEET rates are recorded in Ireland, Cyprus, Spain, Romania, Croatia, Greece, Bulgaria and Italy, with Italy, Cyprus and Croatia experiencing the highest increases in the last 3-year period. The youth unemployment rate is an early indicator of worsening labour market conditions. It also signals lowered potential output (via a loss of skills formation, scarring effects and foregone earnings in the future) and is associated with a higher level of social exclusion.
Long, drawn-out negative employment and social developments can have a negative impact on potential GDP growth in a variety of ways and risk compounding macroeconomic imbalances.
33
See Draghi, M. (2014), 'Unemployment in the euro area', Speech at the Annual central bank symposium in Jackson Hole, 22 August 2014, and Arpaia, A., Kiss, A. and Turrini, A. (2014) 'Is unemployment structural or cyclical?' Main features of job matching in the EU after the crisis', European Economy, Economic Papers 527, September 2014..
34
See Duiella, M. and Turrini, A. (2014), 'Poverty developments in the EU after the crisis: a look at main drivers', ECFIN Economic Brief, Issue 31, May 2014.
19
Labour mobility
Intra-EU labour mobility further increased in 2014, although the flows remained below the level recorded before 2008. Flows from East to West continued to account for the bulk of movements, driven by differences in GDP per capita and wages. Labour mobility has attenuated disparities in unemployment, and was reflected in the increasing importance of South to North mobility, from countries more affected by the crisis to countries that were less affected. Net outflows notably increased in countries such as Greece, Cyprus and Croatia, while net inflows increased among others in Germany and Austria. Net outflows decelerated in Spain, the Baltic states and in Ireland, where the economic situation has improved noticeably. Over time, wages have become more responsive to asymmetric shocks in national labour markets, and the responsiveness of mobility flows also increased. Still, their contribution to smoothing the overall fluctuations of unemployment remains low35. While mobile EU citizens show higher employment rates on average than the populations of their host countries36, their human capital often appears to be underutilised, along with that of people born outside the EU37.
All in all, risks stemming from vulnerabilities or trends that may potentially contribute to macro-financial instability or disorderly corrections, are present in the majority of Member States. The degree of severity and the urgency to bring forth adequate policy response vary significantly across Member States depending on the nature of the vulnerabilities or unsustainable trends, as well as their confinement to one or several sectors of the economy:
• In some Member States, vulnerabilities are present mainly with respect to the external sector, in the form of large negative net international investment positions. This is the case of catching-up economies like Romania and to a lesser extent, Poland, Latvia, Lithuania, Slovakia and Czech Republic.
• Some countries are characterised by large and persistent current account surpluses. This is notably the case of Germany and the Netherlands, whose sizeable surplus and growing net foreign assets stock may imply rising creditor risks and have potential relevance for the rest of the euro area.
• The combination of large stocks of public debt and a declining trend in potential
growth or competitiveness is a source of concerns in a number of countries despite the
absence of external sustainability risks, as it increases the likelihood of unstable debt-to-GDP trajectories and the vulnerability to adverse shocks. This is the case of countries of systemic relevance like Italy or France, but also of smaller economies like Belgium.
• In a number of economies, possibly unsustainable trends and vulnerabilities are
confined to a particular sector of the economy. In Sweden the main source of concern
pertains to the continuous increase in house prices and household debt. In the Netherlands, household debt is among the highest in the EU, though household
35
European Commission (2015), Labour Market and Wage Developments in Europe 2015, Part II, Chapter 1: Labour mobility and labour market adjustment in the EU.
36
In 2014, the employment rate of people born in another EU country was 67 per cent, while the employment rate of people who were born in the country of residence was 65 per cent. The employment rate of people born outside the EU was 57 per cent (Source: Eurostat Labour Force Statistics, age group: 15 to 64 years). 37
In 2014, the unemployment rate of people born in another EU country was 13 per cent, while the unemployment rate of people who were born in the country of residence was 10 per cent. The unemployment rate of people born outside the EU was 19 per cent. The over-qualification rate, reflecting highly educated workers taking low- or medium skilled jobs, was also markedly higher for EU-mobile than for natives, and even higher for people born outside the EU. (Source: Eurostat Labour Force Statistics).
20
deleveraging is currently at play. This contributes to the Dutch current account surplus, alongside other structural factors, including subdued investment. In both cases, internal trends contribute to the elevated current account surpluses which are otherwise the reflection of structural features of the economy such as the tax structure or the presence of a large number of multinationals. The United Kingdom is also experiencing growing house prices that deserve close monitoring. Its current account deficit, which in particular reflects sustained consumption does not seem to be the reflection of a significant deterioration in price competitiveness. Funding pressures in the Austrian financial sector may constitute a vulnerability. In Estonia, risks linked to the build-up of demand pressures in the domestic economy may need monitoring. Finland is experiencing a challenging structural shift in its economy following the downsizing of the electronics sector. Denmark also enters this category in light of elevated household debt, even though the current assessment of risks does not point to a need for further investigation. This is also the case of Luxembourg and Malta where risks associated with the high level of private debt are contained.
• Some Member States suffer from vulnerabilities in the form of large stocks of net
liabilities concerning a wide range of sectors both domestic and external. This is
notably the case of countries which used to run large current account deficits in association with a credit boom in the domestic economy, simultaneously feeding large negative net international investment positions and elevated private indebtedness. In general, such countries are currently facing high deleveraging needs in a context of limited fiscal space, high non-performing loans and unacceptable levels of unemployment. This typically concerns euro area countries such as Portugal, Spain, Cyprus, Greece, Ireland, and Slovenia. Eastern European countries such as Hungary, Croatia and Bulgaria are also facing difficulties in light of the elevated external and internal liabilities. This poses a challenge especially in Hungary and Bulgaria where the banking sector still needs to pursue a restructuring process.
21
3. IMBALANCES,RISKS AND ADJUSTMENT: COUNTRY-SPECIFIC COMMENTARIES
This section provides a succinct economic reading of the scoreboard and auxiliary variables in each Member State. Together with the discussion of cross-country issues, it helps to identify the Member States for which in-depth reviews (IDRs) should be prepared. As explained above, it will be on the basis of the IDRs that the Commission will conclude whether imbalances or excessive imbalances exist.
The MIP does not apply to Member States benefiting from financial assistance in support of their macroeconomic adjustment programmes38, currently Greece and Cyprus. However, the commentaries below also concern Cyprus. The situation of Cyprus in the context of the MIP, including the preparation of an in-depth review, will be considered at the end of the current financial assistance.
Please refer to the Statistical Annex for the full set of statistics on the basis of which this economic reading and the full report has been prepared.
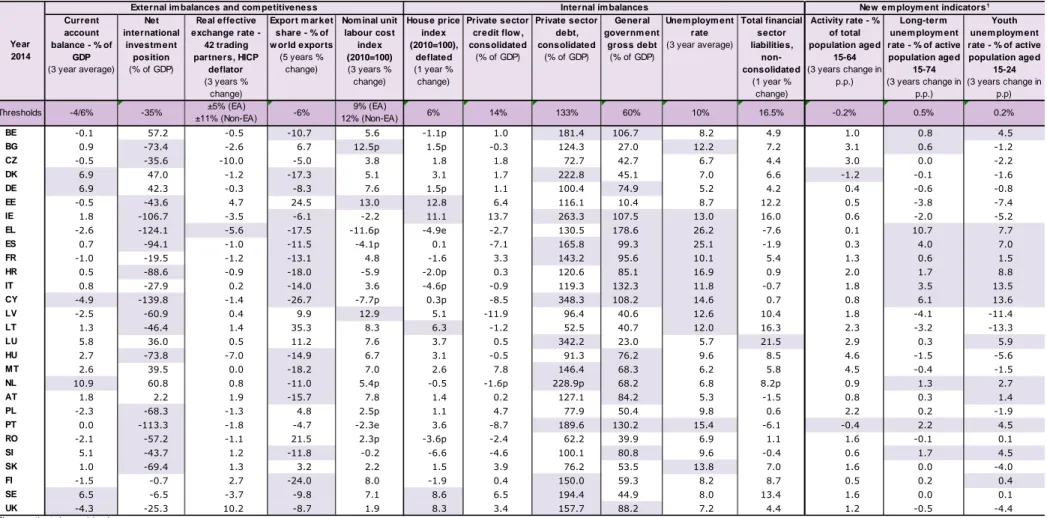
Belgium: In February 2015, the Commission concluded that Belgium was experiencing macroeconomic imbalances, in particular involving competitiveness. In the updated scoreboard, a number of indicators are beyond the indicative threshold, namely losses in export market shares, private and government sector debt as well as the increase in long-term and youth unemployment.
Following a second year of gains in export market shares, the indicator improved in 2014 and is gradually approaching the threshold. This improvement concurs with a strengthening of the current account balance and stable unit labour costs developments. Both are expected to strengthen further in 2015 given favourable terms of trade and low labour cost growth. Overall, while still indicating issues the scoreboard points to a stable or even improving external performance. Indebtedness indicators have been broadly stable for several years, though at a level significantly above the respective thresholds. The high corporate debt reflects the impact of widespread intra-group lending which needs to be taken into
account. The level of household debt remains moderate with risks partially offset by an accumulation of financial assets. Public debt is stable, while contingent liabilities of the public sector to financial institutions have further abated. The financial sector continued its deleveraging, in spite of rising liabilities. The observed increase in unemployment indicators, including long-term and youth unemployment, is mainly driven by the business cycle.
38
This approach which avoids duplication of procedures and reporting obligations has been established in Regulation (EU) No 472/2013 (OJ L 140, 27.5.2013, p. 1). It is also in line with the Commission proposal on a facility for providing financial assistance for Member States outside the euro area (COM(2012)336, 22.6.2012).