Measuring Intellectual Capital of Turkish Banks Listed on Borsa Istanbul
Banking Index (BIST XBANK) with the Market Value / Book Value
Method and Value Added Intellectual Coefficient (VAIC) Model
Mehmet Lütfi Arslan
Istanbul Medeniyet University, Turkey | lutfi.arslan@medeniyet.edu.tr
Cevdet Kızıl
Istanbul Medeniyet University, Turkey | cevdet.kizil@medeniyet.edu.tr
Abstract
Intellectual capital is a critical concept to realize and reflect the real value of organizations. This study took advantage of Market Value (MV) / Book Value (BV) method and Value Added Intellectual Coefficient (VAIC) model to measure and compare intellectual capital of Turkish banks listed on Borsa Istanbul Banking Index (BIST XBANK). Also, financial indicators such as Return on Assets (ROA), Return on Equity (ROE), Leverage, (LEV), Capital Adequacy Ratio (CAR) and intellectual capital performance indicators such as MV/BV ratio, Human Capital Efficiency (HCE), Structural Capital Efficiency (SCE), Capital Employed Efficiency (CEE) and VAIC of banks were compared. Research also ran a Pearson Correlations Test to investigate the relationship between these indicators and to test the hypothesis. Data were gathered from Istanbul Stock Exchange - ISE (Borsa Istanbul), Public Disclosure Platform (KAP), Banks Association of Turkey – TBB (Türkiye Bankalar Birliği), Banking Regulation and Supervision Agency (BRSA), Fortune Turkey, Anadolu Agency and Hurriyet.
Keywords: Banking, BIST, Intellectual Capital, Measurement, VAIC, XBANK
New articles in this journal are licensed under a Creative Commons Attribution 3.0 United States License.
This journal is published by the University Library System of the University of Pittsburgh as part of its D-Scribe Digital Publishing Program, and is cosponsored by the University of Pittsburgh Press.
Mehmet Lütfi Arslan, Cevdet Kızıl
Emerging Markets Journal | P a g e |101
Measuring Intellectual Capital
of Turkish Banks Listed on
Borsa Istanbul Banking Index
(BIST XBANK) with the
Market Value / Book Value
Method and Value Added
Intellectual Coefficient (VAIC)
Model
Mehmet Lütfi Arslan
Cevdet Kızıl
I. Introduction
Studies and research on intellectual capital date back to early 1990s (Marr and Chatzkel, 2004). Thomas Stewart, who popularized the concept, defined intellectual capital as “the talents and skills of individuals and groups; technological and social networks and the software and culture that connect them; and intellectual property such as patents, copyrights, methods, procedures, archives, etc” (1997). However, defnitions and terminology on intellectual capital are still widely discussed (Choong, 2008). A great deal of publications concentrates on theories in a broad level, which are not linked to practice and implementation as well (Johansson et al., 2001; Mouritsen et al., 2002; Wood, 2003; Dumay, 2013). Serious systematic approach is not developed to indentify intangible assets (IA) and intellectual capital (IC) too (Diefenbach, 2006). Also, most organizations still seem to be unclear and unsure about the exact contents of intellectual capital (Andreou et al., 2007).
Intellectual capital is defined separately by different researchers. According to one of the leading definitions, intellectual capital is the difference between a firm‟s market value and book value (Edvinsson and Malone, 1997; Stewart, 1997; Sveiby, 1997; Mouritsen et al., 2001). Actually, the difference between market value and book value is also known as the Goodwill considering acconting science (Ohlson, 1995; Feltham and Ohlson, 1996; Beaver, 1998; Holthausen and Watts, 2001). However, market value - book value and market value / book value formulas are still used to measure and define intellectual capital.
The term intellectual capital is also linked to the term intangible assets (IAs). One of the definitions relating intellectual capital to intangible assets (IAs) indicates that, intangible assets are invisible assets which include a wide range of activities like technology, consumer trust, brand image, corporate culture and management skills (Itami, 1991). Based on a similar definiton, intangible assets are value drivers which transform productive resources into value added assets. Concerning this definition, intangible assets (IA) are
analyzed under two sub-categories that are intellectual property (IP) and knowledge assets (Hall, 1992). In another definiton, intangible assets are defined as all the elements of a firm which exist in addition to working capital and tangible assets. They are the elements, after working capital and tangible assets, which make the organization work and are usually the main contributors to the earning power of the firm. Their existence is dependent on the presence, or expectation, of earnings (Smith, 1994).
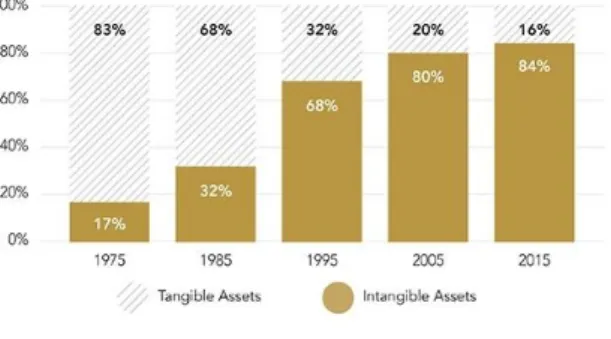
Today, the percentage of intangibles such as intellectual capital has an increasing and more significant role in total market capitalization of firms. In other words, economic value is increasingly intangible. Intellectual capital is boosting the market value of organizations and helping them to gain continuous competitive advantage. The figure below shows the increasing contribution of intangibles to S&P 500 market capitalization (market value) between 1975-2015:
Figure 1. Contribution of Intangibles to S&P 500 Market Capitalization (Market Value) Between
1975-2015
Resource: Ocean Tomo (2017), “Intangible Asset Market Value Study”, Ocean Tomo Official Website - http://www.oceantomo.com/intangible-asset-market-value-study/
Intellectual capital is also described as market assets, human-centered assets, intellectual property assets and infrastructure assets, which result in a value creation for firm in case they are integrated (Brooking, 1997). According to Bontis, intellectual capital (IC) includes and reflects intellectual attributes which can contribute value of an organization (1998). Intellectual capital is linked to technology, technological changes, and issues related to the management of information technology (IT), as well (Davenport and Prusak, 1997).
Intellectual assets (IAs) are described as knowledge and learning capability of a social organism like an organization, intellectual community or professional practice (Nahapiet and Ghoshal, 1998). According to Sullivan, intellectual capital and intangibles are the knowledge which can be turned to profits (2000). Moreover, intangible assets are indicated as a claim to future benefits which do not have a physical substance. This definition underlines the fact that intellectual assets (IAs) and intellectual capital (IA) cover innovation, human capital, organizational capital, and knowledge (Lev, 2001). It is also stated that, intangibles can de characterized by a group of particular attributes, and they
Measuring Intellectual Capital of Turkish Banks Listed on Borsa Istanbul Banking Index (BIST XBANK) with
the Market Value / Book Value Method and Value Added Intellectual Coefficient (VAIC) Model
Page |102| Emerging Markets Journal
have the performance of creating economic benefitsrapidly, in addition to displaying network effects (Daum, 2002). Most studies show that, intellectual capital (IC) and intangible assets (IA) performance increase the overall performance of enterprise (Guthrie et al., 2012). This has led organizations to invest in intangibles such as the intellectual capital at accelerating rates. Figure below shows the intangible and tangible assets investment rates as a percentage of private sector Gross Domestic Product (GDP) between 1977-2014:
Figure 2. Intangible and Tangible Assets Investment Rates as a Percentage of Private Sector Gross Domestic Product (GDP) between 1977-2014 Resource: Vipal Monga (2016), “Accounting‟s 21st Century Challenge: How to Value Intangible Assets”, Wall Street Journal (WSJ), March 21, 2016.
What are the elements of intellectual capital? Rastogi puts forward that intellectal capital (IC) is the result of collaborative effort among the organization‟s human capital, social capital, and knowledge management (2003). Yet, the most common approach is to analyze and categorize intellectual capital under three main elements, which are human capital, structural capital and customer capital (Stewart, 1998; Bontis, 1998). Some scholars also term and name customer capital as the relational capital, but (the conceptualization above as of three components) is still valid (Sveiby, 1997; Bontis, 2002; MERITUM, 2002; Pablos, 2003; Marr and Adams, 2004).
Figure 3. Three Category Classification (Conceptualization) of Intellectual Capital Resource: Bontis, N. (1998), “Intellectual capital: an exploratory study that develops measures and models”, Management Decision, Vol. 36 No. 2, pp. 63-76.
Human capital refers to skill-sets, education, knowledge, abilities, aptitudes and attitudes of human resources (Garcia-Meca, 2006; Kızıl, 2009). Human capital is accepted as a main component (element) of intellectual capital (IC) by several scholars. One of the
main distinctions of human capital is that, it can not be owned by organizations. When an employee leaves a particular business, human capital related to him leaves the business with him. On the other hand, the same can not be said for structural capital as an example (Edvinsson and Malone, 1997; Stewart, 1998). Structural capital includes culture, innovation and, process, where relational capital covers the organizational relationships and cooperations with stakeholders (Marr et al., 2003). For instance, number of clients, stakeholders network, social responsibility projects and sponsorships can be analyzed in the context of relational capital (Kızıl, 2010). There is a debate on intellectual capital measurement as well since the models utilized vary. In other words, a mutual agreement on intellectual capital measurement models does not exist. This is because particular intellectual capital models are not quantitative, but qualitative. Some models are also general and broad (Kaufmann and Schneider, 2004). On the opposite side, intellectual capital measurement is a very critical concept since intellectual capital management becomes impossible without intellectual capital measurement. The well known sentence of “if you can‟t measure it, you can‟t manage it” can be shown as a strong proof and indicator at this point (Kaplan and Norton, 1992).
As there is no common definition or description of intellectual capital, intellectual capital measurement, accounting and reporting techniques also vary. Some of the well known intellectual capital measurement methods are Market Value (MV) / Book Value (BV), Market Value (MV) - Book Value (BV), Skandia (Edvinsson) router pattern, Roos&Roos categorization, Value Added Intellectual Coefficient (VAIC) model, Brooking‟s technology, Monitoring pattern of intangible assets, Economic value added pattern (EVA), Sveiby‟s model, Balanced scorecard pattern, Tobin‟s Q pattern, Sullivan‟s pattern, human resources accounting, the invisible balance sheet, and human resources accounting and costing. All these techniques, creating and using knowledge, are constructed to measure non-financial and qualitative items of intellectual capital (Petty and Guthrie, 2000).
The remainder of this paper is organized as follows: Section II reviews the literature. Data and Methodology follows in Section III. Finally, Section IV includes the Conclusion of research.
II. Literature Review
Cabrita, Ribeiro da Silva, Rodrigues and Munoz Duenas investigated the level of intellectual capital (IC) awareness among Portuguese bank managers in 2017 and tried to find which disclosure techniques were most common. The main aims of this reseach were to investigate how Portuguese bank managers perceived the effect of intellectual capital (IC) disclosure on the bank‟s competitiveness; and to assess the degree to which Portuguese banks voluntarily reported their intelelectual capital (IC) in annual reports vs webpages. Their method included the collection of secondary data – annual reports and websites from the 28 banks operating in Portugal, and semi-structured interviews with 25 banking managers. Content analysis was implemented using a constructed index based on two European frameworks.
Mehmet Lütfi Arslan, Cevdet Kızıl
Emerging Markets Journal | P a g e |103
According to the results of this research, higher level of intellectual capital (IC) disclosure in annual reports were observed more than that observed in websites. Human capital and structural capital were the most reported components in annual reports and, conversely, the disclosure of relational capital was higher in the webpages. Findings were parallel to former literature, which indicated a very low level of intellectual capital (IC) disclosure. Also, interviews showed that not many managers still were able to recognize the need and significance of measuring and reporting intellectual capital (IC). Finally, it was determined that banks were not willing to report information of sensitive nature because of confidentiality issues (Cabrita, Ribeiro da Silva, Rodrigues and Munoz Duenas, 2017).
Nawaz and Haniffa empirically examined the impact of intangible resources (intellectual capital - IC) on financial performance of 64 Islamic financial institutions operating in 18 different countries for the period 2007-2011, while controlling for firm-specific variables, such as, bank size, level of risk, listing status, and firm complexity. Conducted in 2017, the necessary data of this study to compute different constituents of intellectual capital were derived from Bankscope database. Value Added Intellectual Coefficient (VAIC) methodology devised by Pulic was used to detect the effect of intellectual on financial performance of IFIs. Results showed a significant positive relationship between VAIC and accounting performance based on return on assets (ROA). The results also reflected a significant positive relationship between accounting performance and capital employed efficiency (CEE) and human capital efficiency (HCE). However, no significant relationship with regards to structural capital efficiency was determined. The results implied that value creation capability of IFIs was highly affected by HCE and CEE (Nawaz and Haniffa, 2017).
Nawaz did run another research on intellectual capital in 2017. The aim was to provide an insight into the role of knowledge-resources, especially human capital, in times of socio-economic distress using a qualitative research approach. The study showed that this is necessary because the social and economic environment has been transformed seriously in specific regions like Europe since the global financial crisis observed in the fall of 2008. The research reflected how knowledge resources interacted in building knowledge-eco society, how human intellectual capital comes to the scene under hard economic conditions, and how human capital can assist an economy to continue its fiscal position (Nawaz, 2017).
Ikenna and Ursula conducted a research in 2017 about the interaction between corporate performance variables and intellectual capital effectiveness of selected banks in Nigeria. The research implemented ex-post-facto research design on a time series data covering 10 years (2006-2015). The sampling technique was purposive sampling and data were retrieved from the financial statements of the selected banks. Ordinary Least Square regression analysis was employed to test each of the three (3) hypotheses, at 5% level of significance. The results underlined the fact that; intellectual capital contributed positively to asset quality of banks; there was no significant positive impact of intellectual capital on loan quality; there was a significant positive impact of
intellectual capital on net income of the banks (Ikenna and Ursula, 2017).
Akgün and Şamiloğlu‟s research in 2017 tested the financial performance acting as a sample of BIST 100 listed firms, over pre and post crisis reference periods around the current financial crisis. Moreover, this research investigated the effect of cash ratio, liqudity ratio and cash conversion cycle of the recent 2008 global financial crisis on the relation between a firm‟s performance and Economic Value-Added (EVA) using a sample of BIST 100 companies covering the period from 2003 to 2012. Based on research findings, explanatory power of independent variables to explain dependent variables was bigger in the post-financial crisis period. Also, EVA, which is labeled as a measure of modern performance in the post-crisis period, had bigger explanatory power for these variables (Akgün and Şamiloğlu, 2017).
Yükser‟s research dated 2017 revealed a work of the analysis of the relation of the transformative leadership model, which can higher the profitability, activity and sustainability of the banking sector, with the competition superiority and the intellectual property performance. Transformative leadership model perception, firm performance and intellectual capital performances of 134 white collar workers operating in 11 banks in Aydın city center (Turkey) had been measured with surveys and the gathered findings had been evaluated with SPSS 2.1 statistics program. As a result of the evaluations, it was stressed that the competition power based only on the transformative leadership was not permanent in the face of rising globalization trend and ever-increasing competitive behaviors, the banks had to provide intellectual capital factors and improve their performances in addition to increasing their competitive power (Yükser, 2017).
Sarıay and Özulucan applied a comparative application in 2017 by means of techniques Market Value - Book Value, Tobin‟s Q Value of Calculated Intangible Value and Economic Value Added for measuring intellectual capital financially at firm level. In this context, intellectual capital values of the Vakıf Investment Partnership that has been discussed in the study and operating in Istanbul Stock Exchange - ISE (Borsa Istanbul) gauged based on four methods measuring at company level intellectual capital for the years 2010, 2011, 2012, 2013 and 2014. As a result, the intellectual capital values measured by four different techniques for five years of the firm were investigated by comparing based on the methods discussed in the study (Sarıay and Özulucan, 2017).
Thakur did conduct a research in 2017, which attempted to find out the intellectual capital performance of listed public and private banks in India using the Value Added Intellectual Coefficient (VAIC) method. Study covered the period of 2013-2015 and investigated the impact of intellectual capital on banks‟ financial indicators. The mentioned financial indicators included to the research were Return on Assets (ROA) and Return on Equity (ROE). The study benefited from annual reports of banks and panel regression method. Based on research findings, relationships were determined between VAIC and financial performance of the banks to varying degrees (Thakur, 2017).
Measuring Intellectual Capital of Turkish Banks Listed on Borsa Istanbul Banking Index (BIST XBANK) with
the Market Value / Book Value Method and Value Added Intellectual Coefficient (VAIC) Model
Page |104| Emerging Markets Journal
Dönmez and Erol‟s research in 2016 aimed tomeasure and report intellectual capital. In this context, the relationship between financial indicators and intellectual capital of BIST Sustainability Index companies was investigated using the Value Added Intellectual Coefficient (VAIC) method. The study also took advantage of regression analysis and correlation analysis. According to the findings of study, VAIC explained the Return on Assets (ROA) by 93% (Dönmez and Erol, 2016).
Kızıl, Arslan and Şeker investigated the relationship between intellectual capital and web trends of the index bist-30 from an accounting viewpoint in 2014. The trends of web pages and firms were analyzed using specific web means such as the Google Trends. In addition, Market Value / Book Value and Value Added Intellectual Coefficient (VAIC) methods were utilized to measure intellectual capital. Also, enterprise web sites, firm annual reports, company financial statements and Public Disclosure Platform (KAP) were taken advantage for accounting and measurement of intellectual capital (Kızıl, Arslan and Şeker, 2014).
Curado, Guedes and Bontis‟s paper in 2014 tried to evaluate the connection between intellectual capital elements and financial performance across three temporal terms on either side of a financial crisis. The research integrated two data collecting methods. A survey on intellectual capital components was administered during the initial period followed by objective performance ratios in subsequent time terms. Concerning the three terms in the research, evidence proved that intellectual capital scores and points were good predictors of future banking performance. The study was limited to Portuguese banking sector (Curado, Guedes and Bontis, 2014).
Kızıl, Arslan and Şeker‟s research in 2013 focused on the correlation between intellectual capital and web trends of the index bist-30, which held the top 30 companies in Istanbul Stock Exchange - ISE (Borsa Istanbul). The trends of web sites and companies were collected separately via web tools. Also, intellectual capital was studied and measured based on two methods, which were Market Value / Book Value and Value Added Intellectual Coefficient (VAIC) techniques. Data required for studying, measuring and accounting intellectual capital were gathered from web sites, firm annual reports, company financial statements and Public Disclosure Platform (KAP) published by the Borsa Istanbul (BIST) administration (Kızıl, Arslan and Şeker, 2013).
Yalaman‟s study dated 2013 had the aim to analyze empirically the relationship between investment in intellectual capital and the performance of Turkish banking sector both in short and long period between 1995-2006. The intellectual capital performance of quoted banks in Istanbul Stock Exchange (ISE) – Borsa Istanbul market was measured taking advantage of Value Added Intellectual Coefficient (VAIC), and the impact of mentioned intellectual capital components on banking performance was tested utilizing panel data regression analysis. The findings showed that intellectual capital was increasing banks‟ profitability, market value and productivity, especially in the long run (Yalaman, 2013).
Kızıl, Erzin and Kara‟s study in 2013 aimed to analyze intellectual capital measurement, intellectual capital accounting and intellectual capital reporting in the e-commerce industry by researching on Amazon.com. The first section (introduction section) of the study provided general information about the development of intellectual capital concept. The second section included the literature review. The third section mentioned data set and methodology. In the fourth section, the study consisted of intellectual capital measurement, reporting and accounting in the e-commerce industry by running a research on Amazon.com. The fifth section of the study discussed conclusion and recommendations (Kızıl, Erzin and Kara, 2013).
Yıldız‟s research in 2011 had the goal of finding out whether intellectual capital affects banks performance with perception of managers. The research took advantage of the questionnaire method. Surveys were sent to 421 managers of 8 private capital deposit banks in Turkish banking sector which were quoted in Istanbul Stock Exchange (ISE) – Borsa Istanul, formerly named IMKB. The result of this study indicated that, intellectual capital including human, organizational and customer capital had an impact on both subjective and objective performance in a positive way. Elements of intellectual capital affected subjective performance more than objective performance. While the customer and organizational capital particularly affected subjective performance more positively, organizational capital affeced first objective performance. Moreover, based on age, experience, length of employment and position of manager, intellectual capital elements reflected significant differences (Yıldız, 2011).
Murthy and Mouritsen aimed to analyze the link between intellectual capital and financial capital utilizing case study method. This technique helped to discuss how intellectual capital was related to value creation with a degree of nuance that was absent from most statistical studies of relationships between human, organizational, relational and financial capital. Murthy and Mouritsen‟s research dated 2011 tested the relationship between intellectual capital elements and financial capital by the help of interviews. Relationships between intellectual capital and financial capital were challenging to determine since they were complementary rather than causal. Financial capital was not only an impact factor, but also a significant input since the development of intellectual capital took place through the company's budgeting processes (Murthy and Mouritsen, 2011).
Karacan and Ergin‟s study in 2011 had the purpose to investigate whether or not the intellectual capital computed based on the intangible assets method is reflected in the values which investors accord to companies in the Istanbul Stock Exchange – ISE (Borsa Istanbul) banking sector. A new model was developed in this paper for overcoming the limitations of the existing model in the literature. The results reflected that the intellectual capital was highly positively correlated with the market values. The correlation was even stronger for the new model presented in this research. As the importance of the intellectual capital in banking sector was relatively higher than other industries, companies had to give importance to the management of intellectual capital which is not adequately presented and shown by
Mehmet Lütfi Arslan, Cevdet Kızıl
Emerging Markets Journal | P a g e |105
traditional accounting method. The intellectual capital had to be computed and reported to the concerned parties according to that study (Karacan and Ergin, 2011).
Kızıl‟s study in 2009 concentrated on the measurement, evaluation, accounting, reporting and management of intellectual capital in banking industry. The technical part of this study focused on Türkiye Garanti Bankası A. Ş. (Garanti Bank). The intellectual capital report of mentioned bank prepared as a result of technical work had shown that, the human capital and structural capital of company presented some positive and negative trends. However, no weak points had been determined related to relational capital of the firm. Additionally, the technical part of this study had revealed that, intellectual capital of the bank does not reflect stability according to the market value - book value measurement method. While the book value of bank rises systematically every year, fluctuations were observed for its market value. Similar to the market value - book value method, the Value Added Intellectual Coefficient (VAIC) method also pointed that intellectual capital of the bank was away from being stable. On the other hand, in regards to both methods, intellectual capital of the enterprise did prosper in 2005 and weakened in 2008. Besides, in the light of Value Added Intellectual Coefficient (VAIC) method, bank‟s value added, financial capital, physical capital, human capital and structural capital had been rising steadily. Finally, correlation analysis of this paper indicated that, a very strong relationship did exist between the bank‟s human capital efficiency and the structural capital efficiency (Kızıl, 2009).
Öztürk and Demirgüneş did run a research in 2007, which investigated the effect of intellectual capital on firm value using the Value Added Intellectual Coefficient (VAIC) method. Study covered 30 manufacturing companies whose stocks are listed on Istanbul Stock Exchange - ISE (Borsa Istanbul) between 2000-2002. According the findings of research, Capital Employed Efficiency (CEE) and Structural Capital Efficiency (SCE) had an impact on firm profitability, efficiency and market value (Kartal and Demirgüneş, 2007).
Guthrie and Petty‟s reseach in 2000 reported the findings of an empirical examination of Australian annual reporting of intellectual capital. The findings indicated that the development of a model for reporting intangibles was partial and not widely spread. The results of their exploratory investigation were threefold. First, the key components of intellectual capital were poorly understood, inadequately identified, inefficiently managed, and not reported. Second, the fundamental fields of intellectual capital reporting focused on human resources; technology and intellectual property rights; and organizational and workplace structure. Third, a comprehensive management framework for intellectual capital was yet to be developed, particularly for collecting and reporting intellectual capital formation. As a result, Australian firms did not compare favourably with numerous European companies in their ability to measure and report their intellectual capital in the annual report (Guthrie and Petty, 2000).
Bontis had published a paper in 1998 detailing an empirical pilot study which explored the development of numerous conceptual measures and models concerning intellectual capital and its effect on business performance. The aim of this pilot study was to explore
the improvement of items and constructs through principal components analysis and partial least squares (PLS). Subjective measures and optimal structural specification reflected a valid, reliable, significant and substantive causal relationship between dimensions of intellectual capital and business performance. According to the paper, the mentioned results could assist both academics and practitioners more readily understand the elements of intellectual capital and provide insight into developing and increasing it within a company (Bontis, 1998).
Hubert Saint-Onge explained in 1996 that, in an environment of shortened business cycles and fast technological change, the intellectual capital framework represented the primary value creation dynamics of the organizations. Working for several years at the Canadian Imperial Bank of Commerce (CIBC) to understand the concept of intellectual capital, his work had created a path for him to define intellectual capital, explore the roles of both explicit and tacit knowledge in the three constituent elements of intellectual capital, and, finally, to improve ways of encouraging value creation in mentioned elements in aid of firm strategies (Saint-Onge, 1996).
III. Data and Methodology
This study utilizes Market Value (MV) / Book Value (BV) method and Value Added Intellectual Coefficient (VAIC) model to measure and compare intellectual capital of Turkish banks listed on Borsa Istanbul Banking Index (BIST XBANK). Besides, financial indicators such as Return on Assets (ROA), Return on Equity (ROE), Leverage, (LEV), Capital Adequacy Ratio (CAR) and intellectual capital performance indicators such as MV/BV ratio, Human Capital Efficiency (HCE), Structural Capital Efficiency (SCE), Capital Employed Efficiency (CEE) and VAIC of banks were compared. Research also ran a Pearson Correlations Test to investigate the relationship between the mentioned indicators (variables) and to test the hypothesis. Data were retrieved from Istanbul Stock Exchange - ISE (Borsa Istanbul), Public Disclosure Platform (KAP), Banks Association of Turkey – TBB (Türkiye Bankalar Birliği), Banking Regulation and Supervision Agency (BRSA), Fortune Turkey, Anadolu Agency and Hurriyet. First MV / BV method was employed to measure and compare intellectual capital of banks.
Measuring Intellectual Capital of Turkish Banks Listed on Borsa Istanbul Banking Index (BIST XBANK) with
the Market Value / Book Value Method and Value Added Intellectual Coefficient (VAIC) Model
Page |106| Emerging Markets Journal
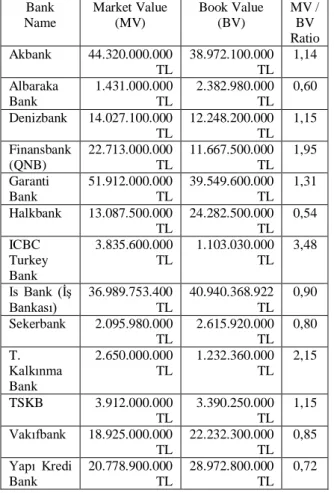
Table 1: Market Value (MV), Book Value (BV),MV / BV Ratios of Turkish Banks listed on Borsa Istanbul Banking Index (BIST XBANK) Bank Name Market Value (MV) Book Value (BV) MV / BV Ratio Akbank 44.320.000.000 TL 38.972.100.000 TL 1,14 Albaraka Bank 1.431.000.000 TL 2.382.980.000 TL 0,60 Denizbank 14.027.100.000 TL 12.248.200.000 TL 1,15 Finansbank (QNB) 22.713.000.000 TL 11.667.500.000 TL 1,95 Garanti Bank 51.912.000.000 TL 39.549.600.000 TL 1,31 Halkbank 13.087.500.000 TL 24.282.500.000 TL 0,54 ICBC Turkey Bank 3.835.600.000 TL 1.103.030.000 TL 3,48 Is Bank (İş Bankası) 36.989.753.400 TL 40.940.368.922 TL 0,90 Sekerbank 2.095.980.000 TL 2.615.920.000 TL 0,80 T. Kalkınma Bank 2.650.000.000 TL 1.232.360.000 TL 2,15 TSKB 3.912.000.000 TL 3.390.250.000 TL 1,15 Vakıfbank 18.925.000.000 TL 22.232.300.000 TL 0,85 Yapı Kredi Bank 20.778.900.000 TL 28.972.800.000 TL 0,72
Resource: Table composed by authors
Based on Table 1, the highest Market Value (MV) / Book Value (BV) ratio belongs to ICBC Turkey Bank (Çin Endüstri ve Ticaret Bankası) with 3,48. ICBC Turkey Bank is followed by T. Kalkınma Bank (Türkiye Kalkınma Bankası) with a ratio of 2,15. Third rank belongs to Finansbank (QNB) with the rate of 1,95. Garanti Bank is fourth with 1,31. The fifth place is shared by Denizbank and TSKB (Türkiye Sınai Kalkınma Bankası) with a ratio of 1,15. They are followed by Akbank that has a MV / BV of 1,14. Is Bank (İş Bankası) has a ratio of 0,90 and Vakıfbank has a ratio of 0,85. Sekerbank‟s MV/BV ratio is 0,80. Yapı Kredi Bank (Yapı ve Kredi Bankası) follows with a ratio of 0,72. Then comes Albaraka Bank, which has a MV / BV of 0,60. The last rank belongs to Halkbank (Türkiye Halk Bankası) that has a MV / BV ratio of 0,54.
The consecutive ranking of Turkish banks listed on Borsa Istanbul Banking Index (BIST XBANK) according to their Market Value (BV) / Book Value ratios is listed below:
Table 2: Ranking of Turkish Banks listed on Borsa Istanbul Banking Index (BIST XBANK) based
on Market Value (MV), Book Value (BV), MV / BV Ratios
Resource: Table composed by authors
Value Added Intellectual Coefficient (VAIC) method was also used in this study to measure the intellectual capital performance of Akbank, Albaraka Bank, Denizbank, Finansbank (QNB), Garanti Bank, Halkbank, ICBC Turkey Bank, Is Bank ( İş Bankası), Sekerbank, T. Kalkınma Bank, TSKB, Vakıfbank and Yapı Kredi Bank for September 2017 period. The term (financial period) of September 2017 was especially chosen since the banks‟ market values (MV), book values (BV) and MV/BV ratios were also retrieved and calculated as of September 2017. Thus, the term (financial period) of September 2017 was preferred to enable comparisons.
The VAIC method was proposed by Pulic (2004). This technique actually measures the intellectual capital performance of organizations by using the publicly available accounting data. In other words, the VAIC model helps to present the intellectual capital success of a firm by benefiting from financial statements. Thus, externally (independently) audited non-consolidated financial statements and operating reports of the banks which are accessible from the websites of Banks Association of Turkey – TBB (Türkiye Bankalar Birliği), Banking Regulation and Supervision Agency (BRSA) and Public Disclosure Platform (KAP) were used to retrieve data.
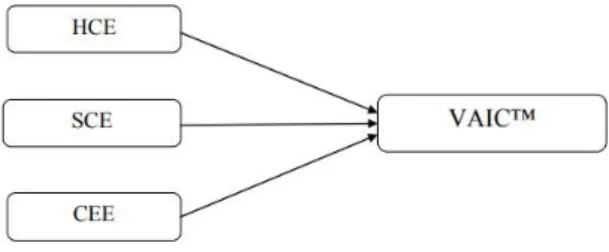
A higher VAIC score (point) means a stronger intellectual capital for the organization. VAIC is calculated by adding human capital efficiency (HCE), structural capital efficiency (SCE) and capital employed efficiency (CEE). Ante Pulic‟s Value Added Intellectual Coefficient (VAIC) Model is shown below:
Mehmet Lütfi Arslan, Cevdet Kızıl
Emerging Markets Journal | P a g e |107
Figure 4. Ante Pulic’s VAIC Model Resource: Pulic, A. (2004). “Intellectual Capital-Does It Create or Destroy Value?”, Measuring Business Excellence, Vol.8 No:1, pp.62-68.
The related formulas to calculate the VAIC of a company are indicated below:
VAIC (Value Added Intellectual Capital) = HCE (Human Capital Efficiency) + SCE (Structural Capital Efficiency) + CEE (Capital Employed Efficiency) HCE (Human Capital Efficiency) = Value Added (VA) / Human Capital (HC) VA = OP + EC + D + A Where; OP = Operating Profit EC = Employee Cost D = Depreciation A = Amortization
VA can also be calculated as; VA = Output - Input
Output = Total Income from all Products and Services Sold
Input = Total expenses and Costs incurred excluding Personnel Expenses
Human Capital (HC) = Personnel Expenses
SCE (Structural Capital Efficiency) = Structural Capital (SC) / Value Added (VA)
SC (Structural Capital) = Value Added (VA) - Human Capital (HC)
CEE (Capital Employed Efficiency) = Value Added (VA) / Capital Employed (CE)
Capital Employed (CE) = Financial Capital (FC) + Physical Capital (PC)
Financial Capital (FC) = Cash and Balances With Central Bank Amounts + Financial Assets (Net) at Fair Value through Profit or Loss + Banks + Receivables from Money Market + Available for Sale Financial Assets (Net) on the Balance Sheet
Physical Capital (PC) = Tangible-Fixed Assets (Net) on the Balance Sheet
Personnel Expenses (Employee Salaries and Wages) are considered as the human capital (HC) of an organization, since they are accepted as the investment of firm in VAIC model. Capital Employed (CE) stands for the integration and efficient use of financial capital (FC) and physical capital (PC) for creating value.
Based on the related formulas, VAIC of 13 Turkish Banks listed on Borsa Istanbul Banking Index (BIST XBANK) for September 2017 period are shown below: Akbank VA = 5.875.763.000 TL Akbank HC = 1.360.916.000 TL Akbank HCE = 4,31 Akbank SC = 4.514.847.000 TL Akbank SCE = 0,76 Akbank CE = 3.289.943.000 TL + 86.442.923.000 TL = 89.732.866.000 TL Akbank CEE = 0,06 Akbank VAIC = 5,13 Albaraka Bank VA = 469.866.000 TL Albaraka Bank HC = 328.749.000 TL Albaraka Bank HCE = 1,42
Albaraka Bank SC = 141.117.000 TL Albaraka Bank SCE = 0,30
Albaraka Bank CE = 564.832.000 TL + 8.784.196.000 TL = 9.349.028.000 TL
Albaraka Bank CEE = 0,05 Albaraka Bank VAIC = 1,77 Denizbank VA = 2.329.393.000 TL Denizbank HC = 924.445.000 TL Denizbank HCE = 2,51 Denizbank SC = 1.404.948.000 TL Denizbank SCE = 0,60 Denizbank CE = 407.461.000 TL + 28.112.873.000 TL = 28.520.334.000 TL Denizbank CEE = 0,08 Denizbank VAIC = 3,19 Finansbank (QNB) VA = 2.153.686.000 TL Finansbank (QNB) HC = 920.813.000 TL Finansbank (QNB) HCE = 2,33 Finansbank (QNB) SC = 1.232.873.000 TL Finansbank (QNB) SCE = 0,57 Finansbank (QNB) CE = 1.813.194.000 TL + 26.794.319.000 TL = 28.607.513.000 TL Finansbank (QNB) CEE = 0,07 Finansbank (QNB) VAIC = 2,97 Garanti Bank VA = 6.649.118.000 TL Garanti Bank HC = 2.004.267.000 TL Garanti Bank HCE = 3,31
Garanti Bank SC = 4.644.851.000 TL Garanti Bank SCE = 0,69
Garanti Bank CE = 3.457.737.000 TL + 69.699.000 TL = 73.156.766.000 TL
Measuring Intellectual Capital of Turkish Banks Listed on Borsa Istanbul Banking Index (BIST XBANK) with
the Market Value / Book Value Method and Value Added Intellectual Coefficient (VAIC) Model
Page |108| Emerging Markets Journal
Garanti Bank CEE = 0,09Garanti Bank VAIC = 4,09 Halkbank VA = 4.480.372.000 TL Halkbank HC = 1.470.269.000 TL Halkbank HCE = 3,04 Halkbank SC = 3.010.103.000 TL Halkbank SCE = 0,67 Halkbank CE = 2.333.937.000 TL + 56.137.985.000 TL = 58.471.922.000 TL Halkbank CEE = 0,07 Halkbank VAIC = 3,78
ICBC Turkey Bank VA = 131.860.000 TL ICBC Turkey Bank HC = 83.662.000 TL ICBC Turkey Bank HCE = 1,57 ICBC Turkey Bank SC = 48.198.000 TL ICBC Turkey Bank SCE = 0,36
ICBC Turkey Bank CE = 26.840.000 TL + 4.101.718.000 TL = 4.128.558.000 TL
ICBC Turkey Bank CEE = 0,03 ICBC Turkey Bank VAIC = 1,96
Is Bank (İş Bankası) VA = 6.614.406.000 TL Is Bank (İş Bankası) HC = 2.511.155.000 TL Is Bank (İş Bankası) HCE = 2,63
Is Bank (İş Bankası) SC = 4.103.251.000 TL Is Bank (İş Bankası) SCE = 0,2
Is Bank (İş Bankası) CE = 4.458.746.000 TL + 87.014.214.000 TL= 91.472.960.000 TL
Is Bank (İş Bankası) CEE = 0,07 Is Bank (İş Bankası) VAIC = 2,9 Sekerbank VA = 365.888.000 TL Sekerbank HC = 289.574.000 TL Sekerbank HCE = 1,26 Sekerbank SC = 76.314.000 TL Sekerbank SCE = 0,2 Sekerbank CE = 1.020.083.000 TL + 5.436.703.000 TL = 6.456.786.000 TL Sekerbank CEE = 0,05 Sekerbank VAIC = 1,51 T. Kalkınma Bank VA = 149.408.000 TL T. Kalkınma Bank HC = 44.855.000 TL T. Kalkınma Bank HCE = 3,33
T. Kalkınma Bank SC = 104.553.000 TL T. Kalkınma Bank SCE = 0,69
T. Kalkınma Bank CE = 63.650.000 TL + 1.424.137.000 TL
T. Kalkınma Bank CEE = 0,10 T. Kalkınma Bank VAIC = 4,12 TSKB VA = 513.827.000 TL TSKB HC = 61.564.000 TL TSKB HCE = 8,34 TSKB SC = 452.263.000 TL TSKB SCE = 0,88 TSKB CE = 49.914.000 TL + 4.376.780.000 TL = 4.426.694.000 TL TSKB CEE = 0,11 TSKB VAIC = 9,33 Vakıfbank VA = 4.115.511.000 TL Vakıfbank HC = 1.293.427.000 TL Vakıfbank HCE = 3,18 Vakıfbank SC = 2.822.084.000 TL Vakıfbank SCE = 0,68 Vakıfbank CE = 1.380.771.000 TL + 47.470.698.011 TL = 48.851.469.011 TL Vakıfbank CEE = 0,08 Vakıfbank VAIC = 3,94
Yapı Kredi Bank VA = 2.587.443.000 TL Yapı Kredi Bank HC = 1.746.075.000 TL Yapı Kredi Bank HCE = 1,48
Yapı Kredi Bank SC = 841.368.000 TL Yapı Kredi Bank SCE = 0,32
Yapı Kredi Bank CE = 2.582.219.000 TL + 61.214.100.000 TL = 63.796.319.000 TL
Yapı Kredi Bank CEE = 0,04 Yapı Kredi Bank VAIC = 1,84
The consecutive ranking of Turkish banks listed on Borsa Istanbul Banking Index (BIST XBANK) according to their VAIC is listed below:
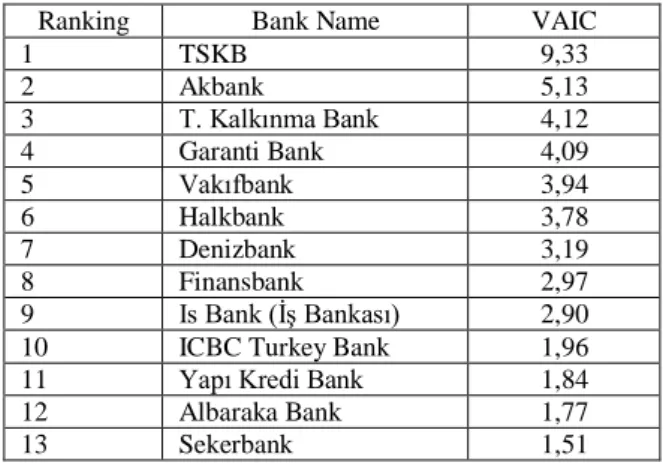
Table 3: Ranking of Turkish Banks listed on Borsa Istanbul Banking Index (BIST XBANK) based
on their VAIC
Ranking Bank Name VAIC
1 TSKB 9,33 2 Akbank 5,13 3 T. Kalkınma Bank 4,12 4 Garanti Bank 4,09 5 Vakıfbank 3,94 6 Halkbank 3,78 7 Denizbank 3,19 8 Finansbank 2,97 9 Is Bank (İş Bankası) 2,90
10 ICBC Turkey Bank 1,96
11 Yapı Kredi Bank 1,84
12 Albaraka Bank 1,77
13 Sekerbank 1,51
Resource: Table composed by authors
Based on the VAIC values of Turkish banks listed on Borsa Istanbul Banking Index (BIST XBANK), TSKB ranks 1st with the highest score of 9,33. Akbank follows as 2nd with a VAIC of 5,13. T. Kalkınma Bank ranks 3rd with 4,12 , Garanti Banks ranks 4th with 4,09 , Vakıfbank ranks 5th with 3,94 , Halkbank ranks 6th with 3,78 , Denizbank ranks 7th with 3,19 , Finansbank ranks 8th with 2,97 , Is Bank (İş Bankası) ranks 9th with 2,90 , ICBC Turkey Bank ranks 10th with 1,96 , Yapı Kredi Bank ranks 11th with 1,84 , Albaraka Bank ranks 12th with 1,77 and Sekerbank ranks the last (13th) with 1,51.
MV/BV ratios and VAIC values of Turkish banks listed on Borsa Istanbul Banking Index (BIST XBANK) are compared below with the following table by indicating the institutions‟ rankings:
Mehmet Lütfi Arslan, Cevdet Kızıl
Emerging Markets Journal | P a g e |109
Table 4: MV / BV Ratios, VAIC, MV/BV Ratio Ranks and VAIC Ranks of Turkish Banks listed on
Borsa Istanbul Banking Index (BIST XBANK) Bank Name MV / BV Ratio VAIC MV/BV Ratio Rank VAIC Rank Akbank 1,14 5,13 7 2 Albaraka Bank 0,60 1,77 12 12 Denizbank 1,15 3,19 5 7 Finansbank (QNB) 1,95 2,97 3 8 Garanti Bank 1,31 4,09 4 4 Halkbank 0,54 3,78 13 6 ICBC Turkey Bank 3,48 1,96 1 10 Is Bank (İş Bankası) 0,90 2,90 8 9 Sekerbank 0,80 1,51 10 13 T. Kalkınma Bank 2,15 4,12 2 3 TSKB 1,15 9,33 6 1 Vakıfbank 0,85 3,94 9 5 Yapı Kredi Bank 0,72 1,84 11 11
Resource: Table composed by authors
As observed from the table, MV/BV ratio and VAIC performances of Turkish banks listed on Borsa Istanbul Banking Index (BIST XBANK) are parallel for some institutions while the same can not be said for others. As an example, Akbank‟s VAIC performance is high with its 2nd rank, while its MV/BV ratio performance is average with its 7th rank. Albaraka Bank‟s MV/BV ratio and VAIC performances are parallel with 12th ranks, which are unsatisfactory. Denizbank‟s VAIC performance is average with 7th rank while its MV/BV ratio performance is good with 5th rank. Finansbank (QNB)‟s VAIC performance is low with 8th rank, but its MV/BV ratio performance is good with 3rd rank. Garanti Bank ranks 4th both for MV/BV ratio and VAIC, so its performance is good for both indicators. Halkbank‟s VAIC performance is average with 6th rank, but its MV/BV ratio is unsatisfactory with 13th rank. ICBC Turkey Bank has a low performance in terms of VAIC with 10th rank, but has a very good performance for MV/BV ratio with 1st rank. Is Bank (İş Bankası) ranks 9th for VAIC and 8th for MV/BV ratio, thus its performance for both indicators is unsatisfactory. Sekerbank ranks 13th for VAIC and 10th for MV/BV ratio, so its performance for both indicators is low. T. Kalkınma Bank ranks 3rd for VAIC and 2nd for MV/BV ratio, meaning it has a very good overall performance. TSKB has a very good VAIC performance with 1st rank, but an average MB/BV ratio performance with 6th rank. Vakıfbank has a good VAIC performance with 5th rank, but a bad MV/BV performance with 9th rank. Finally, Yapı Kredi Bank shows an unsatisfactory performance for the VAIC and MV/BV ratio with 11th rank for both.
Aggregate performances and ranks of Turkish banks listed on Borsa Istanbul Banking Index (BIST XBANK) are presented below when MV/BV ratios and VAIC
values are considered simultaneously (MV/BV ratio + VAIC):
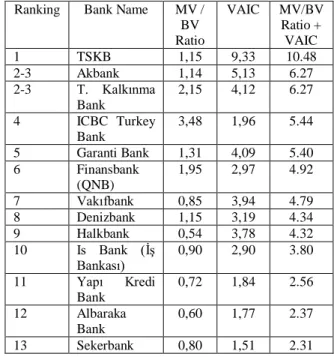
Table 5: Aggregate Performances and Ranks of Turkish Banks listed on Borsa Istanbul Banking
Index (BIST XBANK) – MV/BV Ratio + VAIC Ranking Bank Name MV /
BV Ratio VAIC MV/BV Ratio + VAIC 1 TSKB 1,15 9,33 10.48 2-3 Akbank 1,14 5,13 6.27 2-3 T. Kalkınma Bank 2,15 4,12 6.27 4 ICBC Turkey Bank 3,48 1,96 5.44 5 Garanti Bank 1,31 4,09 5.40 6 Finansbank (QNB) 1,95 2,97 4.92 7 Vakıfbank 0,85 3,94 4.79 8 Denizbank 1,15 3,19 4.34 9 Halkbank 0,54 3,78 4.32 10 Is Bank (İş Bankası) 0,90 2,90 3.80 11 Yapı Kredi Bank 0,72 1,84 2.56 12 Albaraka Bank 0,60 1,77 2.37 13 Sekerbank 0,80 1,51 2.31
Resource: Table composed by authors
Based on Aggregate performances and ranks of Turkish banks listed on Borsa Istanbul Banking Index (BIST XBANK) when MV/BV ratios and VAIC values are considered simultaneously (MV/BV ratio + VAIC), TSKB ranks 1st with 10,48. Akbank and T. Kalkınma Bank share 2nd and 3rd places with 6,27 points each. ICBC Turkey Bank ranks 4th with 5,44 and Garanti Bank ranks 5th with 5,40. Finansbank (QNB) ranks 6th with 4,92. Vakıfbank ranks 7th with 4,79 and Denizbank ranks 8th with 4,34. Halkbank takes the 9th place with 4,32 and Is Bank (İş Bankası) takes the 10th place with 3,80. Yapı Kredi Bank ranks 11th with 2,56 and Albaraka Bank ranks 12th with 2,37. Finally, Sekerbank ranks the last (13th) with 2,31.
Intellectual capital performance indicators such as MV/BV ratio and VAIC are discussed so far for Turkish banks listed on Borsa Istanbul Banking Index (BIST XBANK). However, the banks also have some particular financial indicators such as Return on Assets (ROA), Return on Equity (ROE), Leverage Ratio (LEV) and Capital Adequacy Ratio (CAR). Data for these financial indicators are retrieved from resources such as Istanbul Stock Exchange – ISE (Borsa Istanbul) (2017), Public Disclosure Platform (KAP) (2017), Banks Association of Turkey – TBB (Türkiye Bankalar Birliği) (2017), Banking Regulation and Supervision Agency (BRSA) (2017), Fortune Turkey (2017), Anadolu Agency (2017) and Hurriyet (2017).
ROA = Net Income / Total Assets ROE = Net Income / Shareholders‟ Equity
Measuring Intellectual Capital of Turkish Banks Listed on Borsa Istanbul Banking Index (BIST XBANK) with
the Market Value / Book Value Method and Value Added Intellectual Coefficient (VAIC) Model
Page |110| Emerging Markets Journal
LEV = Tier 1 Capital / Average Total ConsolidatedAssets and Certain Off-Balance Sheet Exposures CAR = (Tier 1 Capital + Tier 2 Capital) / Risk Weighted Assets
The table below shows ROAs, ROA ranks, ROEs, ROE ranks, LEVs, LEV ranks, CARs and CAR ranks of Turkish banks listed on Borsa Istanbul Banking Index (BIST XBANK):
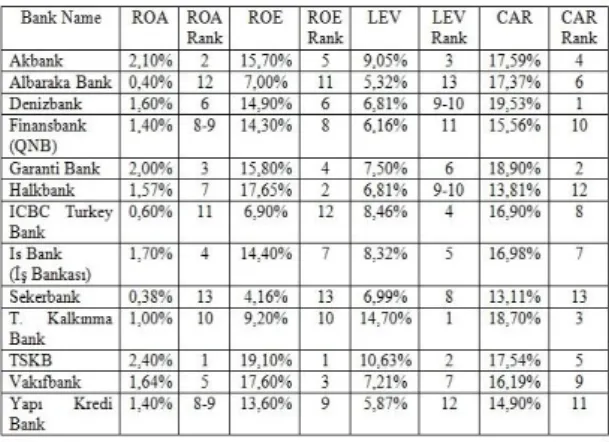
Table 6: ROAs, ROA ranks, ROEs, ROE ranks, LEVs, LEV ranks, CARs and CAR ranks of Turkish banks listed on Borsa Istanbul Banking Index (BIST
XBANK)
Resource: Table composed by authors
According to Table 6, Akbank has a good performance in terms of ROA, ROE, LEV and CAR. Albaraka Bank has an unsatisfactory performance in ROA, ROE and LEV, but an average performance in CAR. Denizbank has an average performance for ROA and ROE, an unsatisfactory performance for LEV, but a very food performance for CAR. Finansbank (QNB) has an unsatisfactory performance for ROA, ROE, LEV and CAR. Garanti Bank has a good performance for ROA, ROE and CAR, and an average performance for LEV. Halkbank has an average performance for ROA, good performance for ROE, but an unsatisfactory performance for LEV and CAR. ICBC Turkey has an unsatisfactory performance for ROA, ROE and CAR, but a good performance for LEV. Is Bank (İş Bankası) has a good performance for ROA and LEV, and an average performance for ROE and CAR. Sekerbank has an unsatisfactory performance for ROA, ROE, LEV and CAR. T. Kalkınma Bank has an unsatisfactory performance for ROA and ROE, but a good performance for LEV and CAR. TSKB has a good performance for ROA, ROE, LEV and CAR. Vakıfbank has a good performance for ROA and ROE, an average performance for LEV and an unsatisfactory performance for CAR. Yapı Kredi Bank has an unsatisfactory performance for ROA, ROE, LEV and CAR.
When the financial indicators and intellectual capital performance indicators are evaluated altogether, the following table should be analyzed:
Table 7: ROAs, ROA ranks, ROEs, ROE ranks, LEVs, LEV ranks, CARs, CAR ranks, MV/BV ratios,
MV/BV ratio ranks, VAICs and VAIC ranks of Turkish banks listed on Borsa Istanbul Banking
Index (BIST XBANK)
Resource: Table composed by authors
Based on Table 7, specific banks reflect a good performance in terms of financial indicators and intellectual capital performance indicators, while the same can not be said for other banks. Akbank, Garanti Bank and TSKB are the institutions which show a good performance both in terms of financial indicators and intellectual capital performance indicators. On the other hand, Albaraka Bank, Sekerbank and Yapı Kredi bank are the institutions which show an unsatisfactory performance both in terms of financial indicators and intellectual capital performance indicators. Remaining banks‟ financial indicators and intellectual capital performance indicators have ups and downs.
This study also ran a Pearson Correlations test to investigate the relationship between financial indicators (ROA, ROE, LEV, CAR) and intellectual capital performance indicators (MV/PV, HCE, SCE, CEE, VAIC) of Turkish banks listed on Borsa Istanbul Banking Index (BIST XBANK). In order to realize this purpose, specific hypothesis were posed. The following hypothesis were extracted as a result of extensive literature review on intellectual capital:
Research Hypothesis:
H1a: There is a positive strong/very strong relationship between VAIC and HCE
H1b: There is a positive strong/very strong relationship between VAIC and SCE
H1c: There is a positive strong/very strong relationship between VAIC and ROA
H2a: There is a positive strong/very strong relationship between HCE and SCE
H2b: There is a positive strong/very strong relationship between HCE and CEE
H2c: There is a positive strong/very strong relationship between SCE and CEE
H3a: There is a positive strong/very strong relationship between HCE and ROA
H3b: There is a positive strong/very strong relationship between SCE and ROA
Mehmet Lütfi Arslan, Cevdet Kızıl
Emerging Markets Journal | P a g e |111
H3c: There is a positive strong/very strong relationship between CEE and ROAH4a: There is a positive strong/very strong relationship between ROE and ROA
H4b: There is a positive strong/very strong relationship between ROE and HCE
H4c: There is a positive strong/very strong relationship between ROE and SCE
The table below shows the Pearson Correlations Test for indicators (variables):
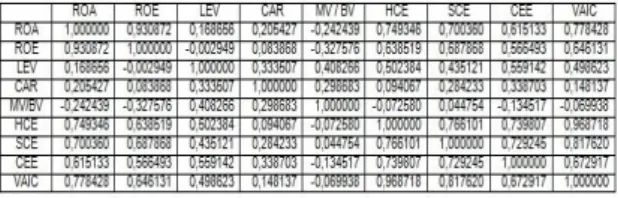
Table 8: Pearson Correlations Test for Financial Indicators (ROA, ROE, LEV, CAR) and Intellectual Capital Indicators (MV/BV, HCE, SCE, CEE, VAIC)
Resource: Table composed by authors
Correlation coefficients (r) vary between -1 and +1 (Dönmez and Erol, 2016). A negative correlation stands for relationship in the opposite direction while a positive correlation stands for parallel relationship in the same direction (Kalaycı, 2009). Correlation coefficients (r) are very important and should be interpreted correctly. The following ranges are used to interpret the strength of correlation coefficients (r):
0,00 < r < 0,25 = Very low relationship 0,26 < r < 0,49 = Low relationship 0,50 < r < 0,69 = Moderate relationship 0,70 < r < 0,89 = Strong relationship 0,90 < r < 1,00 = Very strong relationship Thus, there is a very strong positive relationship between ROA and ROE as well as HCE and VAIC of Turkish banks listed on Borsa Istanbul Banking Index (BIST XBANK). Also, there is a strong positive link between ROA and HCE as well as ROA and SCE. Likewise, there is a strong positive connection between ROA and SCE. There is a strong positive correlation between ROA and VAIC as well. Additionally, there is a strong positive relationship between HCE and SCE. Similarly, there is a strong correlation between HCE and CEE. Moreover, a strong positive link between SCE and CCE is detected. Finally, there is a strong positive correlation between SCE and VAIC. So, hypothesis 1a, hypothesis 1b, hypothesis 1c, hypothesis 2a, hypothesis 2b, hypothesis 2c, hypothesis 3a, hypothesis 3b and hypothesis 4a are accepted. However, hypothesis 3c, hypothesis 4b and hypothesis 4c are rejected. Some of these findings are the same with findings of Öztürk and Demirgüneş (2007), Kızıl (2009), Dönmez and Erol (2016), Thakur (2017) and Nawaz and Haniffa (2017) in the literature.
IV. Conclusion
Intellectual capital‟s importance is becoming more evident for firm performance and continuous competitive advantage as the contribution of intangibles to market capitalization is rising. Tangible assets are not now that much critical for organizations as was in previous years. That is the main reason why tangible asset investments are going down while intangible asset investments are rising.
However, a business world with the eye-catching role of intangibles bring some challenges as well. One of the leading problems is related to reflecting the real value of intangibles such as intellectual capital. Especially, management of intellectual capital becomes impossible without accurate measurement of intellectual capital. Traditional accounting is also inadequate in measuring, accounting and reporting intellectual capital.
Intellectual capital strength is definitely important for the banking industry, since banks must always be innovative and competitive to survive. This study utilized Market Value (MV) / Book Value (BV) method and Value Added Intellectual Coefficient (VAIC) model to measure and compare intellectual capital of Turkish banks listed on Borsa Istanbul Banking Index (BIST XBANK). Plus, financial indicators like Return on Assets (ROA), Return on Equity (ROE), Leverage, (LEV), Capital Adequacy Ratio (CAR) and intellectual capital performance indicators like MV/BV ratio, Human Capital Efficiency (HCE), Structural Capital Efficiency (SCE), Capital Employed Efficiency (CEE) and VAIC of banks were compared. Research also ran a Pearson Correlations Test to investigate the relationship between the mentioned indicators (variables) and to test the hypothesis. Data were gathered from Istanbul Stock Exchange - ISE (Borsa Istanbul), Public Disclosure Platform (KAP), Banks Association of Turkey – TBB (Türkiye Bankalar Birliği), Banking Regulation and Supervision Agency (BRSA), Fortune Turkey, Anadolu Agency and Hurriyet.
This study firstly took advantage of Market Value (MV) / Book Value (BV) method to measure and compare intellectual capital of Turkish banks listed on Borsa Istanbul Banking Index (BIST XBANK). Based on the findings, ICBC Turkey Bank (Çin Endüstri ve Ticaret Bankası) has the highest intellectual capital with a Market Value (MV) / Book Value (BV) ratio of 3,48. On the other hand, Halkbank (Türkiye Halk Bankası) is determined to have the lowest intellectual capital with a MV / BV ratio of 0,54. T. Kankınma Bank (Türkiye Kalkınma Bankası), QNB Finansbank, Garanti Bank, Denizbank, TSKB (Türkiye Sınai Kalkınma Bankası) and Akbank have MV / BV ratios over 1,00 while Is Bank (Türkiye İş Bankası), Vakıfbank, Sekerbank, Yapı Kredi Bank (Yapı ve Kredi Bankası), Albaraka Bank and Halk Bank (Türkiye Halk Bankası) have MV / BV ratios under 1,00.
When the VAIC values of Turkish banks listed on Borsa Istanbul Banking Index (BIST XBANK) are considered, TSKB ranks 1st with the highest score of 9,33. Akbank follows as 2nd with a VAIC of 5,13. T. Kalkınma Bank ranks 3rd with 4,12 , Garanti Banks ranks 4th with 4,09 , Vakıfbank ranks 5th with 3,94 , Halkbank ranks 6th with 3,78 , Denizbank ranks 7th with 3,19 , Finansbank ranks 8th with 2,97 , Is Bank (İş Bankası) ranks 9th with 2,90 , ICBC Turkey Bank ranks
Measuring Intellectual Capital of Turkish Banks Listed on Borsa Istanbul Banking Index (BIST XBANK) with
the Market Value / Book Value Method and Value Added Intellectual Coefficient (VAIC) Model
Page |112| Emerging Markets Journal
10th with 1,96 , Yapı Kredi Bank ranks 11th with 1,84 ,Albaraka Bank ranks 12th with 1,77 and Sekerbank ranks the last (13th) with 1,51.
Considering the financial indicators of Turkish banks listed on Borsa Istanbul Banking Index (BIST XBANK), Akbank has a desired performance in terms of ROA, ROE, LEV and CAR. Albaraka Bank has an unsatisfactory performance in ROA, ROE and LEV, but an average performance in CAR. Denizbank has a moderate performance for ROA and ROE, a low performance for LEV, but a disappointing performance for CAR. Finansbank (QNB) has a low performance for ROA, ROE, LEV and CAR. Garanti Bank has a high performance for ROA, ROE and CAR, and a moderate performance for LEV. Halkbank has a moderate performance for ROA, good performance for ROE, but an unsatisfactory performance for LEV and CAR. ICBC Turkey has an unsatisfactory performance for ROA, ROE and CAR, but a good performance for LEV. Is Bank (İş Bankası) has a good performance for ROA and LEV, and a moderate performance for ROE and CAR. Sekerbank has a low performance for ROA, ROE, LEV and CAR. T. Kalkınma Bank has a low performance for ROA and ROE, but a good performance for LEV and CAR. TSKB has a good performance for ROA, ROE, LEV and CAR. Vakıfbank has a good performance for ROA and ROE, a moderate performance for LEV and a low performance for CAR. Yapı Kredi Bank has a low performance for ROA, ROE, LEV and CAR.
Akbank, Garanti Bank and TSKB are the institutions which show a good performance both in terms of financial indicators and intellectual capital performance indicators. On the opposite side, Albaraka Bank, Sekerbank and Yapı Kredi bank are the institutions which show a low performance both in terms of financial indicators and intellectual capital performance indicators. Remaining banks‟ financial indicators and intellectual capital performance indicators do fluctuate.
Based on Pearson Correlations Test, very strong positive relationships between ROA and ROE as well as HCE and VAIC of Turkish banks listed on Borsa Istanbul Banking Index (BIST XBANK) are observed. In case banks wish to have a high VAIC, they should attain a high HCE. Also, this means that, if the banks can use their human capital effectively, their intellectual capital strength (VAIC) will increase. So, the banks should be careful about recruiting and preserving talented personnel as well as training them continuously.
Furthermore, there is a strong positive link between ROA and HCE. This means, when banks increase their HCE, their ROA increases as well. So, the banks should definitely concentrate on improving their HCE and using their human capital efficiently to boost their ROA. Our findings point out that, increasing HCE leads to increasing the expertise and talent of using assets (actives).
Likewise, there is a strong positive connection between ROA and SCE. When banks‟ SCE climbs, their ROA also climbs. In that case, a core focus on SCE is a must for the banks. According to the findings of our study, if the banks can use their structural capital effectively (SCE), that will positively affect their ROA. This means, So the banks should improve their technical knowhow, information technology (IT), customer and
supplier relationships, bank‟s reputation to higher their SCE.
There is a strong positive correlation between ROA and VAIC as well. That is a very important finding, alerting the banks that if they increase their intellectual capital strength (VAIC), their ROA will also go up. Thus, another critical finding of our research emphasizes that, intellectual capital performance (VAIC) positevely affects financial performance (ROA) and VAIC (intellectual capital power) is a significant predictor of bank financial performance.
Additionally, there is a strong positive relationship between HCE and SCE. This means, there is an inter-relationship between these two variables. When the banks strengthen their HCE, their SCE strengthens as well. Likewise, when the banks strengthen their SCE, their HCE strengthens. However, when the banks‟ HCE weakens, their SCE weakens. A weak SCE is a signal of weak HCE as well.
Similarly, there is a strong correlation between HCE and CEE. Moreover, a strong positive link between SCE and CCE is detected. Finally, there is a strong positive correlation between SCE and VAIC, meaning that a definite emphasis on SCE is a must to enhance VAIC and raise the intellectual capital strength of bank.
In terms of hypothesis testing, hypothesis 1a, hypothesis 1b, hypothesis 1c, hypothesis 2a, hypothesis 2b, hypothesis 2c, hypothesis 3a, hypothesis 3b and hypothesis 4a are accepted. But, hypothesis 3c, hypothesis 4b and hypothesis 4c are rejected.
As a result, some of our study‟s findings are parallel to the findings of Öztürk and Demirgüneş (2007), Kızıl (2009), Dönmez and Erol (2016), Thakur (2017) and Nawaz and Haniffa (2017) in the literature. Upon these findings, we can state that banks with specialized niches are giving more weight to the concept of intellectual capital. Future research can include more periods and run a time series analysis for better results. Also, this study is only focused on the banking sector and banks listed on BIST XBANK. Future research can also concentrate on different sectors, which can enable industry comparisons. Finally, future research can benefit from other intellectual capital measurement methods besides the MV / BV technique and VAIC model.
References
Akgün, A. İ. and Şamiloğlu, F. (2017), “Küresel Finansal Krizin Muhasebe ve Değer Esaslı İşletme Performanslarına Etkisi” (“The Effect of Global Financial Crisis on Accounting and Value-Based Business Performances”), Business and Economics Research Journal, No: 3, pp.453-471.
Anadolu Agency. (2017), “QNB Finansbank‟ın 9 Aylık Net Dönem Karı 1 Milyar 233 Milyon Lira”,
Anadolu Agency Website,
http://aa.com.tr/tr/sirkethaberleri/finans/qnb- finansbankin-9-aylik-net-donem-kari-1-milyar-233-milyon-lira/639319
Mehmet Lütfi Arslan, Cevdet Kızıl
Emerging Markets Journal | P a g e |113
Andreou, A.N., Green, A. and Stankosky, M. (2007), “A framework of intangible valuation areas and antecedents”, Journal of Intellectual Capital, Vol. 8 No. 1, pp.52-75.
Banking Regulation and Supervision Agency (BRSA). (2017), “Istatistik”, Banking Regulation and Supervision Agency (BRSA) Website, https://www.bddk.org.tr/WebSitesi/turkce/Istati stiki_Veriler/Istatistiki_Veriler.aspx
Banks Association of Turkey - TBB (Türkiye Bankalar Birliği). (2017), “Istatistiki Raporlar”, Banks Association of Turkey – TBB (Türkiye
Bankalar Birliği) Website,
https://www.tbb.org.tr/tr/bankacilik/banka-ve-sektor-bilgileri/istatistiki-raporlar/59
Beaver, W.H. (1998), “Financial Reporting: An Accounting Revolution”, Prentice-Hall International, Upper Saddle River, NJ. Bontis, N. (1998), “Intellectual capital: an exploratory
study that develops measures and models”, Management Decision, Vol. 36 No. 2, pp.63-76.
Bontis, N. (2002), World Congress on Intellectual Capital Reading, Butterworth-Heinemann, Boston, MA.
Borsa Istanbul. (2017), “Borsa Istanbul Veriler”, Borsa
Istanbul Website,
http://www.borsaistanbul.com/veriler
Brooking, A. (1997), “Intellectual Capital: Core Asset for the Third Millennium Enterprise”, Thomson Business Press, London.
Cabrita, M.R.M.F, da Silva, M.D.L.R., Rodrigues, A.M.G., and Munoz Duenas, M.D.P. (2017), "Competitiveness and disclosure of intellectual capital: an empirical research in Portuguese banks", Journal of Intellectual Capital, Vol. 18
Issue: 3,
pp.486-505, https://doi.org/10.1108/JIC-11-2016-0112. Choong, K. K. (2008),"Intellectual capital: definitions, categorization and reporting models", Journal of Intellectual Capital, Vol. 9 Iss: 4 pp.609-638.
Curado, C., Guedes, M. J., Bontis, N. (2014), “The Financial Crisis of Banks (Before, During and After): An Intellectual Capital Perspective”, Knowledge and Process Management, Vol. 21, Issue: 2, pp.103-111.
Daum, J.H. (2002), “Intangible Assets and Value Creation”, Wiley, Chichester.
Davenport, T.H. and Prusak, L. (1997), “Working Knowledge: How Organizations Manage What They Know”, Harvard Business School Press, Boston, MA.
Diefenbach, T. (2006), “Intangible resources: a categorical system of knowledge and other intangible assets”, Journal of Intellectual Capital, Vol. 7 No. 3, pp.406-420.
Dönmez, A. and Erol, İ. (2016), “Entelektüel Sermayenin Ölçülmesi: VAIC Yöntemi Yardımıyla BIST-Sürdürülebilirlik Endeksi İşletmeleri Üzerine Bir Uygulama”, Mali Çözüm Dergisi, pp.27-56.
Dumay, J. (2013), “The third stage of IC: towards a new IC future and beyond”, Journal of Intellectual Capital , Vol. 14, No. 1, pp.5-9.
Edvinsson, L. and Malone, M.S. (1997), “Intellectual Capital: Realizing your Company‟s True Value by Finding its Hidden Brainpower”, Harper Business, New York, NY.
Feltham, G.A. and Ohlson, J.A. (1996), “Uncertainty resolution and the theory of depreciation measurement”, Journal of Accounting Research, Vol. 34 No. 2, pp.209-234.
Fortune Turkey. (2017), “Borsadaki Bankaların 9 Aylık Karı Yüzde 27 Arttı”, Fortune Turkey Website, http://www.fortuneturkey.com/borsadaki-bankalarin-9-aylik-kari-yuzde-27-artti-49402 Garcia-Meca, E. (2006), “Bridging the gap between
disclosure and use of intellectual capital information”, Journal of Intellectual Capital, Vol. 6 No. 3, pp.427-40.
Guthrie, J. and Petty, R. (2000), "Intellectual capital: Australian annual reporting practices", Journal of Intellectual Capital, Vol. 1 Issue: 3, pp.241-251, https://doi.org/10.1108/146919300103508 00.
Guthrie, J., Ricceri, F. and Dumay, J. (2012), “Reflections and projections: a decade of intellectual capital accounting research”, The British Accounting Review, Vol. 44, No. 2, pp. 68-82.
Hall, R. (1992), “The strategic analysis of intangible resources”, Strategic Management Journal,Vol. 13 No. 2, pp.135-144.
Holthausen, R.W. and Watts, R.L. (2001), “The relevance of the value relevance literature for financial accounting standard setting”, Journal of Accounting and Economics, Vol. 31, pp. 3-75.
Measuring Intellectual Capital of Turkish Banks Listed on Borsa Istanbul Banking Index (BIST XBANK) with
the Market Value / Book Value Method and Value Added Intellectual Coefficient (VAIC) Model
Page |114| Emerging Markets Journal
Hurriyet. (2017), “2017 Yılı 9 Aylık Bilançolar”,Hurriyet Website,
http://www.hurriyet.com.tr/2017-yili-9-aylik-bilancolar-40641412
Ikenna, E., Ursula, E. N. (2017), “Intellectual Capital and Corporate Performance in Nigeria Banks”, American Journal of Finance, Vol. 1, No: 5, pp.63-78.
Itami, H. (1991), “Mobilizing Invisible Assets”, Harvard University Press, Cambridge, MA.
Johansson, U., Martensson, M. and Skoong, M. (2001), “Measuring to understand intangible performance drivers”, The European Accounting Review, Vol. 10 No. 3, pp.407-437.
Kalaycı, Ş. (2009), SPSS Uygulamalı Çok Değişkenli İstatistik Teknikleri” 4th Edition, Ankara: Asil Yayın Dağıtım.
Kaplan, R.S. and Norton, D.P. (1992), “The Balanced Scorecard. Measures that drive performance”, Harvard Business Review , Vol. 70 No. 1, pp.71-79.
Karacan, S and Ergin, E. (2011), “Bankaların Entelektüel Sermayesi ile Finansal Performansı Arasındaki İlişki”, (Intellectual Capital and Financial Performance in the Banking Sector), Business