THE EFFECTS OF CALIFORNIA’S CONCEALED CARRY WEAPONS LAWS ON CERTAIN
VIOLENT CRIME RATES
A Thesis Presented to the Faculty of
California State University, Stanislaus
In Partial Fulfillment
of the Requirements for the Degree of Master of Arts in Criminal Justice
By John S. Vieira
CERTIFICATION OF APPROVAL
THE EFFECTS OF CALIFORNIA’S CONCEALED CARRY WEAPONS LAWS ON CERTAIN
VIOLENT CRIME RATES
by John S. Vieira
Dr. Peter Nelligan, Ph.D. Professor of Criminal Justice
Dr. Chau-Pu Chiang, Ph.D. Professor of Criminal Justice
Dr. Gregory Morris, Ph.D.
Associate Professor of Criminal Justice
Date
Date
Date Signed Certification of Approval Page is
© 2013 John S. Vieira ALL RIGHTS RESERVED
iv DEDICATION
I dedicate this work and give thanks to my loving and patient wife, April, and my two loving daughters, Khrysten and Aubrey, for the sacrifices they have made so that I could pursue such a demanding endeavor. Without their loving support,
v
ACKNOWLEDGEMENTS
I would like to thank the faculty and staff of California State University, Stanislaus’ Criminal Justice Department, as well as the Graduate School, for without their guidance, assistance, and encouragement, I would not have reached this goal. I would also like to give special thanks to my committee members Dr. Chau-Pu Chiang and Dr. Gregory Morris for their instruction and assistance in this project and
especially my chair, Dr. Peter Nelligan for his continued guidance and assistance even into his retirement.
vi
TABLE OF CONTENTS
PAGE
Dedication ... iv
Acknowledgements ... v
List of Tables ... viii
Abstract ... ix
CHAPTER I. Introduction to the Study ... 1
Background ... 2
Historical Considerations ... 7
Statement of the Problem ... 12
Purpose of the Study ... 14
II. Review of the Literature ... 15
Theoretical Foundations... 16 Empirical Studies ... 19 III. Methodology ... 29 Definition of Terms... 30 Population ... 31 Treatment ... 32
Data Analysis Procedures ... 35
IV. Results ... 37
Characteristics of the Population ... 38
Aggravated Assault ... 41
Robbery ... 44
Forcible Rape ... 47
Willful Homicide ... 51
V. Discussion and Recommendations ... 56
Policy Implications ... 60
vii
Conclusion ... 62 References ... 65 Appendix
viii
LIST OF TABLES
TABLE PAGE
1. Characteristics of the Population ... 40
2. Means Differences for Aggravated Assault ... 41
3. Means, Standard Deviations, and Intercorrelation for Aggravated Assault ... 42
4. Regression Analysis Summary Predicting Aggravated Assault ... 43
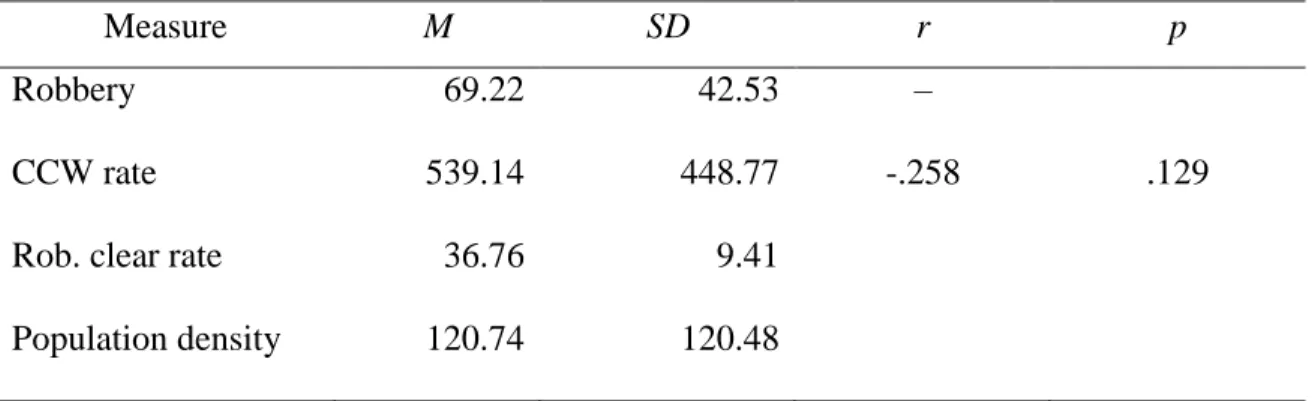
5. Means Differences for Robbery ... 45
6. Means, Standard Deviations, and Intercorrelation for Robbery ... 46
7. Regression Analysis Summary Predicting Robbery ... 47
8. Means Differences for Forcible Rape ... 48
9. Means, Standard Deviations, and Intercorrelation for Forcible Rape ... 49
10.Regression Analysis Summary Predicting Forcible Rape ... 50
11.Means Differences for Willful Homicide ... 52
12.Means, Standard Deviations, and Intercorrelation for Willful Homicide ... 53
ix ABSTRACT
This study investigated the question of whether the legal carrying of concealed handguns by licensed citizens reduces violent crime. Rational choice theory provided the context for the study’s basic premise that a prevalence of concealed carry
licensees should work to reduce violent crime by presenting a risk (e.g., offender apprehension, injury, or death) greater than the perceived benefit of carrying out a crime (e.g., monetary gain). Essentially, the research question asks whether the “armed guardian” is an effective answer to violent crime. California’s 58 counties were compared across rates of concealed carry permits and aggravated assaults, robbery, forcible rape, and willful homicide rates while controlling for the effects of population density and crime clearance rates. Twelve analyses were performed which examined the associations and relationships between concealed carry permit rates and four types of violent crime. Of the 12 analyses performed, eight analyses tended to show support for the underlying hypotheses that counties with higher rates of concealed carry permits experienced lower rates of aggravated assault, robbery, and willful homicide. Conversely, three analyses indicated a positive relationship between forcible rape and concealed weapons permit rates. The study found that increased rates of concealed carry permits predicted (a) reductions in aggravated assault rates, (b) reductions in robbery rates, (c) increases is rape rates, and (d) virtually no causal relationship to willful homicide rates.
1 CHAPTER I
INTRODUCTION TO THE STUDY
California’s current economic plight afflicting not only private citizens, but also local and state law enforcement agencies as well as correctional agencies (i.e., county probation departments, state parole, jails, and prisons) has sparked a fresh debate on an old topic of guns and crime. Severe budget constraints have caused police agencies to reduce the number of officers and police services available to citizens, a reduction in prison population, and a reduction in probation and parole supervision of convicted felons. The situation became dire to the extent that at least two Sheriffs in California sent out a call to arms, advising citizens to arm themselves in order to protect themselves from criminals because law enforcement can no longer afford to provide the level of services and protection that it once did.
In May 2010, Sacramento County Sheriff John McGinness announced that he was open to the consideration of increased issuance of licenses for the carry of concealed weapons (CCW) to qualifying private citizens. Sheriff McGinnis made his announcement amidst severe budget cuts mandated by the Sacramento County Board of Supervisors that threatened lay-offs of a large number of deputy sheriffs and support staff positions. Sheriff McGinnis explained that law enforcement’s response-times to calls for service would increase significantly as a result of shortages of personnel available to respond to calls for service, thus leaving citizens to fend for
2 themselves until such time that law enforcement personnel could respond (KCRA News, 2010).
In April 2010, Stanislaus County Sheriff Adam Christianson expressed similar sentiments during a meeting of the Modesto chapter of the Madison Society (a pro-Second Amendment organization). Sheriff Christianson pledged to issue permits to carry concealed weapons to those applicants “… who meet the state mandated criteria…” for concealed carry weapons permits. Sheriff Christianson stated “I’m not going to infringe upon your right to protect yourselves” (Stapley, 2010). According to Sheriff Christianson, the loosening in policy is necessary, as budgetary constraints have resulted in a reduction in workforce thereby limiting the number of personnel available to respond to citizen calls for service and to patrol proactively the
communities the department serves.
Background
Today, 49 states, including California, have adopted laws authorizing citizens to carry concealed weapons in public. Of these 49 states, 35 states have enacted “shall-issue” laws (also known as nondiscretionary laws). Four states; Alaska, Arizona, Vermont, and Wyoming have adopted unrestrictive concealed carry laws, which allow citizens to carry concealed firearms in public places without requiring licenses or permits, as long as those that do so are not statutorily prohibited from doing so (i.e., law-abiding adult citizens). Meanwhile, ten states, including California, have implemented “may-issue” laws (also known as discretionary laws). Only two jurisdictions, Illinois State and Washington D.C., completely prohibit all private
3 citizens from carrying concealed weapons in public places within their jurisdictions (NRA-ILA Fact Sheet, 2012).
However, it should be noted that there is some disagreement in the literature about which states are shall-issue states. As an example, the language contained in Connecticut’s concealed carry laws refer to the term may-issue. However,
Connecticut does not require applicants to demonstrate a need for a license to carry a concealed handgun (as is commonly the case in may-issue states), restricts local discretionary powers in denying licenses, and has an established appeals process to ensure consistency in the issuance of licenses throughout the state. Meanwhile, Pennsylvania’s shall-issue laws grant Philadelphia’s chief of police discretionary authority to deny licenses within its jurisdiction (Grossman & Lee, 2008).
The difference between shall-issue laws and may-issue laws is that in states that implement shall-issue laws, every citizen who meets the applicant criteria shall receive a permit to carry a concealed handgun. In situations where applications are denied, the burden of proof falls on the issuing authority (judge, sheriff, or police chief) to demonstrate that an applicant is unqualified or unfit to receive a license to carry a concealed weapon in public. Conversely, in those states having may-issue laws, the decision whether to issue concealed carry permits to qualified applicants is at the discretion of the issuing authority, which may or may not issue the license to carry a concealed weapon (Grossman & Lee, 2008). Concealed carry permits are usually granted only to those applicants who can demonstrate a compelling need for the permit, such as business owners who make large bank deposits or individuals who
4 have received credible threats of bodily harm substantiated in official records such as police reports or court records. However, under such laws, an otherwise qualified applicant may be denied a permit with no cause, justification, or reason given for the denial of the permit (Cramer & Kopel, 1995).
Critics of discretionary permitting laws charge that such laws promote abuses of the discretionary power in that issuing authorities may substitute their own
subjective criteria in determining who is qualified to receive a permit to carry
concealed weapons. An otherwise qualified applicant’s request for a concealed carry permit can be denied simply because the issuing authority chooses to deny the application. Critics also point out that sheriffs, judges, and chiefs of police may use permits as a method of rewarding political supporters. Critics declare that
nondiscretionary laws make the process of obtaining concealed carry permits objective and fair. Those applicants, who meet the criteria, shall receive permits independent of and free from the permitting authorities’ opinions or personal beliefs about the individual applicant or the issue of concealed carry weapons laws in general (Cramer & Kopel, 1995).
Regardless of the type of concealed carry laws in place, many jurisdictions share similar applicant requirements. Common to most jurisdictions are the
requirements that applicants be of adult age, be residents of the state in which they apply for CCW permits, must demonstrate that they are free from significant criminal backgrounds, and must be free from mental illness (Cramer & Kopel, 1995). In addition to these criteria, California applicants must also articulate a compelling need
5 for a concealed carry permit, must complete a firearms training course, and may be required to complete a psychological examination as proof of mental competency (California Department of Justice, 2002).
Although CCW permits allow private citizens to carry concealed firearms in many public places, the privilege to do so is not all-inclusive in that specific
restrictions and limitations apply. Licenses to carry concealed weapons pertain only to handguns, other firearms including shotguns and rifles do not qualify for such permits because they are not concealable on the person, nor do other weapons such as knives, shurikens (throwing stars), dirks, brass knuckles and the like qualify for inclusion on concealed carry licenses. According to California’s application for license to carry a concealed weapon (California Department of Justice, 2002), license holders are prohibited from carrying concealed firearms while consuming alcoholic beverages; while in bars, beer gardens, or similar venues whose primary purpose is the sales of alcoholic beverages for on-site consumption; or when under the influence of any medication or drug, prescribed or not. In addition, licensees shall not carry concealed firearms in places prohibited by local ordinance, state law, or federal law including public schools, court buildings, and federal government buildings (Vernick & Hepburn, 2003). It is also worth noting that concealed carry permit holders are required to show the license to and/or surrender the concealed weapon to any peace officer upon the officer’s demand. Concealed carry permit holders may carry
concealed only those firearms that are identified by description and serial number on the CCW permit and may only display the concealed firearm when legal justification
6 to do so exists (California Department of Justice, 2002). Contrary to what may be popular belief, CCW permits impose limitations on the locations and circumstances in which permit holders may legally carry concealed firearms.
Cramer and Kopel (1995) have estimated that, at any given time,
approximately one to four percent of a state’s population possesses licenses to carry concealed weapons. In 2007, an estimated 5 million Americans were in possession of licenses to carry concealed weapons (Lott, 2010). Later, in 2010, approximately 29,000 Californians possessed licenses to carry concealed weapons. However, the numbers of CCW permits are not distributed evenly among each of California’s 58 counties. In 2010, San Francisco City/County was home to only one CCW license holder. Compared to the 3,457 CCW licenses issued in Kern County during the same year and the difference becomes remarkable (California Department of Justice, 2010).
The issue of concealed carry weapons laws is complicated and has far-reaching implications for matters pertaining to individual freedom, self-defense, public health, and public policy. Although most jurisdictions in the United States afford citizens the right to carry concealed weapons, the right is not absolute; every jurisdiction that does so has imposed limitations on who may carry concealed weapons, under what circumstances, and in what locations. While researchers
continue to examine the roles that firearms and concealed carry weapons laws play on crime and violence, to date, there is little consensus among the competing schools of thought on the matter (Zimring, 2003).
7 California was a suitable study site for the examination of the relationships between may-issue concealed carry weapons laws and certain violent crime in that, in 2010, there were 29,631 concealed carry permits issued in the state with large
variances in concealed carry permit rates and crime rates between the state’s 58 counties. These variations in rates facilitated an investigation of the effects, if any, of concealed carry permits. A cross-section research design with multivariate regression analysis was used to examine the relationship between concealed carry permits and particular crime rates. A variety of publically available sources were used to acquire relevant data including the Federal Bureau of Investigations’ (2011) Uniform Crime Report, United States Census Bureau (2012), the California Department of Justice’s (2008) concealed carry permit statistics report, and the RAND California databases.
Historical Considerations
Laws prohibiting the carrying of concealed firearms without licenses are a relatively recent development in American history. Few states prior to the Civil War era had enacted statutes addressing the concealed carrying of handguns. The few states (mostly southern states) with concealed handgun laws banned the practice of concealed carry entirely rather than having established policies that could have allowed for concealed carry if individuals were legally licensed or permitted to do so. In fact, these laws even prevented police officers, whether on- or off-duty, from carrying concealed handguns (Cramer & Kopel, 1995).
The carrying of firearms, concealed or not, can be traced to colonial America during the early 1600s with the formation of militias for the defense of the colonies
8 against attacks from Indians and European enemies. Militia laws required that every freeman own guns for militia duty. In some instances, female heads of household were also obligated to own guns for their militia-age sons or servants. Adults were required to carry firearms while traveling, attending public meetings, and church because of the constant fear of Indian attacks. Although such laws varied between colonies and from year-to-year, these laws granted exemptions for members of the clergy, magistrates, and Quakers who opposed the carrying of firearms for religious reasons (Cramer, 2006).
In 1757, Pennsylvania passed a militia statute that required all men aged 17 years to 55 years enroll in the militia. Again, exemptions were granted for clergy, Catholics, magistrates, and conscientious objectors. Similar to other Colonial militia statutes of the time, militia members were required to be armed with one musket, or fuseee (a smaller version of the musket), gunpowder, and lead (ammunition), all in good working order. However, not everyone who was required to participate in the militia could afford a musket and ammunition. Connecticut’s 1650 militia laws and Rhode Island’s 1757 militia laws, among others, allowed colonists to barter their crops in exchange for government provided guns, ammunition, and related supplies. Meanwhile, other colonies such as Plymouth and Virginia passed laws that required the government to provide public firearms and supplies to those militia members who could not afford to purchase their own. Militia laws also allowed for the imposition of fines upon those who failed to obtain firearms and ammunition. Militia officers were required to ensure that militia members complied with militia laws by routinely
9 inspecting militia members’ weapons and checking to see that they had enough gunpowder and ammunition on hand. Members who were out of compliance with the law could be fined up to a month’s wages (Cramer, 2006).
Militia laws, and their related gun laws, remained relatively unchanged throughout America’s colonial period and were in large part responsible for
America’s victory in the Revolutionary War (1775–1783). However, by the time of the American Civil War (1861–1865), the militia system had significantly declined, but gun ownership remained common. In the southern slave states, a few militias remained, but instead of defending against Indian attacks, they conducted slave patrols in which they enforced discipline upon slaves and hunted down fugitive slaves (Cramer, 2006).
The earliest of laws regulating the carrying of concealed firearms originated in America’s south in slave states during the early 1800s. It was during this period that Kentucky (1813), Tennessee (1838), Georgia (1837), Alabama (1839), Arkansas (1838), Louisiana (1813), and Virginia (1838) adopted concealed carry laws. Previously, these states either prohibited the carrying of concealed firearms or arbitrarily issued concealed carry licenses (Cramer, 1999).
There is some evidence to suggest that these concealed handgun laws were passed as mechanisms for prohibiting blacks from carrying arms because those who lived in southern states feared slave rebellions and slave uprisings (Cramer, 1999). According to Florida Supreme Court Justice J.Buford in 1941,who commented on the origins of concealed carry laws:
10 The statute was never intended to be applied to the white population and in practice has never been so applied. [The] act was passed for the purpose of disarming the negro laborers… and to give the white citizens in sparsely settled areas a better feeling of security. (as cited in Cramer & Kopel, 1995, p. 681)
However, Cramer (1999) offered an alternate explanation for the prevalence of concealed carry laws in the south during the first half of the 1800s. Dueling was particularly prevalent in the south. It provided a means as an honorable resolution to disputes involving insults, slander, and libel. Reformers attempted to ban dueling by the passage of laws which made dueling a felony. However, jurors regarded dueling as honorable and appropriate. They refused to convict anybody charged with dueling thereby making the laws uninforceable. In response, reformers introduced laws which banned the carrying of concealed weapons in hopes that dueling could be controlled. Instead, the laws proved to be ineffective deterrents as dueling and carrying of concealed weapons continued. By the end of the Civil War (1865), dueling had diminshed in popularity and importance allowing for the laws which prohibited the concealed carry of deadly weapons to have been replaced with a system of laws that granted concealed carry licenses (Cramer, 1999).
It was not until the 1920s and 1930s that many states began to enact concealed carry laws. Enactment began because of adoption of model laws—known collectively as The Uniform Act to Regulate the Sale and Possession of Firearms—by the
National Conference of Commissioners on Uniform State Laws. Among those laws contained in the Uniform Act, was a prohibition against the unlicensed carrying of concealed handguns. Provisions adopted under the model law granted judges, police
11 chiefs, and county sheriffs the authority to issue concealed carry licenses to qualified applicants. Although the Uniform Act to Regulate the Sale and Possession of
Firearms outlined specific applicant minimum qualification requirements, decisions to approve permits were discretionary powers vested with the permitting authority (California Assembly Office of Research, 1986). Although California adopted the Uniform Act in 1923, not all states adopted the Uniform Act. For example, Vermont was one state that chose not to adopt the law. Instead, Vermont had, and still has, no laws prohibiting the carrying of concealed handguns as long as carriers have no intention of unjustly harming another person (Cramer & Kopel, 1995).
Most states maintained their may-issue laws until the 1960s at which time a national trend towards shall-issue laws emerged. New Hampshire appears to have been the first state to adopt shall-issue laws, having done so in 1959, followed by Washington (1961) and Connecticut (1969). In the 1990s, 26 additional states adopted shall-issue laws and by 2003, an additional five states became shall-issue states (Grossman & Lee, 2008). Today, there are 49 states with some form of
concealed carry laws in place. Illinois State and Washington D.C. remain as the only jurisdictions that continue to prohibit the carrying of concealed weapons (NRA-ILA Fact Sheet, 2012).
The rising crime rates and social turmoil experienced during the 1960s social revolution appears to have provided the impetus for the trending towards the
liberalization and spread of concealed carry laws (Grossman & Lee, 2008). Lott (2010) noted that the passage of concealed carry laws tended to follow periods of
12 rising crime rates. The 1960s and 1980s experienced similar phenomenon
characterized by periods of high crime followed by adoptions of concealed carry laws with 26 states having adopted shall-issue laws in the 1990s, presumably in the hopes that law-abiding citizens protect themselves (Grossman & Lee, 2008). The trending towards relaxation of concealed carry laws has remained constant throughout America’s history. In fact, no state that has adopted shall-issue concealed carry laws has opposed the trend by returning to the more restrictive system of may-issue laws or abolished concealed carry altogether (Lott, 2010).
Statement of the Problem
The effects of concealed carry laws on society in general and on violent crime rates in particular have been hotly debated topics because of the significant
implications the issues pose to public safety, civil freedoms, and matters of public policy. Supporters on either side of the concealed carry debate have made claims that directly contradict one another. Opponents of concealed carry weapons laws
denounce the concealed carrying of firearms by private citizens as akin to modern day vigilantism and caution that guns carried by private citizens only serve to aggravate and perpetuate the frequency and severity of violent crime because CCW laws increase the number of persons with easy access to firearms (Zimring, 1968). Opponents express trepidation that minor verbal confrontations or opportunistic criminal acts may escalate into spontaneous shootings. In addition, a greater
prevalence of gun carrying may result in more opportunities for theft of guns causing a transfer of legally owned guns into the hands of criminals. Opponents have also
13 predicted increased accidental shootings and gun-related suicides (Donohue, 2003, p. 287).
Conversely, some supporters of concealed carry weapons laws have argued that such laws enable weaker individuals to defend themselves against stronger attackers, are necessary for self-protection, and ultimately lead to reductions in violent crime rates with no statistically significant increases in accidental shooting rates, suicide rates, or murder rates (Lott, 2010; Kleck, 2005). CCW licensing policies might reduce crime by deterring criminal offenders because criminals generally wish to avoid victims who may be armed (Wright & Rossi, 1994). The rationale in favor of concealed carry laws includes the notion that our legal system is incapable of
providing the level of protection from violence that individuals desire and note that law enforcement cannot adequately protect everybody all the time (Lott, 2010). As Kleck (2005) observed, people own guns not only in response to perceived high or rising crime rates, but also in response to the belief that the criminal justice system cannot adequately protect them from crime.
Whether concealed carry weapons laws affect violent crime rates, and if so, how and to what extent, are difficult and complex questions to answer (Ludwig, 1998). Prominent researchers in the areas of economics, criminology, and sociology, public health, among other disciplines, have made contradictory findings.
Conclusions run the full breadth of possible outcomes from significant increases in crime rates, to no significant effects on crime rates, to significant decreases in crime rates attributed to concealed carry weapons laws.
14
Purpose of the Study
The purpose of this study was to examine the relationships, if any, between California’s concealed carry weapons laws and the rates of aggravated assaults, forcible rapes, robberies, and willful homicides. This study tested the following hypotheses; (a) counties with higher rates of concealed carry weapons permits have lower rates of aggravated assaults, (b) counties with higher rates of permits to carry concealed handguns have lower rates of forcible rapes, (c) counties with higher rates of permits to carry concealed handguns have lower rates of robberies, and (d)
counties with higher rates of permits to carry concealed handguns have lower rates of willful homicides.
15 CHAPTER II
REVIEW OF THE LITERATURE
The notion that an increased number of people carrying concealed handguns can reduce crime is based on rational choice theory. In essence, this theory holds that offenders are rational beings capable of considering the costs and benefits of their criminal behavior. If the offender believes the cost of committing a criminal act (e.g., being shot or injured by an armed victim) outweighs the benefit (e.g., material gain), the offender will likely choose not to commit the offense. An increased number of people carrying concealed handguns increases the probability that offenders will
encounter armed victims and may consequently dissuade offenders from offending. Cesare Beccaria (1764/2012) introduced the concept of the rational and
calculating offender in the 18th century. Beccaria proposed a simple model of human choice based on rational calculations of the costs and benefits of crime. If the costs of committing a crime outweighed the benefits, the offender would choose against committing the crime. To that end, Beccaria advocated that punishments be imposed swiftly, with certainty, and in proportion to the crimes committed so that the cost of committing crime exceeds any benefit. This approach became the basis for all modern criminal justice systems (Bernard, Snipes, & Gerould, 2010). The costs of committing crime may not only come in the form of punishments imposed by governments, but also include feelings of shame, embarrassment, or condemnation by offenders’ peers or from the public (Cornish & Clarke, 1986).
16
Theoretical Foundations
Rational choice theory, a derivative of Beccaria’s human choice model, supposes that offenders rationally and logically calculate the potential costs/risks and benefits of committing crime. Although, rational choice theory does not explain motivations for committing crime, it assumes that crimes will occur where and when opportunities exist. People who would not normally commit crime may take
advantage of opportunistic situations. Potential offenders consider the accessibility to targets, the likelihood of being observed or caught, and the expected benefit of
committing the offense. The cardinal rule of rational choice theory is to never dismiss criminal behavior as random or meaningless, but instead attempt to understand an offender’s objective (Bernard et al., 2010). However, an offender’s ability to perform a cost-benefit analysis is not perfect as it may be limited by time, ability, and the availability of relevant information. Similar to other theories of crime, rational choice theory attempts to provide a context for understanding all types of crime and can therefore be broadly applied (Cohen & Felson, 1979).
Cornish and Clarke (1986) explained the decision-making process as occurring in two stages. The criminal involvement stage occurs when an offender decides to become initially involved in, continues with, or discontinues specific types of crime. For example, an offender may decide that residential burglaries offer the offender the most benefit while exposing the offender to the least risk. An offender’s decision may be influenced by different background factors related to other theories of crime (e.g., differential association, ecological theories, or strain theories).
17 “Offenders may be making choices from a limited range of possibilities dictated by their position in the socioeconomic structure” (p. 13). Involvement decisions occur over extended periods and may draw upon a wide range of information, not always directly related to a specific crime. The events decision stage is typically a shorter and simpler process using more immediate information upon which the decision whether to commit a crime is made. In the example of the burglar, one first chooses a suitable target residence, based on an offender’s familiarity with neighborhood, ease of access, and frequency of police patrols, among other factors. If it appears that no one is home, and there are no witnesses, an offender will likely decide to commit the burglary. However, if the offender observes curious neighbors, a burglar alarm, or dogs the offender may choose not to burglarize the residence. Event decisions are influenced by a narrower range of variables related to the immediate risks,
opportunity, and degree of effort needed to commit successfully the chosen offense. This two-stage model offers a context for identifying and understanding the
immediate and long-term decision-making factors.
Deterrence theory, also derived from Beccaria’s classical theory, is closely related to rational choice theory. Essentially, deterrence theory holds that if the costs of committing crime outweigh its benefits, then offenders will be deterred from committing crime. Deterrence occurs in two forms, specific and general. Specific deterrence occurs when an offender’s punishment (or other costs of crime) dissuades the offender from committing future criminal acts. Meanwhile, general deterrence
18 occurs when the fear of punishment (or other costs of crime) dissuades potential offenders from committing crime (Bernard et al., 2010).
Rational choice theory supports the notion that concealed carry laws can specifically deter and generally deter offenders from victimizing potential victims in that an armed victim may be able to use a firearm to defend against or deter an offender’s attack. Meanwhile, potential offenders may be generally deterred from committing interpersonal crime out of fear of encountering, by chance, an armed victim. In either case, the cost of confronting an armed victim may be the
apprehension of, injury to, or death of the offender and therefore outweighs any perceived benefit of committing the crime (Lott, 2010). Classical theory holds that victim selection is based on the ease with which one can be victimized. Offenders are more likely to choose weaker victims and victims who are unlikely to offer resistance over potential victims who are perceived to be stronger or more difficult victims (Gottfredson & Hirschi, 1990) as is likely the case with concealed carry permit holders.
According to Cornish and Clarke (2006), crimes are broadly the result of rational choices based on analyses of anticipated costs and benefits. Offenders then choose whether to engage in crime in an effort to maximize their benefits while minimizing their costs. It makes sense then that concealed carry laws should serve to increase the risk of committing certain crimes and therefore outweigh the benefits of certain crimes. If the logic holds true, than those areas with the largest proportion of concealed carry permit holders, should experience fewer violent crimes. However, it
19 is possible that offenders will respond to the increased risk of encountering armed victims by arming themselves (Wright & Rossi, 1994).
The crime rates of willful homicide (murder and nonnegligent homicide), robbery, forcible rape, and aggravated assaults will be examined as the dependant variables. These crimes are chosen as indicators of the effectiveness of licenses to carry concealed weapons may have on certain violent crime rates. These crimes lend themselves to rational choice theory in that each offense requires decision-making on an offender’s part. Each crime requires that a conscious and deliberate decision be made by a potential offender as to whether the potential offender will commit the criminal act based upon a potential offender’s cost-benefit analyses of the situation. In addition, each of the crimes chosen requires direct interaction between offenders and potential victims. As Cohen and Felson (1979) explained, these crimes require the convergence in time and space of motivated offenders, suitable targets (i.e., potential victims), and an absence of capable guardians. If any one of these three elements is missing, then the crime is unlikely to occur. The crime of burglary was not included in this study because it falls outside the scope of concealed carry laws in that California law does not require citizens to obtain concealed carry permits to lawfully possess and carry firearms in their homes, businesses, or on other privately owned property.
Empirical Studies
Efforts to examine the relationship between concealed carry weapons laws and crime and violence are relatively recent. Kleck and Patterson (1993) conducted
20 the first examination of the relationship between concealed carry weapons laws and violence rates, while also examining a broader range of topics including the effects of various types of gun controls and gun prevalence on violent crime rates. In their study, cross-sectional data were collected from 170 U.S. cities having populations of over 100,000 in 1980. They evaluated the effects of 19 different types of city- and state-level gun controls, including CCW laws passed before 1986, on rates of intentional violent crimes involving firearms consisting of homicide, suicide, fatal gun accidents, robbery, aggravated assaults, and forcible rape. Among their findings, the researchers concluded that cities in states having concealed carry laws were no more violent or less violent than cities without carry concealed weapons laws. In addition, the authors found no evidence of increased rates of gun prevalence in cities in states having concealed carry weapons laws as compared to those that had not adopted such laws (Kleck & Patterson, 1993).
Also in 1993, Kleck and Gertz (1995) conducted a telephone survey of approximately 5,000 American adults for the specific purpose of examining the issue of defensive gun use (DGU). It was the first survey of its kind and scope entirely devoted to the subject of armed self-defense. Their research concluded that each year in the United States there were approximately 2.2 million to 2.5 million defensive gun uses by civilians against criminals. Of those, approximately 1.5 million to 1.9 million incidents involved the use of handguns. They estimated that approximately 27% of DGUs occurred away from the victim’s home. On average, the number of DGUs was 1.5 per household (Kleck & Gertz, 1995).
21 The actual number of times firearms are legitimately used against criminals is unclear and is often a point of contention among researchers. Cook, Ludwig, and Hemenway (1997) derived estimates from the National Crime Victimization Survey (NCVS) that suggested firearms were used to defend against criminals in
approximately 100,000 instances per year. This figure is significantly less than estimates made by other researchers (Cook & Ludwig, 2003). One possible
explanation for the discrepancy among estimates can be attributed to the problem of “false-positives,” a common problem in survey estimates of rare incidents such as defensive gun uses, in which survey respondents may falsely claim to have used guns in self-defense situations (Cook et al., 1997).
In a 1995 study sponsored by a grant from the US Public Health Service, Centers for Disease Control and Prevention used an interrupted time-series research design to examine monthly mortality data before and after CCW policies
(specifically, shall-issue laws) were adopted. The study examined data from a period of 1973 to 1992 from five large urban counties in three states; Mississippi, Oregon, and Florida. Researchers discovered that firearms related homicides increased after the adoption of CCW laws across all five areas of study while non-firearm related homicides remained steady. The findings caused researchers to draw two conclusions; (a) CCW laws do not reduce homicides and (b) to a lesser degree, CCW laws raised levels of murders committed with firearms (McDowall, Loftin, & Wiersema, 1995).
The most publicized and perhaps most controversial study of concealed weapons laws (Kovandzic, Marvel, & Vieraitis, 2005) was a study conducted by Lott
22 and Mustard (1997) who used a cross-sectional time-series data for all 3,054 U.S. counties from 1977 to 1992. The researchers control variables included, but were not limited to, age, economic trends, and arrest rates. Concealed carry laws were
examined using before–after dummy variables with a 1 having been assigned to the year after a CCW law was enacted and a 0 having been assigned to all other years. The researchers concluded that allowing citizens to carry concealed weapons deterred violent crimes, including homicides by 4% to 7%, without increases in accidental deaths. However, they also found that criminals substituted property crimes, where confrontations with victims were less likely, at increased rates. Other findings
included that higher arrest rates and conviction rates had the effect of reducing crime. Lott and Mustard estimated that in those states without concealed carry laws,
approximately 1,500 murders could have been avoided annually, rapes would have declined by over 4,000, robbery by over 11,000, and aggravated assaults by over 60,000 had those states adopted concealed carry laws. The researchers went farther in estimating an annual savings of $5.74 billion in costs associated with crime in 1992 for those states that adopted concealed carry laws, representing an average annual social benefit of as much as $5,000 per concealed weapons license (Lott & Mustard, 1997).
Black and Nagin (1998) conducted a reanalysis of Lott and Mustard’s (1997) study of CCW laws on violent crimes. The researchers relaxed the assumption that the effects of concealed weapons laws on violent crimes were experienced uniformly throughout Lott and Mustard’s sample population. Black and Nagin observed that the
23 estimated effects of concealed carry laws “…were highly sensitive to small changes in the sample and model” (p. 218). The authors found that when murder and rape data for Florida are excluded “…there is no detectable impact for these two crimes” (p. 219). Black and Nagin concluded that concealed carry laws yielded no evidence to support the claim that they reduced violent crime. The authors cautioned against the use of the Lott and Mustard study to support changes in public policy.
In another re-examination of Lott and Mustard’s (1997) study, Ludwig (1998) intended to control for unobserved factors that may have varied over time in Lott and Mustard’s study that may have contributed to their findings and conclusions. Such unobserved factors included variables that are not fixed over time such as changing illegal drug markets, gang activity, and poverty levels that may have influenced concealed carry states differently than in non-concealed carry states. To control for these factors, Ludwig used juveniles as the comparison group to the treatment group which consisted of adults, reasoning that because juveniles are statutorily prohibited from obtaining concealed carry permits “…any deterrent benefits from these laws should be concentrated among adults and, therefore, should be reflected in the gap between adult and juvenile victimization rates” (p. 239). Ludwig accounted for the possibility that nationwide factors affected changes in adult and juvenile homicide rates differently by comparing differences in adult–juvenile homicide rates in concealed carry states with the differences in adult–juvenile homicide rates in non- concealed carry states. Ludwig used state-level data—rather than county-level data used by Lott and Mustard—and included two additional years of data (1993 and
24 1994), but used the same regression analysis method used by Lott and Mustard. Ludwig asserted that his use of state-level data, and the inclusion of 1993 and 1994 data were unlikely to explain differences in his findings from that of Lott and Mustard’s findings because excluding data from 1993 and 1994 caused an even greater estimated positive effect of concealed carry laws on adult homicides. Ludwig concluded that his study produced little evidence that suggested concealed carry laws reduced crime and noted that these laws were as likely to increase crime as to
decrease crime. Ludwig cautioned that although there may be reasons to support concealed carry laws, the belief that these laws reduce crime should not be among them.
Another analysis based on Lott and Mustard’s (1997) data was conducted by Ayres and Donohue (2003). Ayers and Donohue expanded upon Lott and Mustard’s work by having added five years of data and having included 24 states with shall-issue concealed carry laws. At the time the Lott and Mustard study was conducted, four fewer states had shall-issue laws in place. Ayers and Donohue used a separate dummy and time-trend variable for each of the 24 states to estimate state-specific effects of shall-issue laws on nine types of crime (including violent crimes) examining 216 possible effects of shall-issue laws, as opposed to the Lott and Mustard study, which examined the effects of shall-issue laws on crime in an aggregated manner.
Ayers and Donohue’s disaggregated research model revealed that six states with shall-issue laws experienced significant increases in violent crime, one state
25 (Florida) experienced a significant decrease in violent crime, and 17 states
experienced results that were not statistically significant causing the authors to have concluded that the adoption of shall-issue laws were associated with higher levels of crime. Two key factors contributed to the differences between results obtained from aggregated and disaggregated models. States with a large number of counties with high populations (i.e., Florida) tended to have a greater influence in Lott and Mustard’s aggregated model than did states with fewer and less densely populated counties. In addition, states that enacted concealed carry laws early-on (i.e., Florida and Georgia) also had greater influence in the aggregated model as compared to Ayres and Donohue’s disaggregated model.
Although not an examination of the effects of concealed carry laws on crime, Grossman and Lee (2008) examined trends in concealed handgun laws for a period of 1960 through 2001. The authors’ stated goal was “…not to reassess the debate over consequences of various gun control regimes, but instead to explain the timing and pattern of adoption of different gun control laws across U.S. states…” (p. 198) with particular focus placed on concealed carry handgun laws. The researchers used a duration model to measure the length of time it took for states to adopt shall-issue laws (for those states that did in fact adopt such laws). They also examined the likely causes for such changes in concealed carry laws while also studying the
characteristics of states that chose to adopt shall-issue laws as compared to those states that did not adopt shall-issue laws. The researchers found that less urban states were more likely to adopt shall-issue laws than were more urbanized states and states
26 were more likely to enact shall-issue laws if bordering states had shall-issue laws in place, although the rationale for doing so was unclear. Grossman and Lee did not find strong evidence that either Republican or Democrat control of state governments influenced the decision to adopt shall-issue laws. Nor did they find that the level of crime led to the changes in concealed carry laws. However, changes (increasing) crime rates did have a positive and statistically significant effect on states’ having decided to adopt shall-issue laws, suggesting that shall-issue laws were enacted in response to rising crime rates.
This study examined the relationship between firearms legally carried concealed by private citizens and crime rates for the crimes of willful homicide, forcible rape, robbery, and aggravated assault. Although, there has been a great deal of research completed in regards to the relationships of firearms and crime in general, relatively few studies have examined the relationship of concealed carry weapons laws and certain violent crime rates in California. The body of knowledge in the general area of guns and violence is relatively broad and encompasses a variety of related issues. However, the body of knowledge regarding concealed carry laws is much narrower and heavily focused on shall-issue laws. Consequently, relatively little is known about the effects of may-issue concealed carry laws, particularly
California’s may-issue concealed carry laws. This writer was able to find only one such study, a study conducted by Cramer and Kopel (1995), in which California’s concealed carry laws effects on violent crimes were examined by using a cross-sectional research design. In the Cramer and Kopel study, counties were grouped to
27 together into three categories depending on the prevalence of concealed carry permits. The three categories were comprised of highly restrictive CCW counties, those with the lowest rate of CCW permits; moderately restrictive counties, those with moderate rates of CCW permits; and non-restrictive counties, those with the highest rates of concealed carry permits. California’s concealed carry laws were examined on a county-by-county basis. It makes sense to have examined the issue in this manner because the California Department of Justice maintains statistics on the issuance of licenses to carry concealed weapons on a county-by-county basis and because the distribution of concealed carry licenses vary greatly between counties, as do crime rates. Although CCW rates and crime rates vary greatly among counties, California’s concealed carry laws are statewide laws and therefore are consistent among all counties.
In their study, Cramer and Kopel (1995) used 1989 data to compare the number of CCW permits issued per California county with certain violent crime rates for each county. Cramer and Kopel divided California’s 58 counties into three groups based on their various levels of issued CCW permits: (a) highly restrictive counties, (b) moderately restrictive counties, and (c) non-restrictive counties. The first group consisted of 19 highly restrictive counties with each county had less than 100 CCW permits issued per 100,000 residents. The second group was comprised of 22 moderately restrictive counties with each county having issued between 100 and 1,000 concealed carry permits per 100,000 residents. The last group consisted of 17
28 non-restrictive counties with each county had issued more than 1,000 CCW permits per 100,000 residents.
Cramer and Kopel (1995) found an inverse relationship between the CCW permit rates and violent crime rates. Specifically, as the rate of CCW permits increased, violent crime rates decreased. The study indicated lower rates of
aggravated assaults, forcible rapes, robberies, and homicides observed in moderately restrictive counties when compared to the highly restrictive counties and even lower rates of violent crimes for non-restrictive counties when compared to moderately restrictive and highly restrictive counties. Lastly, the highly restrictive group had rates greater than the state averages for each crime category examined.
However, Cramer and Kopel (1995) advised that their results be interpreted with caution noting that several factors other than CCW permit rates may be at least partially responsible for the differences in crime rates. The 19 counties that comprised the highly restrictive group were largely urban and the third group consisting of 17 non-restrictive counties was primarily rural. Therefore, the differences in crime rates may be attributed to differences in demographics and other factors other than
29 CHAPTER III METHODOLOGY
The purpose of the study was to conduct a quantitative analysis, using official data, of California’s concealed carry laws’ effects on violent crime. Although this study was not a replication of Lott and Mustard’s (1997) study, the underlying
research questions were essentially the same, whether more guns do equal less crime? Specifically, the study presented the following hypotheses for examination; (a) counties having higher rates of concealed carry permits have lower rates of aggravated assaults, (b) counties having higher rates of concealed carry permits have lower rates of forcible rape, (c) counties having higher rates of concealed carry permits have lower rates of robberies, and (d) counties having higher rates of concealed carry permits have lower rates of willful homicides. If the notion that increased rates of concealed carry permits produced the largest decreases in violent crime rates (see Cramer & Kopel, 1995; Kleck & Patterson, 1993; Lott, 2010; and Lott & Mustard, 1997) holds true, then the study should bear this out by having demonstrated inverse relationships between the rate of concealed carry permits and violent crime rates.
All data used in this study were secondary data obtained from public agencies and were readily available to the public. The data did not include any identifying information regarding individuals. Nor did this researcher interact with, cause
30 interactions with, or collect data directly from individuals. Therefore, this study was not human subject research.
Definition of Terms
The term concealed carry license was used interchangeably with the terms concealed carry licenses and licenses to carry a concealed weapon (also known as CCW). California’s concealed carry laws are enumerated under Penal Code sections
12050 through 12054, which provides that a sheriff of a county, or the chief, or other
head of a municipal police department of any city or city and county the authority to issue licenses to carry a pistol, revolver, or other firearm capable of being concealed upon the person. California Penal Code section 12051 (a) (3) (A) requires the attorney
general to prescribe a statewide standard application form for a CCW license thereby
standardizing the application process throughout California’s 58 counties and 478 incorporated cities. In order to receive a license to carry a concealed weapon, applicants must be of good moral character (as evidenced by clearing a criminal background investigation), have completed an approved course of firearms training, and where good cause exists for the issuance of the license (California Department of Justice, 2002).
The dependent variables used in the study consisted of; (a) aggravated assault, (b) robbery, (c) forcible rape, and (d) willful homicide. The Federal Bureau of
Investigations (2004) defined these crimes in the following manner: Aggravated assault was defined as an unlawful attack by one person upon another person, for the purpose of inflicting severe or aggravated bodily injury. Aggravated assaults are
31
usually committed with weapons or by other means likely to result in death or great bodily harm. Robbery was defined as the taking, or attempting to take, anything of value from the care, custody, or control of another person through the use of force or threats to use force, and causing the victim to fear for the victim’s safety. Forcible rape was defined as the unlawful carnal knowledge of a female forcibly and against her will. Lastly, willful homicide was defined as the willful (i.e., nonnegligent) killing of one human being by another (Federal Bureau of Investigations, 2004).
Population
The study’s population was California State with its 58 counties comprising the units of analysis. Every county has its own sheriff who is authorized under California law to issue licenses to carry concealed weapons. Most counties contain several cities each having police chiefs who may also issue concealed carry permits. However, there were large variances between counties. Consider Alpine County, which had no incorporated cities, as compared to Los Angeles County’s 88
incorporated cities (Nelligan & Bourns, 2011). Similar variances were also evident in other demographics such as in the number of concealed carry permits, crime rates, and population figures. The data used in the units of analysis came from a number of official state and federal sources including the Federal Bureau of Investigation’s (2011) Uniform Crime Report, California Department of Justice (2008), and the California State Department of Finance (2011).
32
Treatment
The study utilized a cross-section research design to examine the relationships and associations between county-level concealed carry permit rates (across 2005 through 2007) and county-level rates of aggravated assault, robbery, forcible rape, and willful homicide for the years 2005 through 2009.
The Rand California databases were the primary source of data in the research project excluding concealed carry permit data, which were obtained from the
California Department of Justice. California Department of Justice is the state’s lead law enforcement agency and is not only responsible for the issuance of concealed carry permits, but also its collection, compilation, and maintenance of data and records related to concealed carry licenses in California. RAND California (2011a) included data obtained from the Federal Bureau of Investigation’s Uniform Crime Reports and was the source for state and county-level crime data. Data regarding population figures and population densities were retrieved from the California Department of Finance and the US Census Bureau, respectively, through RAND California (2011b).
The study’s independent variable was the rate of concealed carry permits issued. This variable was measured as a ratio-level measurement. The number of concealed carry permits was the annual mean number of concealed carry permits across 2005–2007 and was comprised of all concealed carry weapons permits issued to private citizens, reserve police officers, judges, and prison/jail custody personnel. The rate of issued concealed carry licenses was determined by taking the mean
33 number of CCW licenses issued per county and dividing that figure by the county’s total estimated annual mean population across 2005–2009, then multiplying the result by 100,000 population so that the product was expressed as number of permits issued per 100,000. For example, Stanislaus County had an average of 637 concealed carry permits issued to residents and an estimated population of 517,027. Stanislaus County CCW permit rate is arrived at by dividing the number of CCW permits issued (637) by the county’s total population (517,027), then multiplying the product by 100,000 to arrive at the rate of 123.27 concealed carry permits per 100,000. County population figures were obtained from the California Department of Finance’s E-4 population estimates report (2011) and were reported as a five-year annual mean for 2005
through 2009. Population estimates reported by the California Department of Finance tended to be somewhat higher than estimates reported in the Federal Bureau of Investigation’s Uniform Crime Report, but were likely to be more accurate (Nelligan & Bourns, 2011). Concealed carry permit data were obtained through reports
prepared by and available through the California Department of Justice (2008), which was the most current available concealed carry permit data. The California
Department of Justice no longer published concealed carry permit data and had not done so since 2008 (personal communication, September 8, 2011).
Four dependent variables were included in this study. They were aggravated assault rate, robbery rate, forcible rape rate, and willful homicide rate. The dependent variables were measured at ratio-level measurement. Data for these offenses were obtained through the Federal Bureau of Investigation’s (2011) Uniform Crime
34 Reports. Crime rates were comprised of five-year annual means for 2005 through 2009 and were reported as rates per 100,000. The four respective crime rates were measured by dividing the five-year (across 2005–2009) mean number of reported aggravated assaults, forcible rapes, robberies, and willful homicides, respectively, in a given county, by 100,000.
The study used two types of control variables. The first was crime clearance rates for aggravated assault, robbery, forcible rape, and willful homicide. The second control variable was population density. These control variables were used to rule out their possible influences on the dependent variables. Both types of control variables were measured at the ratio-level measurement. A crime is considered cleared when at least one person is arrested for the offense, charged with the offense, and referred to a court for prosecution. Crimes may also be cleared by exception (e.g., death of the offender prior to his arrest or prosecution) (Federal Bureau of Investigations, 2004). It makes sense to include crime clearance rates as a control varible because research indicates that arrest rates can have a statistically significant, inverse effect on crime as was discovered in a recent study of California’s crime clearance rates on violent crime (Worrall, 2006). Crime clearance rates were reported as the percentage of crimes cleared and were determined by dividing the number of cleared crimes by the number of reported crimes then multiplied by 100 to convert the result into a
percentage. These data were obtained from FBI’s (2011) Uniform Crime Reports. Similarly, population density was chosen as a control variable because of its reported positive correlations to certain crime rates (Lester, 1999) and was used to control for
35 differences between urbanized counties and rural counties. Population density was measured by the dividing county population by the number of square miles contained within the county. Population density data is reported as the number of persons residing per square mile. Population data were obtained from the California Department of Finance (2011).
Data Analysis Procedures
Upon completion of data collection, the data were organized and entered into the Statistical Program for the Social Sciences (SPSS) so that quantitative data analyses could be conducted. The use of descriptive statistics identified frequency distributions and central tendencies including mean, median, mode, skew, and kurtosis.
In order to ensure normal distributions of data in the variables, box-plots were used to identify outlying and extreme data values, which were then excluded from analyses. The use of the one–sample Kolmogoroz–Smirnoz test verified and confirmed that normal distributions of data were in fact obtained in all variables.
Next, independent sample t-tests were conducted to measure the differences of means in crime rates between counties with high rates of concealed carry permits and counties with low rates of concealed carry permits. The group of counties in the 75th percentile (greater than or equal to 743.42 concealed carry permits per 100,000 population) were compared to counties in the 25th percentile (less than 743.42 concealed carry permits per 100,000 population) based on respective crime rates (aggravated assault, forcible rape, robbery, and willful homicide). The 75th percentile
36 was chosen as the preferred cut-point for the comparisons because if rational choice theory held true, then the greatest deterrent effect should have been observed in the group with the highest rates of concealed carry permits over the group of counties with lower concealed carry permit rates.
Next, correlations were determined using Pearson product-moment correlation coefficients (r) to measure the strength and direction of linear relationships between the independent variable of concealed carry permits and the dependent variables of crime rates (i.e., aggravated assault, robbery, forcible rapes, and willful homicide) while controlling for the control variables of population density and crime clearance rates.
Lastly, multivariate linear regression models were used to examine the effects of concealed carry laws on the rates of aggravated assault, forcible rape, robbery, and willful homicide while controlling for the effects of population density and respective crime clearance rates. Regression models were used to determine whether, and to what extent, concealed carry permit rates predicted crime rates. Specifically,
multivariate linear regression helped to answer the question of whether California’s concealed carry laws caused variations in aggravated assault rates, robbery rates, forcible rape rates, and willful homicide rates—and if so, in what direction and to what extent?
37 CHAPTER IV
RESULTS
This study examined the effects of California’s concealed carry laws on the crimes of aggravated assault, robbery, forcible rape, and willful homicide within the framework established by rational choice theory. The study used relevant crime data and concealed carry permit data to test four hypotheses; (a) counties with higher rates of concealed carry weapons permits have lower rates of aggravated assault, (b) counties with higher rates of concealed carry permits have lower rates of robbery, (c) counties with higher rates of concealed carry permits have lower rates of forcible rape, and (d) counties with higher rates of concealed carry permits have lower rates of willful homicide.
An examination of the data tables was useful not only in describing the study population, but also in identifying trends. For example, El Dorado County reportedly cleared about an average of 118% of its willful homicides. This unusual number is likely the result of having cleared willful homicides during the period of study that were reported as uncleared in previous years. In addition, several counties reported clearance rates for various offenses of 0%, a product of having had no reported crimes of the type or having not cleared the crime. Box-plots identified these and several other outlying data values, which were excluded from analysis in an effort to produce an accurate reporting of results by achieving normal distributions of data for each of the variables.
38 It should be noted that data analyses in this research project consisted of the entire population of counties in California. Therefore, there was no sampling error, and according to statistical theory, tests of significance were not warranted. However, in keeping with common practice, p-values were reported and t-test results were presented in order to illustrate the magnitude of differences.
Characteristics of the Population
The study population was comprised of all of California’s 58 counties with a total population of about 37,524,473 (annual mean across 2005–2009) spread across approximately 155,779 square miles for an average population density of about 111 persons per square mile (U.S. Census Bureau, 2012). California counties (see Appendix A) issued a total annual mean of about 41,122 licenses to carry concealed weapons (across 2005–2007) representing approximately 0.11% (or about 110 permits per 100,000 population) of the state’s population were legally licensed to carry concealed handguns annually during the period of examination (California Department of Justice, 2008). Los Angeles County was the largest county in terms of population (across 2005–2007) with about 10,271,400 residents. Alpine County was the least populated county having an average of 1,231 residents. Meanwhile, San Francisco County had the highest population density with an annual mean of about 17,660 residents per square mile. The least densely populated counties were Alpine, Inyo, and Modoc Counties, each having had an annual mean population density of two persons per square mile (California Department of Finance, 2011).
39 Table 1 presents a summation of data describing the population. With regard to concealed carry permit rates, the annual mean number of concealed carry permits was approximately 423 CCW permits per 100,000 population per county (across 2005–2007). The relatively large standard deviation (SD = 445) indicates that a large number of counties issued few concealed carry permits. Seven counties (Alpine, Amador, Mariposa, Modoc, Plumas, Sierra, and Trinity)—each at the high end of the rates of CCW permits issued—were excluded from analysis in order to obtain normal distributions of the data. A similar circumstance was observed with regard to
population density in that its standard deviation (SD = 127.94) was relatively large compared to the mean of about 111 persons per square mile. This suggests that many counties were relatively rural. This was further evidenced by low population density figures. In addition, Table 1 provides crime clearance data, which were reported as the percentage of crimes cleared. Willful homicides were cleared most frequently (M
40 Table 1
Characteristics of the Population
Variables M SD N Valid Response % Independent Variable CCW rate 423.27 445.62 51 87.93 Dependent Variables Aggravated assault 282.20 86.02 55 94.83 Robbery 70.14 48.18 53 91.38 Forcible rape 25.96 6.88 49 84.48 Willful homicide 3.85 2.24 54 93.10 Control Variables Population density 111.54 127.94 47 81.04
Agg. assault clearance rate 57.00 14.33 55 94.83
Robbery clearance rate 34.19 9.78 53 91.38
Forcible rape clearance rate 36.15 13.51 56 96.55 Willful homicide clearance 67.73 20.75 52 89.66
Note. Variations in N were a result of excluding counties with outlying data values. CCW rate is the annual mean number of CCWs per 100,000 across 2005–2007. Crimes are reported as the annual mean per 100,000 population across 2005–2009. Clearance rates are reported as an annual mean percentage across 2005–2009.
41
Aggravated Assault
To test the first hypothesis, the researcher performed an independent-samples t-test. Aggravated assault rates were compared between the 11 counties that comprised the 75th percentile of CCW rates (greater than or equal to 743.42 CCWs per 100,000) and the second group consisting of 38 counties each with less than the cut-point of 743.42 (per 100,000 residents) concealed carry permits. The analysis revealed that the group with fewer concealed carry permits experienced an annual mean of about 12 more aggravated assaults per 100,000 population (M = 287.97, SD = 79.29) than the group of counties with the higher rate of concealed carry permits (M = 275.8, SD = 113.37). The results indicate that those counties with highest number of concealed carry permits experienced approximately 4% fewer aggravated assaults when compared to the group of counties having lower rates of concealed carry permits. However, the results were not statistically significant (p = .68).
Table 2
Means Differences for Aggravated Assault
CCW Rates M SD t(47) p
Counties ≥ 743.42 275.80 113.37 -.406 .68
Counties < 743.42 287.97 79.29
Mean difference -12.17
42 Table 3 displays a Pearson product–moment correlation coefficient (r) which examined the direction and strength of association between aggravated assault and concealed carry permits. This researcher conducted a partial-correlation analysis in order to control for the effects of aggravated assault clearance rates and population density. Therefore, correlation values for the control variables were not produced. The analysis exposed an almost negligible negative association between the two variables (r = -.009, N = 38,). The results suggest that concealed carry permits had almost no association with aggravated assault rates. In addition, the results were not statistically significant (p = .96).
Table 3
Means, Standard Deviations, and Intercorrelation for Aggravated Assault
Measure M SD r p
Aggravated Assault 288.64 89.68 –
CCW rate 523.80 430.72 -.009 .96
A.A. clearance rate 60.40 11.86 Population density 122.03 119.64
Note. Two-tailed test of significance.
Table 4 summarizes the influence of concealed carry permit rates on rates aggravated assault. Multivariate linear regression analysis controlled for the effects of population density and aggravated assault clearance rates. The results suggest that
43 con