Agribusiness & Applied Economics 638 December 2008
Impact on the SURE Program
on North Dakota Farms
Prepared for
North Dakota Farmers Union
Richard D. Taylor and Won W. Koo*
Center for Agricultural Policy and Trade Studies Department of Agribusiness and Applied Economics
North Dakota State University Fargo, North Dakota 58108-6050
Acknowledgments
The authors extend their appreciation to Andrew Swenson and Frayne Olson for their constructive comments and suggestions. Special thanks go to Ms. Judy Normann, who helped to prepare the manuscript.
This manuscript is prepared for the North Dakota Farmers Union.
The analysis and views reported in this paper are those of the author(s). They are not necessarily endorsed by the Department of Agribusiness and Applied Economics or by North Dakota State University.
This publication is available electronically at this web site: http://agecon.lib.umn.edu/. You can address any inquiries to: Center for Agricultural Policy and Trade Studies, Agribusiness & Applied Economics, NDSU Dept. 7610, P.O. Box 6050, Fargo, ND, 58108-6050, Phone 701-231-7334, Fax 701-231-7400, e-mail ndsu.capts@ndsu.edu.
Table of Contents Page List of Tables ... i List of Figures ... ii Abstract ... iii Highlights ... iv Introduction ... 1 Revenue Calculations ... 2
Representative Farms and Yield Distribution by Region ... 5
Estimated Benefits by Region Under SURE ... 7
65% Crop Insurance Election ... 7
75% Crop Insurance Election ... 7
85% Crop Insurance Election ... 8
Net Farm Income ...9
Summary ... 12
List of Tables
No. Page
1 Ad Hoc and Emergency Payments to U.S. and
and North Dakota Farmers, 2001-2007 ... 1
2 Calculation of Program Guarantee, Computed Actual Revenue, and Expected Revenue under Normal Crop Conditions ... 4
3 Calculation of Program Guarantee, Computed Actual Revenue, and Expected Revenue under Disaster Crop Conditions ... 4
4 Average Yields and Standard Deviations for North Dakota Crops ... 5
5 Average Commodity Prices and Standard Deviations for North Dakota Crops ... 6
6 Distribution Frequency and Amount of Crop Insurance Payments ... 8
7 Distribution Frequency and Amount of SURE Payments ... 9
List of Figures
No. Page
1 Net Farm Income Distribution for the Average Profit RRV Representative
Farm With and Without the SURE Program ... 10
2 Net Farm Income Distribution for the Average Profit North Central Representative
Farm With and Without the SURE Program ... 10
3 Net Farm Income Distribution for the Average Profit South Central Representative
Farm With and Without the SURE Program ...11
4 Net Farm Income Distribution for the Average Profit West Representative
Abstract
Agricultural producer groups have stressed for years the need for a disaster title in the farm bill. In the 2008 Farm Bill, the Supplemental Revenue Assistance Program (SURE) was included to address that need. Previously, producers had to convince Washington to fund ad hoc and emergency disaster declarations in times of low crop returns. This study reviews the SURE program and estimates the effectiveness of the program for North Dakota farmers. The SURE program replaces disaster funding; however it also probably prevents additional assistance under extra ordinary conditions.
Keywords: SURE, Supplemental Revenue Assistance Program, 2008 Farm Bill, net farm
income, North Dakota Representative Farm Model, disaster funding.
Highlights
During the past 7 years, North Dakota agricultural producers received about $1.1 billion in ad hoc and emergency funding through disaster funding. The SURE program, in the 2008 farm bill, addresses this funding and is designed to replace the temporary funding measures enacted by congress. The SURE program is a whole farm revenue coverage program which is tied to federal crop insurance. Fifteen percent of direct and counter-cyclical payments are added to total farm revenue along with all other federal payments before SURE benefits are calculated.
The SURE program can be triggered two different ways. First, a farm is qualified for SURE payments if a county is included in a federal disaster declaration or if the county is contiguous to a county with a declaration or secondly, if a farm suffers a 50% revenue loss.
The crop insurance protection level impacts SURE benefits. Higher crop insurance levels provide higher SURE benefits. Crop insurance benefits are paid first and are added to farm revenue before SURE benefits are determined.
The North Dakota Representative Farm Model was used to estimate the impact of the SURE program on North Dakota producers. The model divides the state into four regions based on location within the state.
The benefits of the SURE program vary depending upon which region the producer is located. The West and North Central regions benefit from the SURE program because the variation in crop yields is large enough to trigger program payments. However, the RRV and SC regions receive limited benefits from the SURE program.
The benefits of the SURE program are that the program is in place and not subject to congressional or political negotiations after the disaster event and that protection levels are known before hand. There is a tradeoff between certainty and absolute payment levels. The downside to the SURE program is that producers will not be able to approach congress for emergency funding in the event of some future unforeseen disaster.
Impact of the SURE Program on North Dakota Farms
Richard D. Taylor and Won W. KooIntroduction
U.S. agriculture has had a history of ad hoc and emergency payments from the U.S. government to cover losses from natural causes. Since 2001, U.S. farmers have received $17.6 billion and North Dakota farmers have received $1.1 billion (Table 1). Each year emergency disaster declarations are passed and congress is asked to make payments to agriculture. In the 2002 Farm Bill, the counter cyclical program was designed to address the price side of this volatility. However, production volatility remained. Federal crop insurance provides some protection, although premium rates increase significantly as full protection levels are reached. The 2008 Farm Bill includes a permanent disaster assistance program which will supplement federal crop insurance protection and is intended to address the disaster payments issues.
The Supplemental Revenue Assistance Program (SURE) is a whole-farm disaster assistance program that is tied to federal crop insurance coverage and farm planted acreage. The SURE program will cover 2008-2011 crop years. To be eligible for the SURE program, producers are required to purchase federal crop insurance for all of the crops produced. The SURE program can be triggered two different ways. First, a farm is qualified for SURE
payments if a county is included in a federal disaster declaration or if the county is contiguous to a county with a declaration or secondly, if a farm suffers a 50% revenue loss.
Table 1. Ad Hoc and Emergency Payments to U.S. and North Dakota Farmers, 2001-2007
United States North Dakota
---Thousand $--- 2001 8,538,764 427,741 2002 1,654,969 79,760 2003 3,143,243 232,796 2004 582,353 12,172 2005 3,168,842 302,570 2006 274,504 1,724 2007 527,203 32,595 Source: USDA-ERS
Revenue Calculations
Sure payments are calculated using three main variables: program guarantee, computed
actual revenue, and expected revenue. The whole-farm guaranteed revenue (ΠF) for a farm is the
sum of insurable crop revenue for all crops on the farm and non-insurable crop revenue for all
other crops. The insurable and nonBinsurable crop revenue are calculated as;
ΠG = CI(115%) x PCI x YM x AG (1)
ΠN = NCAP(120%) x AN (2)
ΠC = 'ΠG G= 1,2,...n (3)
ΠH = 'ΠN N= 1,2,...n (4)
ΠF = ΠC + ΠH (5)
where ΠG = Insurable Crop Revenue
CI = Crop Insurance Coverage Level, percent coverage election
PCI = Crop Insurance Price Election
YM = Maximum of APH yield or CCP yield
AG = Planted area of insurable crops
ΠN = Non-insurable crop revenue
NCAP = Non-insurable crop assistance program revenue guarantee
AN = Planted area, non-insurable crop
ΠC = Sum of all insurable crop revenue
ΠH = Sum of all non-insurable crop revenue
ΠF = Whole-farm Guaranteed revenue
The expected farm specific SURE revenue is calculated as
ΠE = [(PCI x YM x AG) +(YCAP x AN x PNAP)](0.90) (6)
where ΠE = Sure expected revenue
YCAP = NCAP yield guarantee
PNAP = NAP Prices
The SURE computed actual revenue is calculated as
ΠA = '(HAc x Yc x Pc )+15%(DP + CCP or ACRE) +MKL + DIS + CP (7)
where c = 1,2,3...n
ΠA = SURE computed actual revenue
HAc = Harvest area for crop c
Yc =Actual Yield for crop c
Pc = National season-average price
CCP = Counter-cyclical payments
ACRE = Average Crop Revenue Election payments MKL = Marketing Loan Benefits
DIS = other disaster payments
CP = All crop insurance and NCAP payments
If the SURE computed actual revenue exceeds the farm-specific SURE program
guarantee, then there are no payments under the SURE program. If the computed actual revenue is below the program guarantee, and at least one of the two trigger events has occurred, then SURE payments will be made. The payments will be equal to 60% of the difference between the program guarantee and the computed actual revenue. The actual revenue guarantee cannot be greater that 90% of the expected farm revenue. For example, Table 2 shows the calculations of the SURE program during a normal crop year assuming that this farm has 500 acres of corn with a crop yield of 124 bushels per acre. It is also assumed that the RMA price election for corn is $5.10 per bushel, crop insurance protection level of 75% and price protection level of 100%. The program guarantee is calculated by; number of acres (500 acres) × crop insurance yield
protection level (75%) × price protection level (100%) × APH yield (124 bushels per acre) × RMA ($5.10) × 115%. The program guarantee for this farm is $272,723. The expected revenue is calculated by: number of acres (500 acres of corn) × APH yield (124 bushels per acre) × RMA ($5.10). The expected revenue is $316,200. The expected revenue is multiplied by 90%, which equals $284,580. The revenue guarantee is the smaller of the program guarantee and 90% of the expected revenue. In this case, the program guarantee is $272,723. Crop insurance revenue guarantee is calculated by; number of acres (500 acres of corn) × crop insurance yield protection level (75%) × yield (124 bushels per acre) × price level ($5.10). The revenue level which crop insurance would make payments is $237,150. Estimated crop value is calculated by: acres of corn (500 acres) × estimated yield (146 bushels) × national price ($5.20). Estimated crop value is $382,415. Since the estimated crop value is larger than the revenue guarantee, no SURE
payments are made along with any crop insurance payments.
A second example is shown in Table 3, where crop insurance and SURE payments are made under the same assumptions except that corn yield is 82 bushels per acre. The program guarantee and the expected revenue calculations are the same as in the previous example. The program guarantee and revenue is calculated at $272,723. Since the actual yield, in this example, is assumed to be 82 bushels per acre, crop insurance benefits are paid. The crop value, which is calculated by number of acres (500 acres of corn) × yield (82 bushels per acre) × national price ($5.50 per bushel), equals $225,500. Since the estimated crop value is less than crop insurance coverage, a crop insurance payment of $11,650 is made to the producer. The 15% of the direct payments, CCP, plus crop insurance payment are added to the estimated crop value. Total farm revenue is $238,650, which is less than the revenue guarantee. A SURE payment of $20,444 is made to the producer, which is 60% of the difference between the program guarantee and computed actual revenue.
The main differences between the SURE program and crop insurance is that farm revenue includes crop insurance payments, 15% of direct payments, all CCP payments, and all other disaster payments before SURE payments are calculated, and the SURE program is calculated on whole farm revenue not individual crop revenue.
Table 2. Calculation of Program Guarantee, Computed Actual Revenue, and Expected Revenue under Normal Crop Conditions
Program Guarantee Area Crop Ins Election Price Election APH
Yield Price Guarantee
Acres Percent Percent Bu/acre $/bu Percent Dollars
Corn 500 75 100 124 5.10 115 272,723
Expected Revenue
Corn 500 124 5.10 316,200
90% of Expected Revenue 284,580
Smaller of Program Guarantee
or 90% Expected Revenue 272,723
Crop Insurance
Corn 500 75 124 5.10 237,150
Crop Insurance Payment 0
Estimated Crop Value
500 147 5.20 382,415
Direct Payment, CCP, Crop Ins: 15% of DP + 0 + 0
1,500
Total Farm Revenue: $382,415 + $1,500
383,915 SURE Payment: ($272,723 - $383,915)0.6 0
Table 3. Calculation of Program Guarantee, Computed Actual Revenue, and Expected Revenue under Disaster Crop Conditions
Program Guarantee Area Crop Ins Election Price Election APH
Yield Price Guarantee
Acres Percent Percent Bu/acre $/bu Percent Dollars
Corn 500 75 100 124 5.10 115 272,723 Expected Revenue
Corn 500 124 5.10 316,200
90% of Expected Revenue 284,580 Smaller of Program Guarantee or
90% Expected Revenue 272,723 Crop Insurance
Corn 500 75 124 5.10 237,150 Crop Insurance Payment 11,650 Estimated Crop Value
500 82 5.50 225,500
Direct Payment, CCP, Crop Ins: 15% of DP + 0 + $11,650
13,150
Total Farm Revenue: $225,500 + $13,150
238,650 SURE Payment: ($272,723 - $238,650)0.6 20,444
Representative Farms and Yield Distribution by Region
Since the SURE program is based on yield and price variability, the benefits of the program will differ among regions of North Dakota. To estimate those benefits and differences in benefits the North Dakota Representative Farm Model, operational at the Center for Agricultural Policy and Trade Studies at North Dakota State University, was used to estimate the impacts of the SURE program on various representative farms across the state. Descriptions of the representative farms are available in Agribusiness & Applied Economics Report No. 634, 2008 North Dakota Agricultural Outlook: Representative Farms, 2008-2017.
The North Dakota Representative Farm Model estimates the distribution of net farm incomes based on means and standard deviations of crop yields and expected future prices. Future yields and prices are unknown with certainty. Therefore, distributions of yields and prices are used to estimate the distribution of net farm income. Table 4 shows the average yields and standard deviations of crops in the four regions of the state. The regions are the Red River Valley (RRV), the North Central region (NC), the South Central region (SC) and the West region. Average yields are higher in the RRV region than other regions, while standard deviations are lower. Average yields in the West region are lower than other regions and the standard deviations, in most cases, are higher. This indicates that the variability of net incomes in the RRV will be smaller than the rest of the state. On the other hand the variability of net income in the West region will be larger than other regions in the state.
Table 4. Average Yields and Standard Deviations* for North Dakota Crops
RRV NC SC West ---bushels/acre--- Spring Wheat 54.61 (10.20) 39.51 (10.89) 47.25 (11.37) 26.85 (12.02) Corn 140.07 (23.51) 107.43 (29.29) Soybeans 34.99 (6.46) 30.68 (9.2) Barley 73.46 (13.04 (18.17)59.66 (17.82)70.64 (17.55) 44.17 Durum Wheat 33.67 (10.27) 35.90 (8.24) 27.08 (11.54) ---pounds/acre--- Sunflowers 1715.9 (286.5) (450.0)1436.5 (381.3)1518.9 Canola 1572.1 (472.6) *Standard Deviations in parenthesis.
Yields are estimated from yield equations within the North Dakota Representative Farm Model.
Standard Deviations are estimated from six years of data from North Dakota Farm and Ranch Business Management Association.
Table 5 shows the mean values and standard deviations of future prices of North Dakota crops. The 2009 crop year was used for simulation as the 2008 crop year is almost complete. It was assumed that commodity prices will remain near the current levels and the variations of the
prices will center around those means. The computer software program @Risk by Palisade was
used to generate the price distributions. The model was simulated 1000 times, at which time the distribution became stable. After each simulation calculations were made to determine if the farms qualified for SURE payments. If they qualified, it was assumed that a disaster declaration had been made and the region was eligible for SURE payments. Three scenarios were analyzed with varying levels of crop insurance protection levels, 65%, 75% and 85%, to evaluate the differences in the SURE program under varying crop insurance levels.
Table 5. Average Commodity Prices and Standard Deviations* for North Dakota Crops
---dollars/bushel--- Spring Wheat (0.90) 7.26 Durum Wheat 10.72 (1.72) Barley 4.43 (0.52) Corn 5.11 (0.56) Soybeans 11.93 (1.29) ---dollars/cwt--- Sunflowers (2.66) 25.03 Canola 22.41 (2.28) *Standard Deviations in parenthesis.
Prices are estimated with price equations within the North Dakota Representative Farm Model.
Estimated Benefits by Region Under SURE
65% Crop Insurance Election
Table 6 shows the frequency of crop insurance payments in the four regions, the overall average distribution size of the payments, and the average of distributions that were paid. Farms in the West region received crop insurance payments 48.9% of the time under the 65% scenario which averaged $13,550 per payment. The overall average payment was $6,626 per year, which amounts to about $4.06 per acre per year. The NC region received crop insurance payments 28.2% of the time which averaged $19,502 per payment under the 65% crop election. The overall average payment was $5,616 per year which amounts to about $2.72 per acre per year in the NC region. The SC region received crop insurance payments 32.3% of the time which averaged $14,331 per payment. The overall average payment was $4,629 which amounts to about $2.55 per acre per year. The RRV received crop insurance payments only 6.7% of the time.
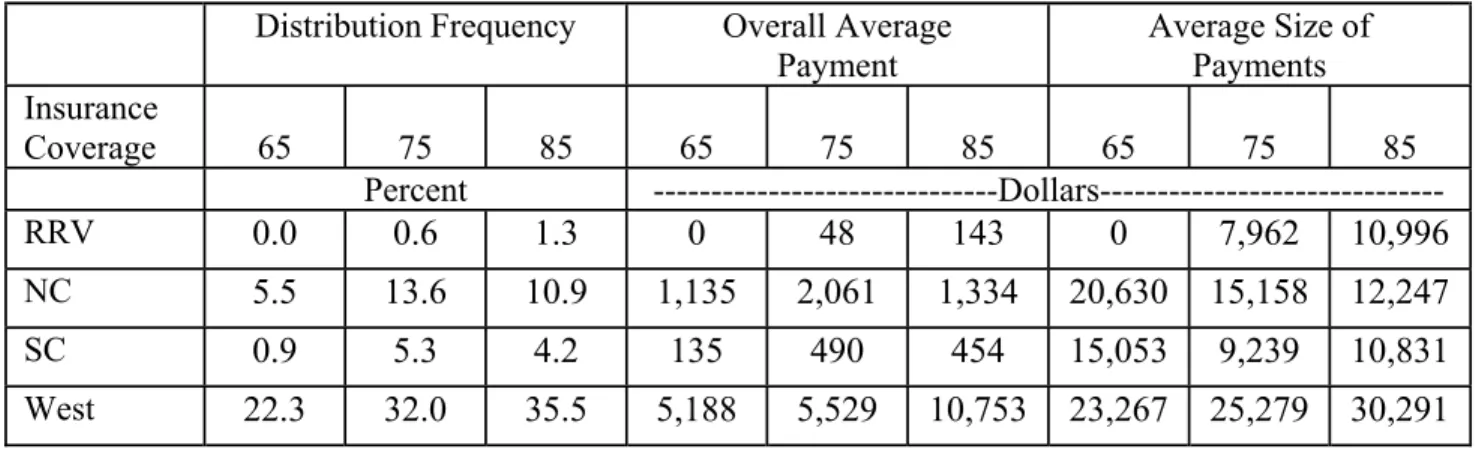
Table 7 shows the frequency of SURE payments in the four regions, the overall average payment and the average of payments that were paid. The level of crop insurance protection impacts the frequency and size of SURE payments. As the crop insurance protection level decreases the SURE protection guarantee decreases. This indicates that producers who try and reduce crop insurance premiums by lowering crop insurance levels may reduce the overall benefits of the SURE program.
Under the 65% crop insurance protection level, the West region received SURE
payments 22.3% of the time which averaged $23,267 per payment. The overall average payment was $5,188 per year, which amounts to about $3.17 per acre per year. The NC region received SURE payments 5.5% of the time which averaged $20,630 per payment. The overall average payment was $1,135 per year which amounts to about $0.53 per acre per year in the NC region. Farms in the SC region received SURE payments about 0.9% of the time which averaged
$15,053 per payment. The overall average payments were $135 per year which amounts to about $0.07 per acre per year. Farms in the RRV never received SURE payments under the 65% crop insurance protection level.
75% Crop Insurance Election
Under the 75% crop insurance protection level, the RRV received crop insurance
payments 20.4% of the time which averaged $16,338 per payment (Table 6). The overall average payment was $3,333 which amounts to about $1.91 per acre per year. The NC region received crop insurance payments 41.7% of the time which averaged $25,541 per payment. The overall average payment was $10,651 which amounts to about $5.09 per acre per year. The SC region received crop insurance payments 51.3% of the time which averaged $18,202 per payment. The overall average payment was $9,338 which amounts to about $5.16 per acre per year. The West region received crop insurance payments 59.5% of the time which averaged $16,836 per
payment. The overall average payment was $10,018 which amounts to about $6.14 per acre per year.
Farms in the West region received SURE payments 32% of the time which averaged $17,279 per payment under the 75% crop insurance protection level (Table 7). The overall average payment was $5,529 per year which amounts to about $3.39 per acre per year. The NC region received SURE payments 13.6% of the time which averaged $15,158 per payment. The overall average payment was $2,061 per year which amounts to about $1.00 per acre per year. The RRV and SC regions only received SURE payments 0.6% and 5.3% of the time,
respectively. These two regions do not benefit from the SURE program because the variability of yields is not large enough to trigger the SURE program. The largest single SURE payments was in the West region for $56,520, followed by $28,982 in the NC region, $26,338 in the SC region and $14,311 in the RRV region.
85% Crop Insurance Election
Under the 85% crop insurance protection level, the RRV received crop insurance
payments 43.2% of the time which averaged $23,003 per payment (Table 6). The overall average payment was $9,937 which amounts to about $5.69 per acre per year. The NC region received crop insurance payments 56.5% of the time which averaged $33,324 per payment. The overall average payment was $18,828 which amounts to about $9.00 per acre per year. The SC region received crop insurance payments 69.0% of the time which averaged $25,869 per payment. The overall average was $17,850 which amounts to about $9.86 per acre per year. The West region received crop insurance payments 72.5% of the time which averaged $19,962 per payment. The overall average payment was $14,473 which amounts to about $8.87 per acre per year.
Under the 85% crop insurance protection level, the West region received SURE
payments 35.5% of the time which averaged $30,291 per payment (Table 7). The overall average payment was $10,753 per year which amounts to about $6.59 per acre per year. The NC region received SURE payments 10.9% of the time which averaged $12,247 per payment. The overall average payment was $1,334 per year which amounts to about $0.64 per acre per year in the NC region. Farms in the SC region received SURE payments about 4.2% of the time which averaged $10,831 per payment. The overall average payment was $454 per year which amounts to about $0.25 per acre per year. Farms in the RRV received SURE payments about 1.3% of time under the 85% crop insurance protection level.
Table 6. Distribution Frequency and Amount of Crop Insurance Payments
Distribution Frequency Overall Average Payment Average Size of Payments Insurance Coverage 65 75 85 65 75 85 65 75 85 Percent ---Dollars--- RRV 6.7 20.4 43.2 938 3,333 9,937 13,996 16,338 23,003 NC 28.2 41.7 56.5 5,616 10,651 18,828 19,502 25,541 33,324 SC 32.3 51.3 69.0 4,629 9,338 17,850 14,331 18,202 25,869 West 48.9 59.5 72.5 6,626 10,018 14,473 13,550 16,836 19,962
Table 7. Distribution Frequency and Amount of SURE Payments
Distribution Frequency Overall Average Payment Average Size of Payments Insurance Coverage 65 75 85 65 75 85 65 75 85 Percent ---Dollars--- RRV 0.0 0.6 1.3 0 48 143 0 7,962 10,996 NC 5.5 13.6 10.9 1,135 2,061 1,334 20,630 15,158 12,247 SC 0.9 5.3 4.2 135 490 454 15,053 9,239 10,831 West 22.3 32.0 35.5 5,188 5,529 10,753 23,267 25,279 30,291
Net Farm Income
Figure 1 shows the distribution of net farm income for the average profit representative farm in the RRV under the 75% crop insurance protection level. There is no visible difference between the SURE program and without the program. Since the SURE program was activated only six times out of 1,000 simulations, differences should not be noticeable. The average net farm income without the SURE program in the RRV was $297.8 thousand, while the income was $297.9 thousand with the SURE program. The standard deviation without the SURE program was $100.6 thousand and $100.5 thousand with the SURE program.
In the NC region, the SURE program would be beneficial for producers. The range of net farm income observations was increased from zero to the $70 thousand range to the $70 to $90 thousand range (Figure 2). The average net farm income in the NC region was $249.1 thousand without the SURE program and $251.2 with the SURE program. The SURE program reduced the standard deviation from $133.3 thousand to $130.4 thousand.
The SC region is similar to the RRV; income changes due to the SURE program were small (Figure 3). Net farm income increased from $241.6 thousand to $242.1 thousand with the program, while the standard deviation decreased from $82.4 thousand to $81.5 thousand with the program.
Average net farm income increased by almost $6,000 in the West region with the SURE program. Figure 4 shows the changes in the distribution of net farm income in the West region. Average net farm income in the West region without the SURE program was $114.7 thousand compared to $120.2 thousand with the SURE program and the standard deviation was decreased from $43.4 thousand without the SURE program to $38.5 thousand with the SURE program.
7 0 9 0 1 1 0 1 3 0 1 5 0 1 7 0 1 9 0 2 1 0 2 3 0 2 5 0 2 7 0 2 9 0 3 1 0 3 3 0 3 5 0 3 7 0 3 9 0 4 1 0 4 3 0 4 5 0 4 7 0 4 9 0 5 1 0 5 3 0 5 5 0 5 7 0 Thousand $ 0 2 4 6 8 10 12 P e rc e n t Without SURE With SURE
RRV
Figure 1. Net Farm Income Distribution for the Average Profit
RRV Representative Farm With and Without the SURE program
5 0 7 0 9 0 1 1 0 1 3 0 1 5 0 1 7 0 1 9 0 2 1 0 2 3 0 2 5 0 2 7 0 2 9 0 3 1 0 3 3 0 3 5 0 3 7 0 3 9 0 4 1 0 4 3 0 4 5 0 4 7 0 4 9 0 5 1 0 5 3 0 5 5 0 5 7 0 5 9 0 6 1 0 6 3 0 6 5 0 6 7 0 Thousand $ 0 2 4 6 8 10 12 P e rc e n t Without SURE With SURE
North Central
Figure 2. Net Farm Income Distribution for the Average Profit
9 0 1 1 0 1 3 0 1 5 0 1 7 0 1 9 0 2 1 0 2 3 0 2 5 0 2 7 0 2 9 0 3 1 0 3 3 0 3 5 0 3 7 0 3 9 0 4 1 0 4 3 0 4 5 0 4 7 0 4 9 0 5 1 0 5 3 0 5 5 0 5 7 0 5 9 0 6 1 0 6 3 0 6 5 0 6 7 0 Thousand $ 0 1 2 3 4 5 6 7 8 9 P e rc e n t Without SURE With SURE
South Central
Figure 3. Net Farm Income Distribution for the Average Profit
South Central Representative Farm With and Without the SURE Program
6 0 7 0 8 0 9 0 1 0 0 1 1 0 1 2 0 1 3 0 1 4 0 1 5 0 1 6 0 1 7 0 1 8 0 1 9 0 2 0 0 2 1 0 2 2 0 2 3 0 2 4 0 2 5 0 2 6 0 2 7 0 2 8 0 2 9 0 Thousand $ 0 5 10 15 20 P e rc e n t Without SURE With SURE
West
Figure 4. Net Farm Income Distribution for the Average Profit
West Representative Farm With and Without the SURE Program
Summary
The SURE program was included in the 2008 Farm Bill to replace the ad hoc and
emergency disaster funding. The SURE program was designed to enhance federal crop insurance by increasing effective coverage levels without increasing premiums. Unlike federal crop
insurance the SURE program provides whole farm revenue coverage, which supports farm revenue at a predetermined level. Fifteen percent of direct payments and all other government and crop insurance payments are added to farm revenue before SURE program benefits are determined. The largest payments were made in the West region, over $50 thousand, or
approximately $35 per acre. The largest payments in the NC and SC regions were approximately $14 per acre, while the largest payment made in the RRV was approximately $8 per acre.
The SURE protection level is determined, in part, by the crop insurance protection level. As the crop insurance protection level decreases, the SURE protection level also decreases. The optimal crop insurance protection level will vary depending on location within the state. The West region seems to benefit from higher crop insurance level when compared to the east and central regions. Likewise, the West region should benefit from the SURE program more because of great crop production variability than other regions.
This analysis does not deal with catastrophic crop loses. The program is designed to operate within an expected range of crop yields and price variations. SURE payments are limited to 60% of the difference between federal crop insurance coverage and expected revenue. For example, if federal crop insurance coverage for a farm was $300 thousand, expected crop revenue was $375 thousand and actual crop revenue was zero, SURE payments would be $45 thousand while federal crop insurance payments would be $300 thousand.
Whether the SURE program will take the place of the ad hoc and emergency payments is unknown. Over the past 7 years, North Dakota received $1.1 billion in ad hoc and emergency payments or about $157 million per year. The SURE program provides an average of $3.40 per acre per year to the West region under the 75% crop insurance protection level. Even if that payment rate was spread over the entire state, the total SURE payment would average about $75 million per year. If the SURE payment rates of all regions were considered, the total SURE payment would average approximately $29 million per year for the state. The maximum SURE payment is about $17 per acre averaged across the state. With about 25 million acres in the state, the maximum SURE payment would be approximately $425 million. Similar to the ad hoc and emergency payment received in 2001 and slightly more than which was received in 2003 and 2005. The benefits of the SURE program are that the program is in place and not subject to congressional or political negotiations after the disaster event and that protection levels are known before hand. There is a tradeoff between certainty and absolute payment levels. The downside to the SURE program is that producers will not be able to approach congress for emergency funding in the event of some future unforeseen disaster.
References
Hart, Chad. New Permanent Disasters Assistance: How It Works and When to Expect Payments. Iowa Ag Review. Summer 2008. Center for Agricultural and Rural Development. Iowa State University. Ames, Iowa.
North Dakota Farm and Ranch Business Management Association. Annual Reports, various issues. Bismarck, ND
@RISK computer software. Palisade Corporation.
SURE Calculator, version 1 software. Farm Service Agency. August 2008.
Taylor, Richard D., Koo, Won W., and Swenson, Andrew L. 2008 North Dakota Agricultural Outlook: Representative Farms, 2008-2017. Agribusiness & Applied Economics Report No. 634, August 2008. Center for Agricultural Policy and Trade Studies. North Dakota State University. Fargo, ND.